| Param | Original file | Final file |
|---|---|---|
| Filename | modeM0/AS1G08_014T01_9000002104_14261cztM0_level2.evt | modeM0/AS1G08_014T01_9000002104_14261cztM0_level2_quad_clean.evt |
| Size (bytes) | 652,322,880 | 78,661,440 |
| Size | 622.1 MB | 75.0 MB |
| Events in quadrant A | 3,716,754 | 486,748 |
| Events in quadrant B | 4,837,486 | 481,525 |
| Events in quadrant C | 4,112,719 | 452,737 |
| Events in quadrant D | 6,586,976 | 445,087 |
| Mode M9 | |||
|---|---|---|---|
| Quadrant | BADHDUFLAG | Total packets | Discarded packets |
| A | 0 | 7 | 0 |
| B | 0 | 7 | 0 |
| C | 0 | 7 | 0 |
| D | 0 | 8 | 0 |
| Mode SS | |||
|---|---|---|---|
| Quadrant | BADHDUFLAG | Total packets | Discarded packets |
| A | 0 | 150 | 0 |
| B | 0 | 150 | 0 |
| C | 0 | 150 | 0 |
| D | 0 | 150 | 0 |
| Mode M0 | |||
|---|---|---|---|
| Quadrant | BADHDUFLAG | Total packets | Discarded packets |
| A | 0 | 15607 | 3 |
| B | 0 | 19163 | 2 |
| C | 0 | 16242 | 2 |
| D | 0 | 24663 | 2 |
| Quadrant | Total seconds | Saturated seconds | Saturation percentage |
|---|---|---|---|
| A | 7411 | 156 | 2.104979% |
| B | 7411 | 538 | 7.259479% |
| C | 7411 | 111 | 1.497774% |
| D | 7411 | 731 | 9.863716% |
Noise dominated data is calculated using 1-second bins in cleaned event files. If a bin has >2000 counts, and if more than 50% of those come from <1% of pixels, then it is considered to be noise-dominated and hence unusable.
| Quadrant | # 1 sec bins | Bins with >0 counts | Bins with >2000 counts | High rate bins dominated by noise | Noise dominated (total time) | Noise dominated (detector-on time) | Marked lightcurve |
|---|---|---|---|---|---|---|---|
| A | 7712 | 7413 | 0 | 0 | 0.00% | 0.00% | 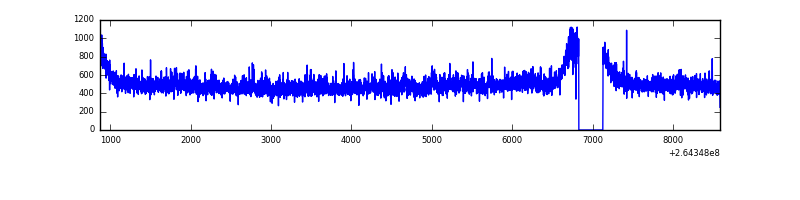 |
| B | 7712 | 7413 | 252 | 252 | 3.27% | 3.40% | 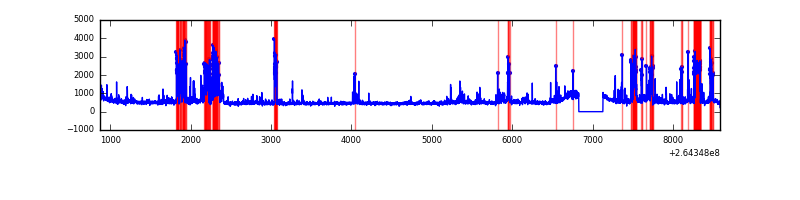 |
| C | 7712 | 7413 | 0 | 0 | 0.00% | 0.00% | 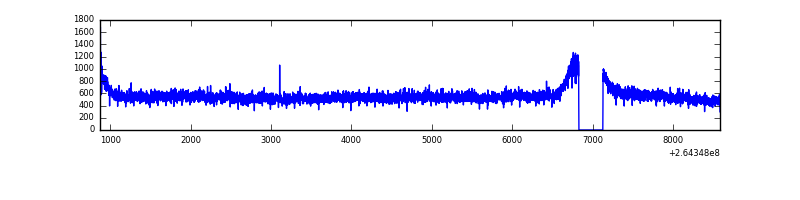 |
| D | 7712 | 7413 | 459 | 459 | 5.95% | 6.19% | 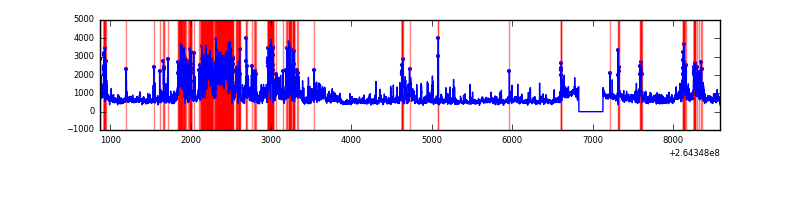 |
Top three noisy pixels from each quadrant. If the there are fewer than three noisy pixels in the level2.evt file, extra rows are filled as -1
| Pixel properties | Quadrant properties | ||||||
|---|---|---|---|---|---|---|---|
| Quadrant | DetID | PixID | Counts | Sigma | Mean | Median | Sigma |
| A | 12 | 189 | 109145 | 573.37 | 925 | 905 | 188.8 |
| A | 8 | 15 | 46622 | 242.17 | 925 | 905 | 188.8 |
| A | 0 | 226 | 8245 | 38.88 | 925 | 905 | 188.8 |
| B | 0 | 182 | 701063 | 4037.04 | 896 | 871 | 173.4 |
| B | 10 | 245 | 292868 | 1683.54 | 896 | 871 | 173.4 |
| B | 0 | 229 | 226828 | 1302.78 | 896 | 871 | 173.4 |
| C | 3 | 233 | 640083 | 3098.05 | 884 | 888 | 206.3 |
| C | 8 | 128 | 12166 | 54.66 | 884 | 888 | 206.3 |
| C | 8 | 112 | 6724 | 28.29 | 884 | 888 | 206.3 |
| D | 13 | 122 | 1866148 | 9013.57 | 866 | 845 | 206.9 |
| D | 5 | 222 | 601665 | 2903.3 | 866 | 845 | 206.9 |
| D | 8 | 195 | 459334 | 2215.52 | 866 | 845 | 206.9 |
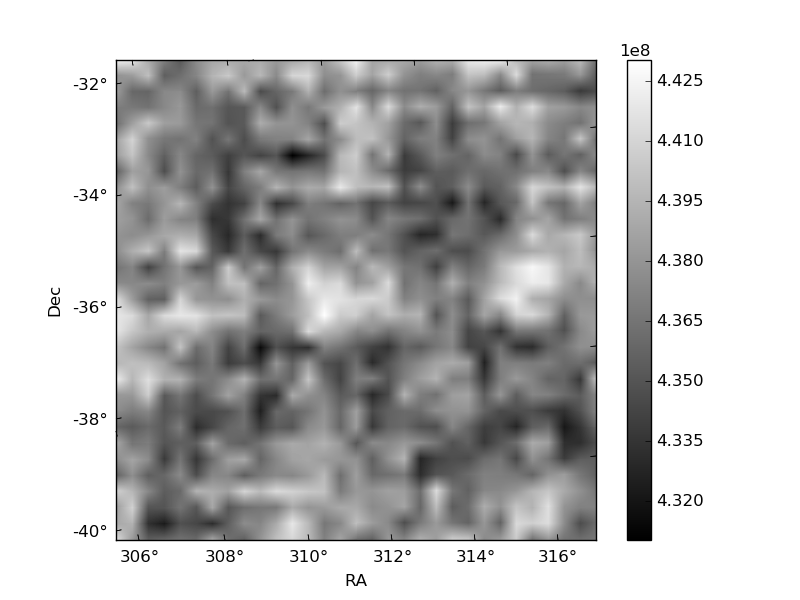
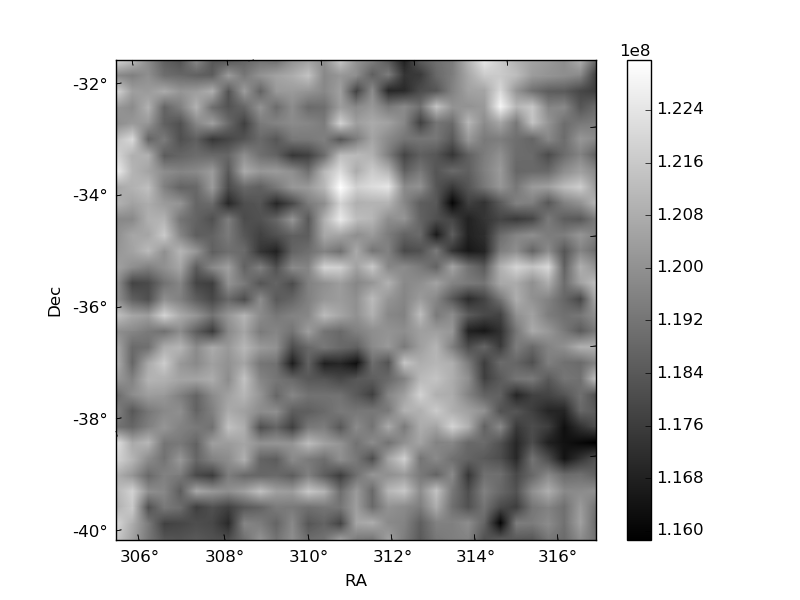
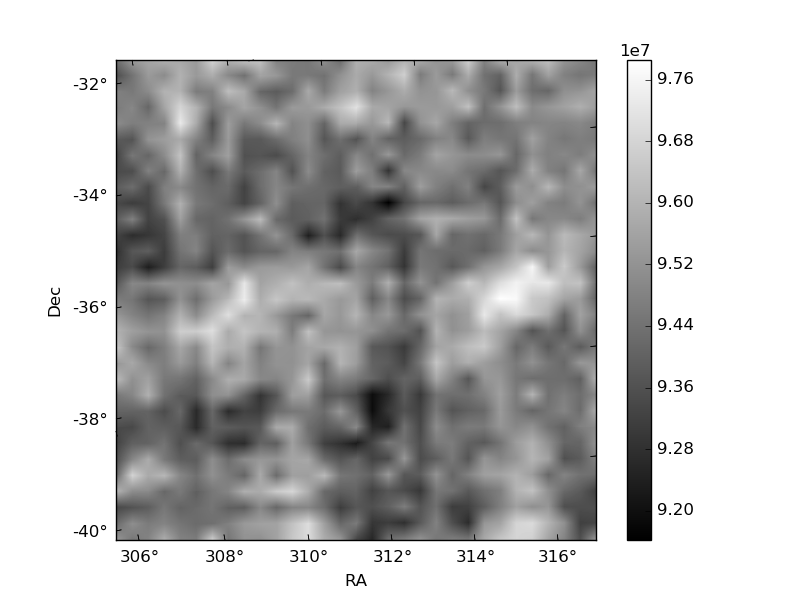
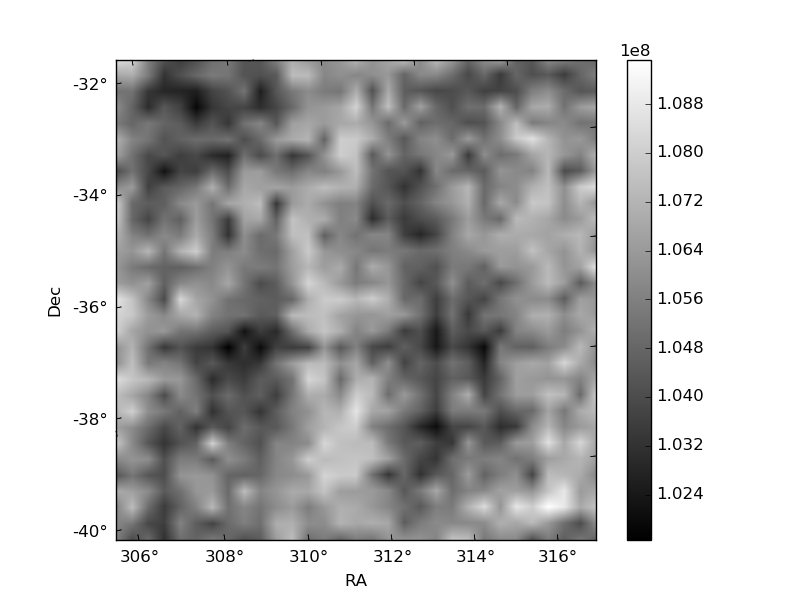
Histogram calculated using DETX and DETY for each event in the final _common_clean file
| Quadrant A | 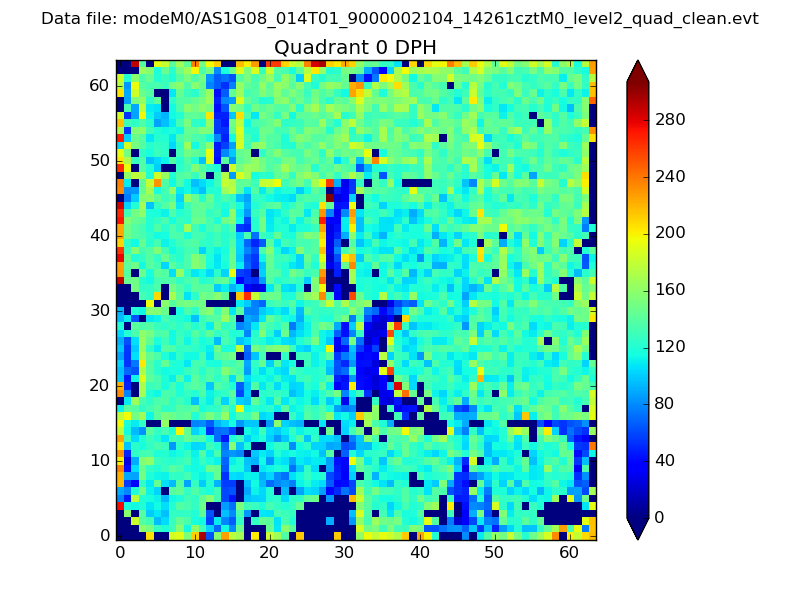 |
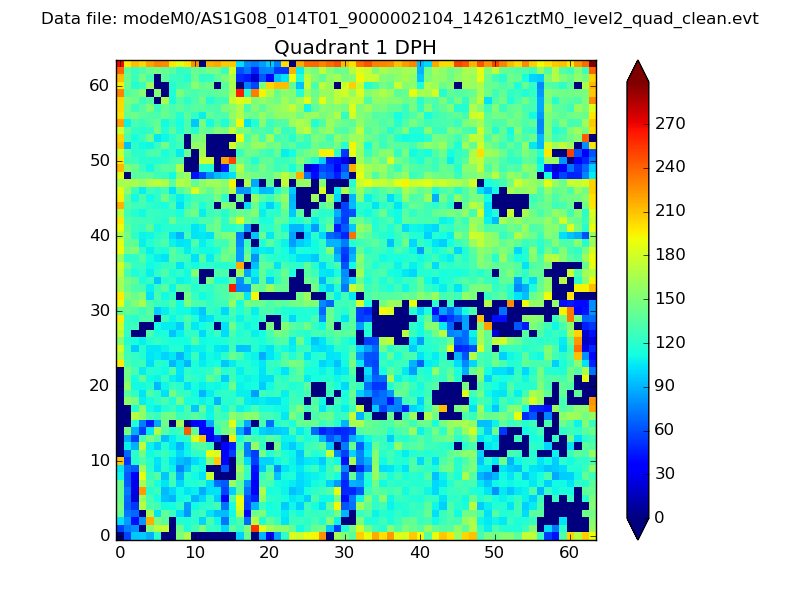 |
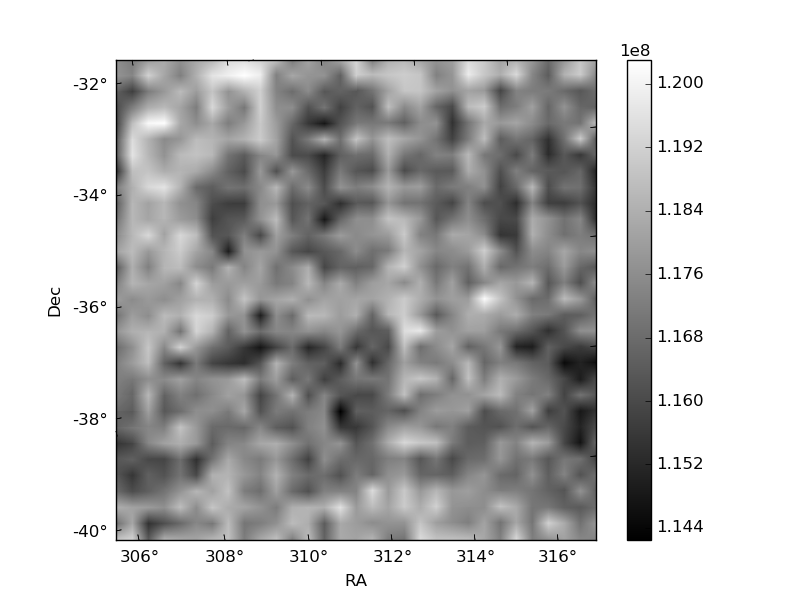
Quadrant B |
|---|---|---|---|
| Quadrant D | 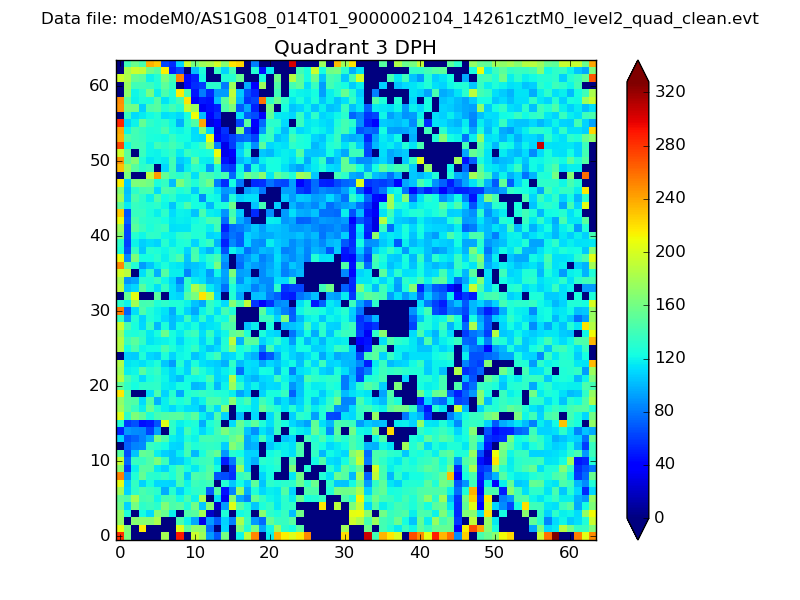 |
 |
Quadrant C |
| Plot type | Count rate plots | Images |
|---|---|---|
| Comparison with Poisson distribution Blue bars denote a histogram of data divided into 1 sec bins. Red curve is a Poisson curve with rate = median count rate of data. |
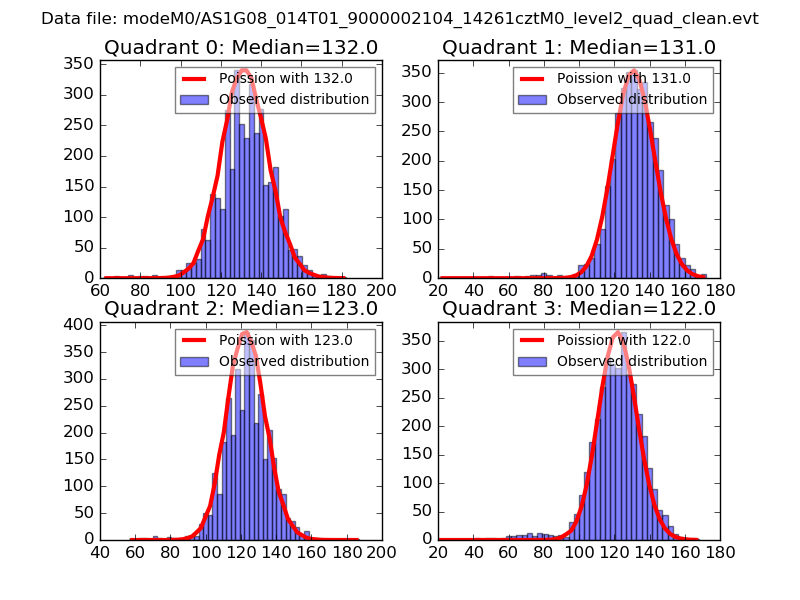 |
 |
| Quadrant-wise count rates Data is divided into 100 sec bins |
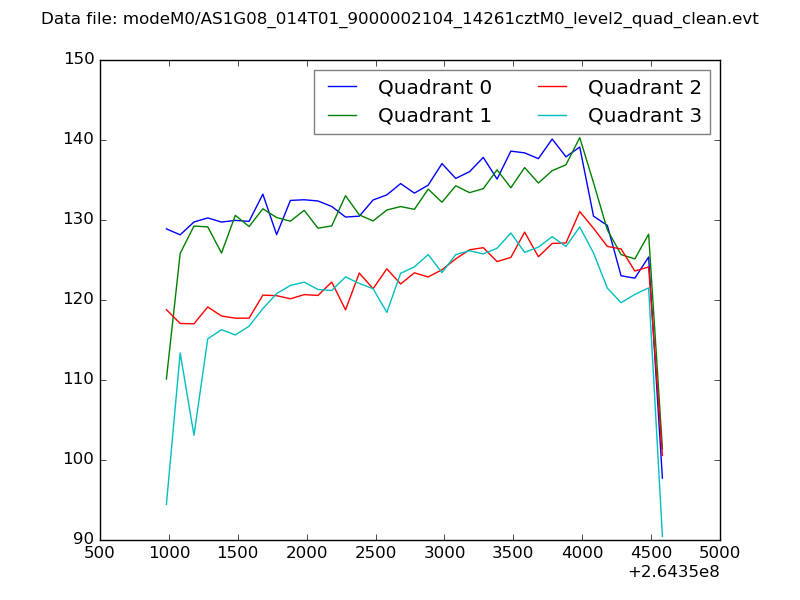 |
|
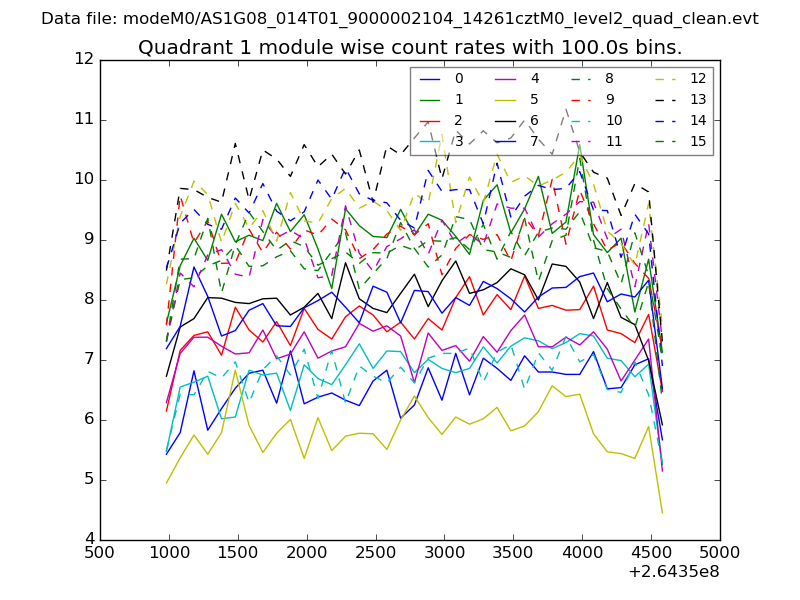
| Module-wise count rates for Quadrant A Data is divided into 100 sec bins |
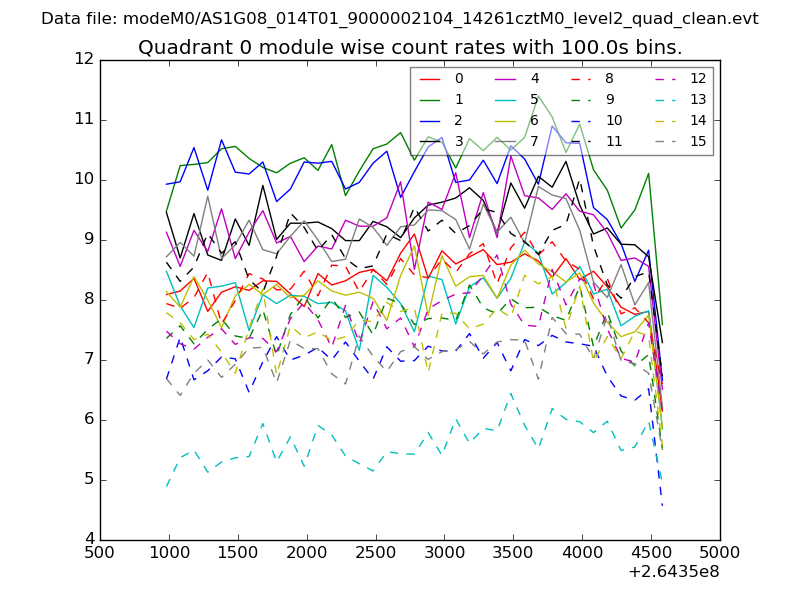 |
 |
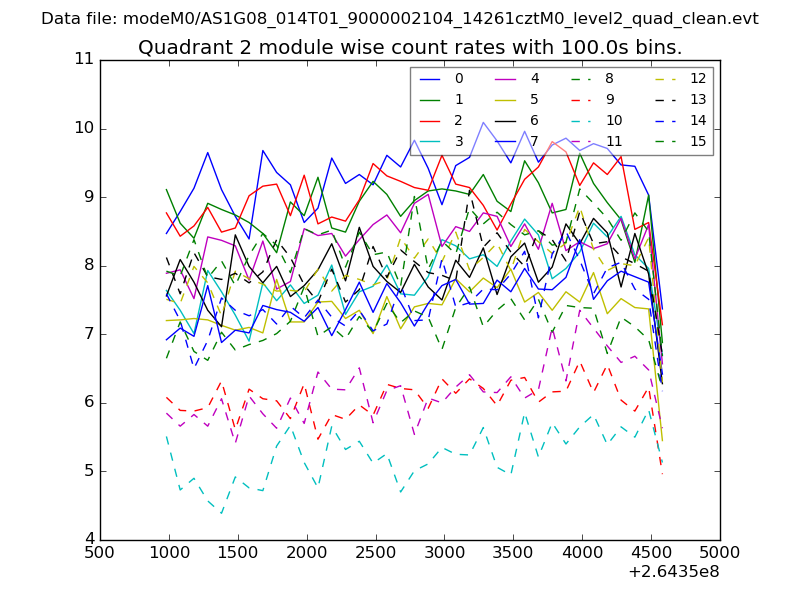
| Module-wise count rates for Quadrant B Data is divided into 100 sec bins |
 |
 |
| Module-wise count rates for Quadrant C Data is divided into 100 sec bins |
 |
 |
| Module-wise count rates for Quadrant D Data is divided into 100 sec bins |
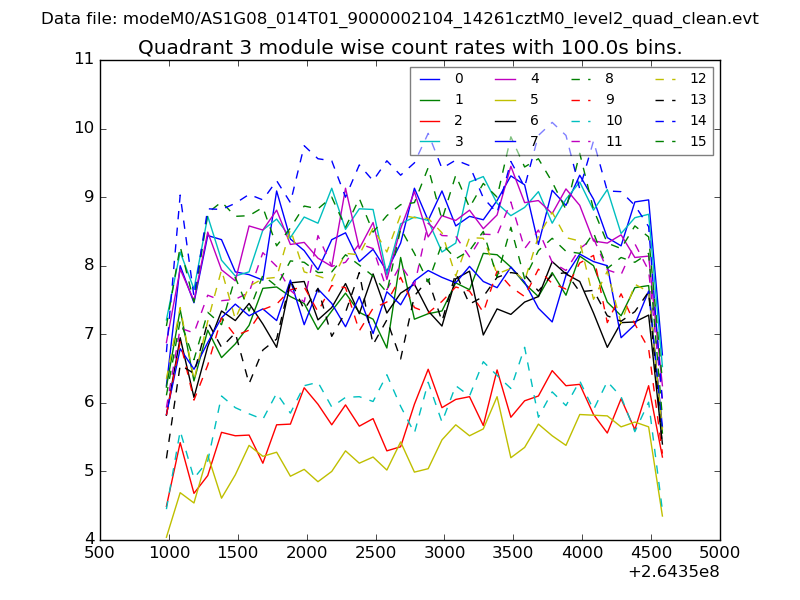 |
 |
| Parameter | Plot |
|---|---|
| CZT HV Monitor | 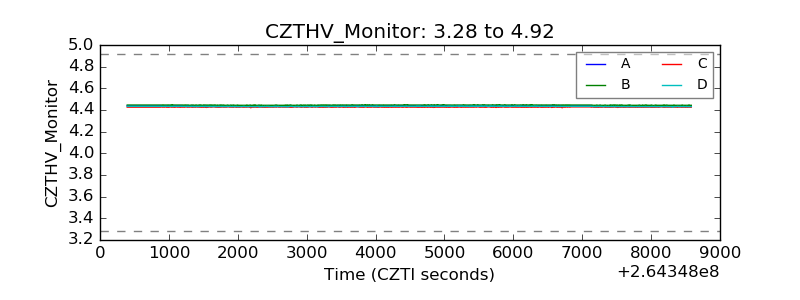 |
| D_VDD | 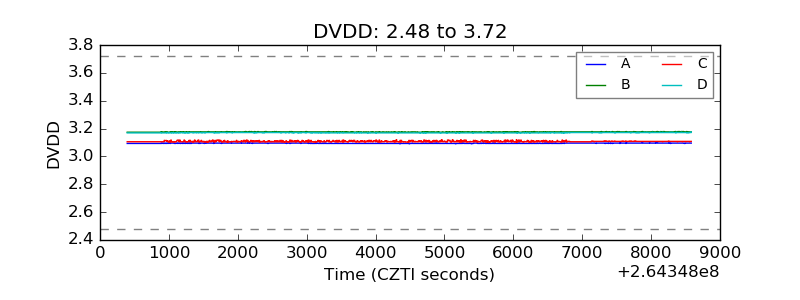 |
| Temperature 1 | 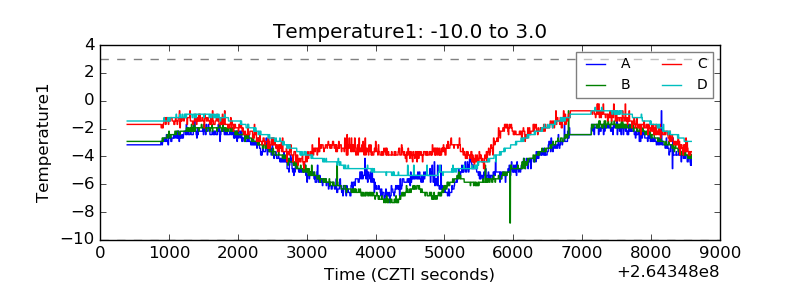 |
| Veto HV Monitor | 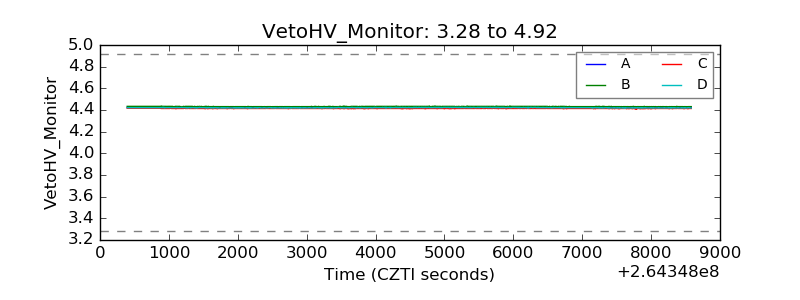 |
| Veto LLD | 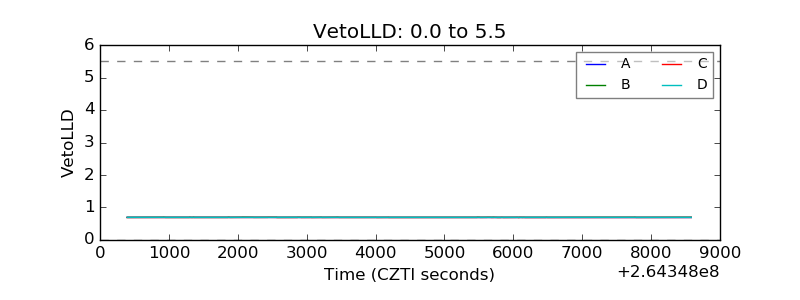 |
| Alpha Counter | 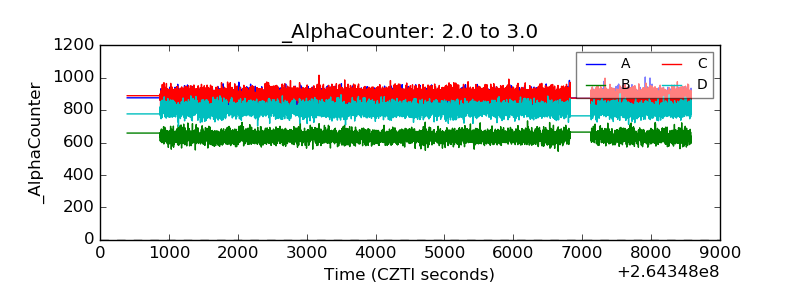 |
| _CPM_Rate | 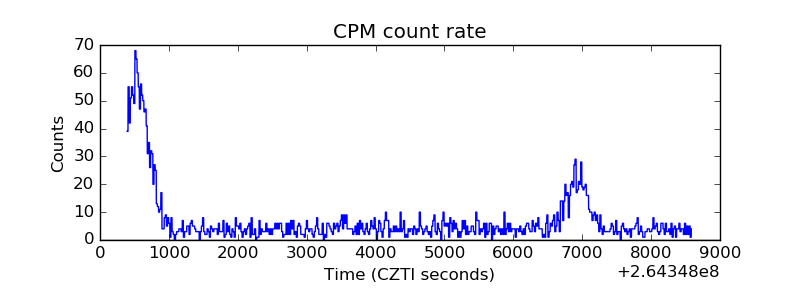 |
| CZT Counter | 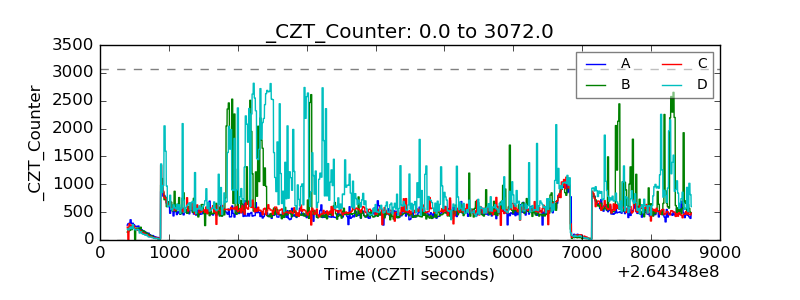 |
| +2.5 Volts monitor | 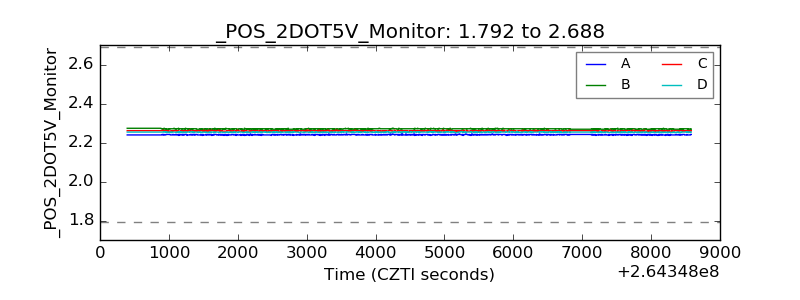 |
| +5 Volts monitor |  |
| _ROLL_ROT | 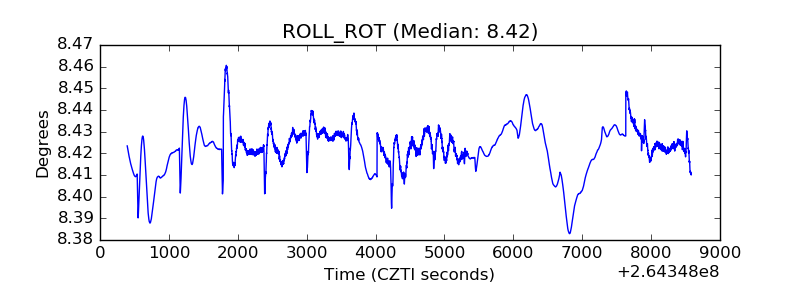 |
| _Roll_DEC | 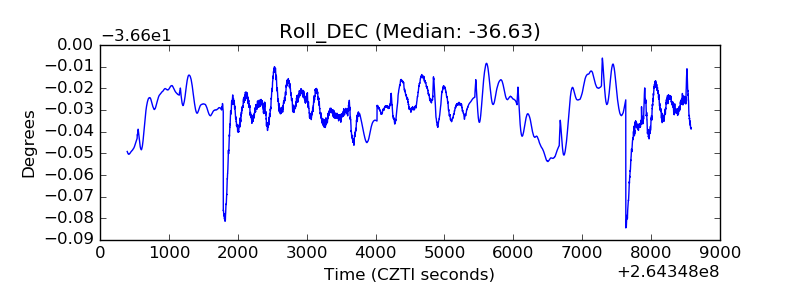 |
| _Roll_RA | 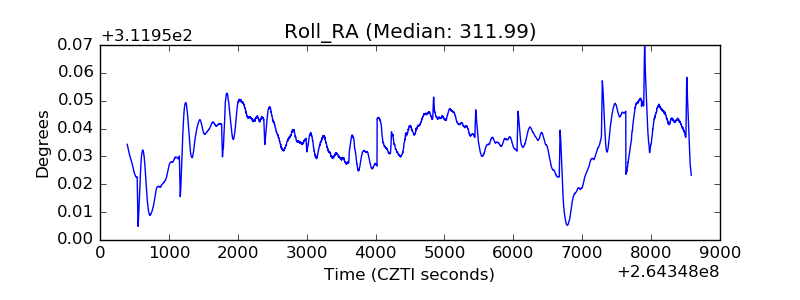 |
| Veto Counter |  |