| Param | Original file | Final file |
|---|---|---|
| Filename | modeM0/AS1G08_014T01_9000002104_14262cztM0_level2.evt | modeM0/AS1G08_014T01_9000002104_14262cztM0_level2_quad_clean.evt |
| Size (bytes) | 685,906,560 | 87,048,000 |
| Size | 654.1 MB | 83.0 MB |
| Events in quadrant A | 3,973,414 | 543,284 |
| Events in quadrant B | 4,853,991 | 537,354 |
| Events in quadrant C | 4,152,239 | 507,499 |
| Events in quadrant D | 7,255,675 | 495,665 |
| Mode M9 | |||
|---|---|---|---|
| Quadrant | BADHDUFLAG | Total packets | Discarded packets |
| A | 0 | 5 | 0 |
| B | 0 | 5 | 0 |
| C | 0 | 5 | 0 |
| D | 0 | 5 | 0 |
| Mode SS | |||
|---|---|---|---|
| Quadrant | BADHDUFLAG | Total packets | Discarded packets |
| A | 0 | 164 | 0 |
| B | 0 | 164 | 0 |
| C | 0 | 164 | 0 |
| D | 0 | 164 | 0 |
| Mode M0 | |||
|---|---|---|---|
| Quadrant | BADHDUFLAG | Total packets | Discarded packets |
| A | 0 | 16795 | 3 |
| B | 0 | 19569 | 2 |
| C | 0 | 17046 | 2 |
| D | 0 | 27085 | 2 |
| Quadrant | Total seconds | Saturated seconds | Saturation percentage |
|---|---|---|---|
| A | 7936 | 194 | 2.444556% |
| B | 7936 | 456 | 5.745968% |
| C | 7936 | 136 | 1.713710% |
| D | 7936 | 927 | 11.680948% |
Noise dominated data is calculated using 1-second bins in cleaned event files. If a bin has >2000 counts, and if more than 50% of those come from <1% of pixels, then it is considered to be noise-dominated and hence unusable.
| Quadrant | # 1 sec bins | Bins with >0 counts | Bins with >2000 counts | High rate bins dominated by noise | Noise dominated (total time) | Noise dominated (detector-on time) | Marked lightcurve |
|---|---|---|---|---|---|---|---|
| A | 8527 | 7939 | 0 | 0 | 0.00% | 0.00% | 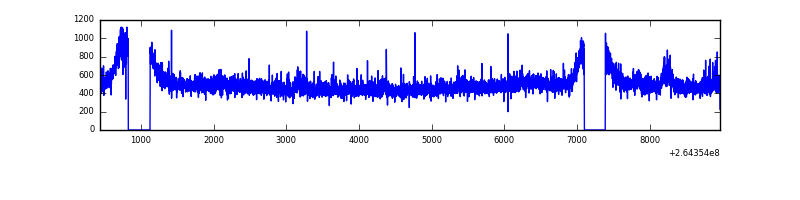 |
| B | 8527 | 7939 | 150 | 150 | 1.76% | 1.89% | 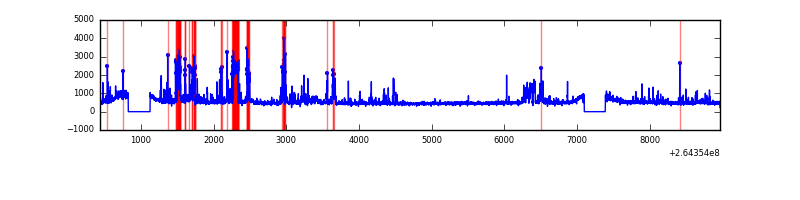 |
| C | 8527 | 7939 | 0 | 0 | 0.00% | 0.00% | 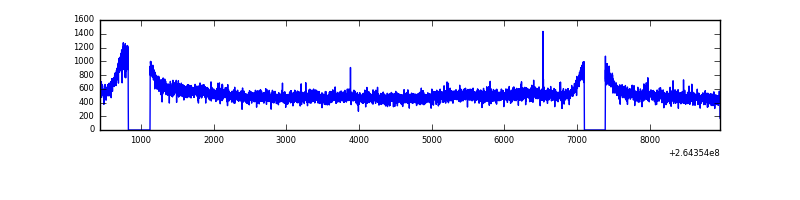 |
| D | 8527 | 7939 | 562 | 562 | 6.59% | 7.08% | 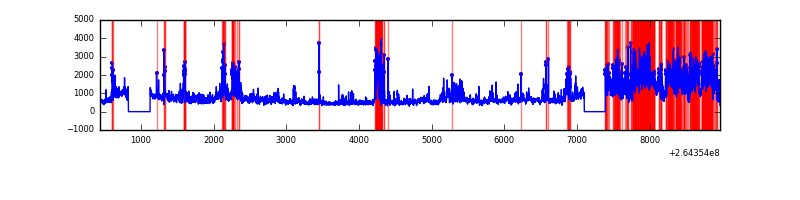 |
Top three noisy pixels from each quadrant. If the there are fewer than three noisy pixels in the level2.evt file, extra rows are filled as -1
| Pixel properties | Quadrant properties | ||||||
|---|---|---|---|---|---|---|---|
| Quadrant | DetID | PixID | Counts | Sigma | Mean | Median | Sigma |
| A | 8 | 15 | 71515 | 349.71 | 994 | 970 | 201.7 |
| A | 12 | 189 | 69001 | 337.25 | 994 | 970 | 201.7 |
| A | 0 | 226 | 8822 | 38.92 | 994 | 970 | 201.7 |
| B | 0 | 229 | 329715 | 1758.53 | 972 | 947 | 187.0 |
| B | 10 | 245 | 300789 | 1603.81 | 972 | 947 | 187.0 |
| B | 0 | 182 | 222296 | 1183.96 | 972 | 947 | 187.0 |
| C | 3 | 233 | 449747 | 2010.21 | 949 | 953 | 223.3 |
| C | 13 | 61 | 6873 | 26.52 | 949 | 953 | 223.3 |
| C | 10 | 22 | 4066 | 13.94 | 949 | 953 | 223.3 |
| D | 12 | 110 | 1022341 | 4619.25 | 929 | 909 | 221.1 |
| D | 13 | 122 | 1012621 | 4575.29 | 929 | 909 | 221.1 |
| D | 8 | 195 | 628701 | 2839.08 | 929 | 909 | 221.1 |
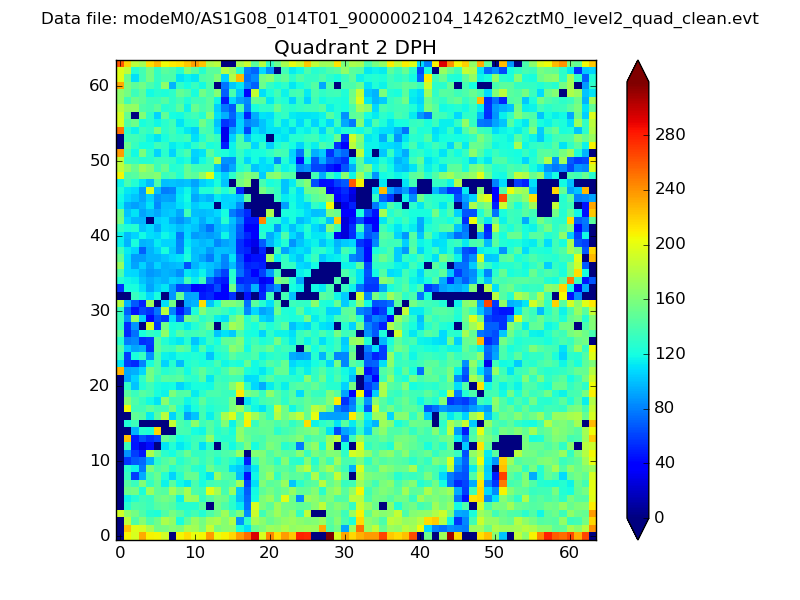
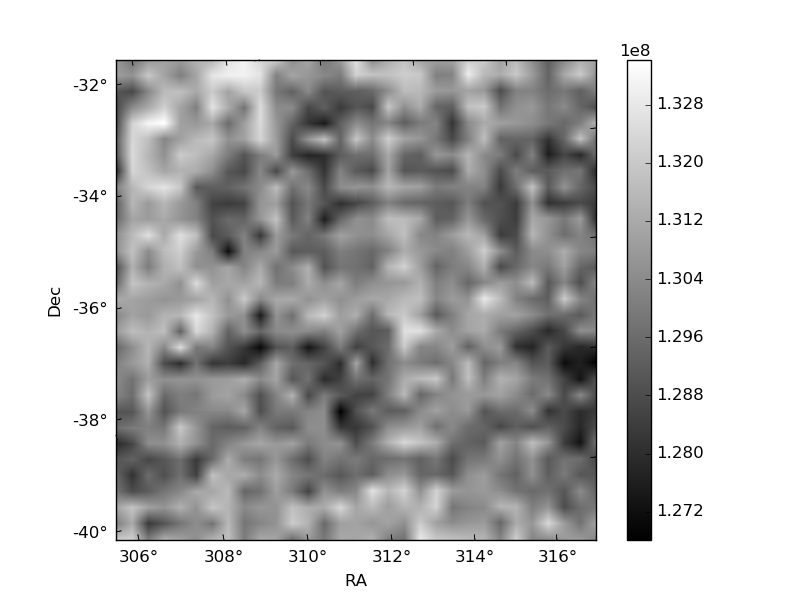
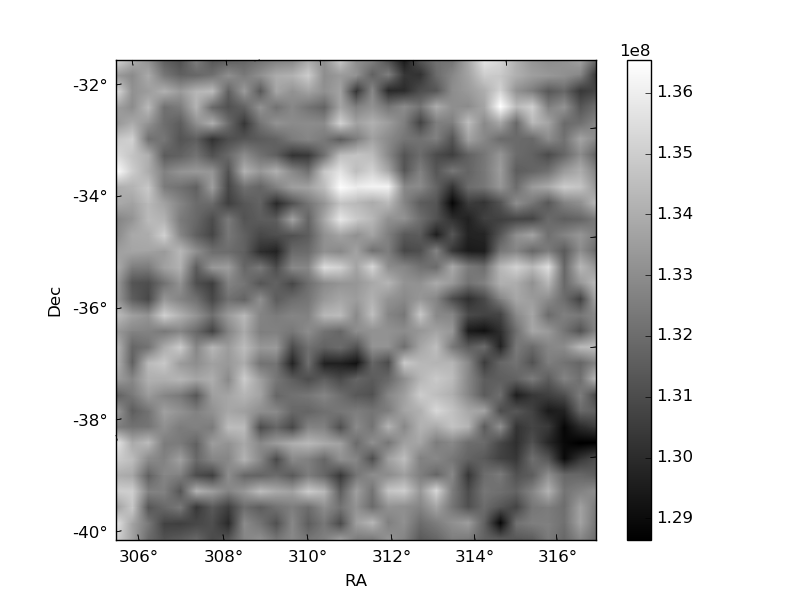
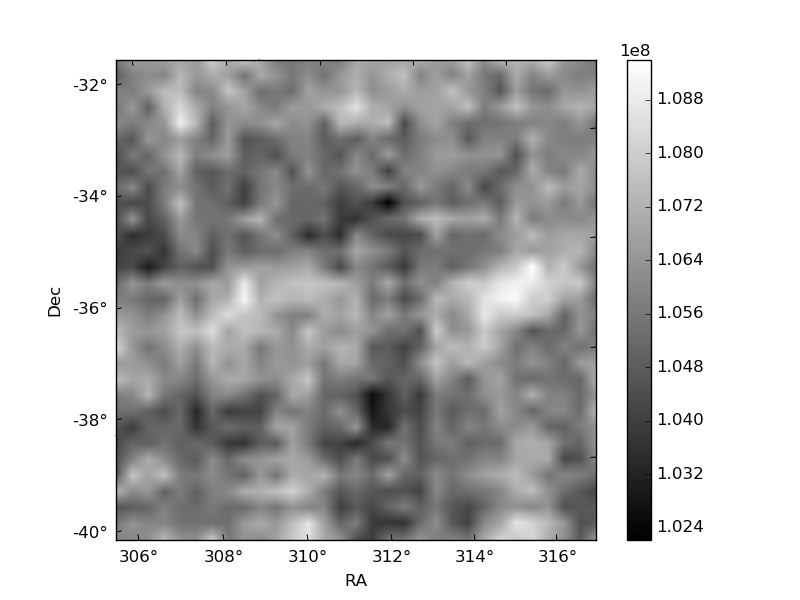
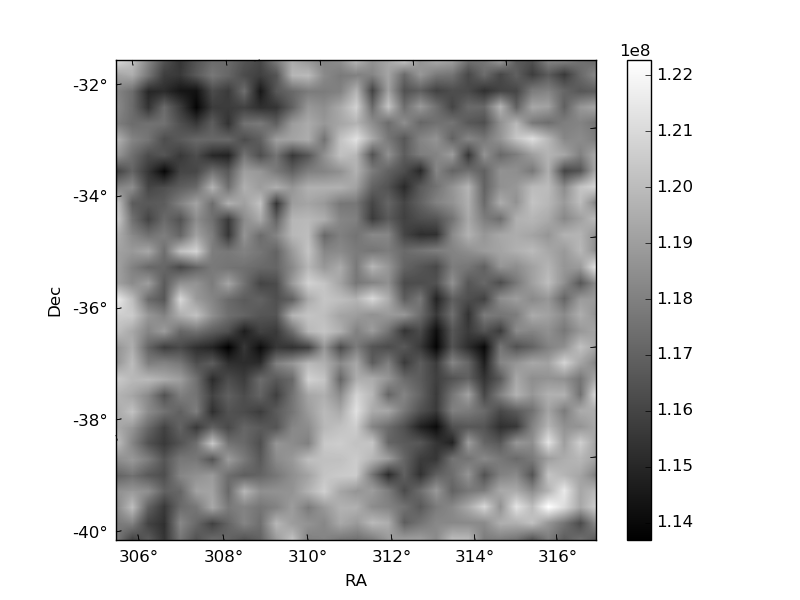
Histogram calculated using DETX and DETY for each event in the final _common_clean file
| Quadrant A | 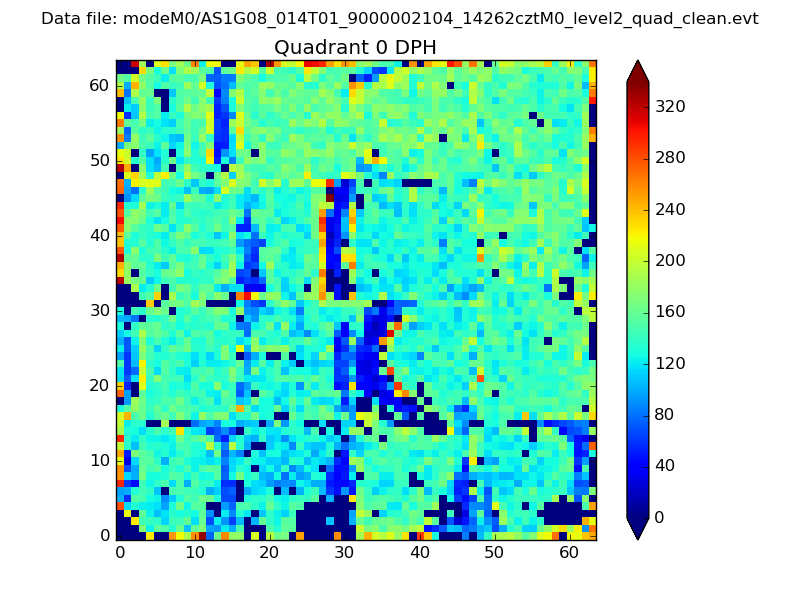 |
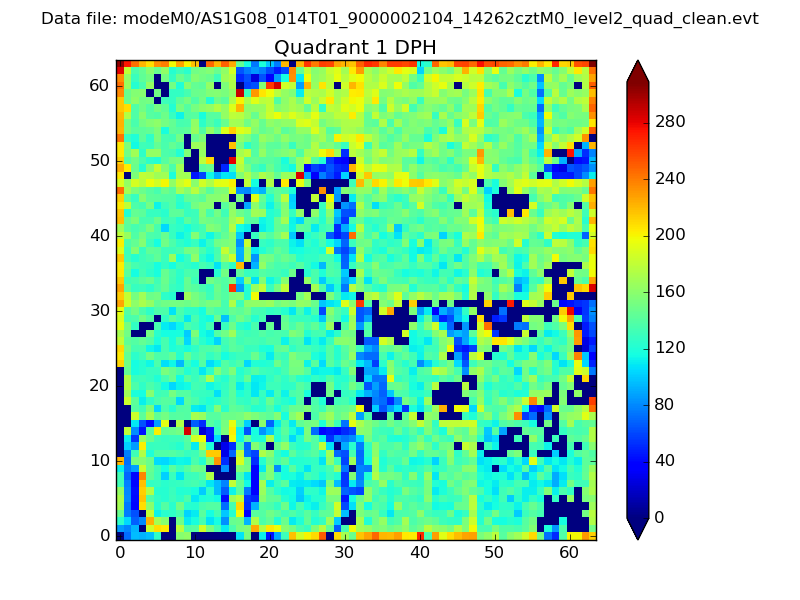 |
Quadrant B |
|---|---|---|---|
| Quadrant D | 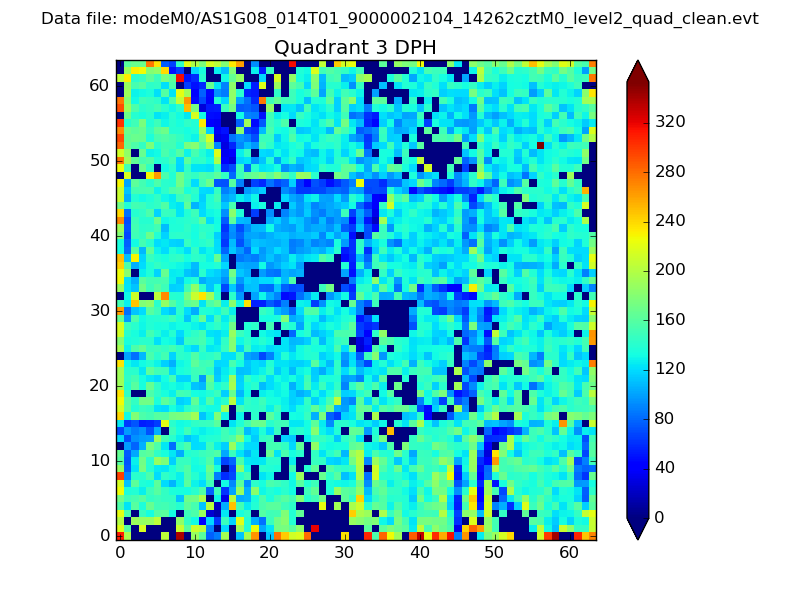 |
 |
Quadrant C |
| Plot type | Count rate plots | Images |
|---|---|---|
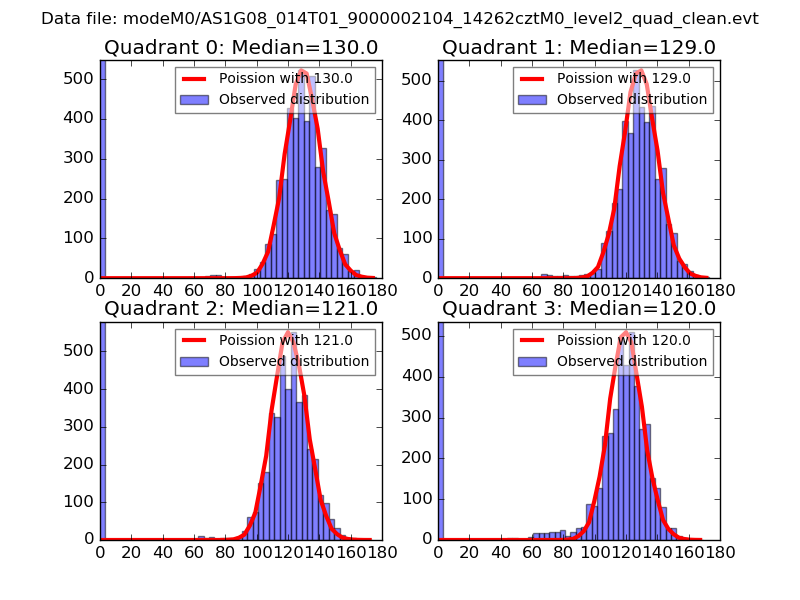
| Comparison with Poisson distribution Blue bars denote a histogram of data divided into 1 sec bins. Red curve is a Poisson curve with rate = median count rate of data. |
 |
 |
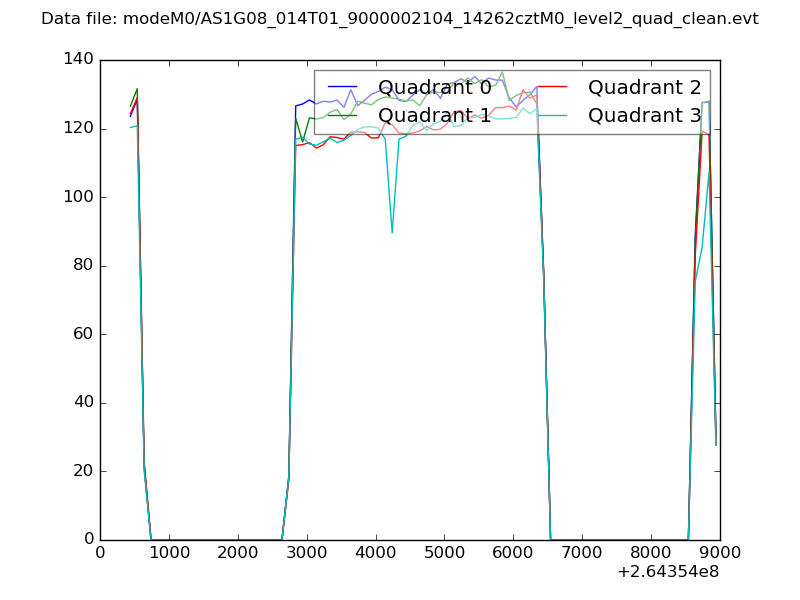
| Quadrant-wise count rates Data is divided into 100 sec bins |
 |
|
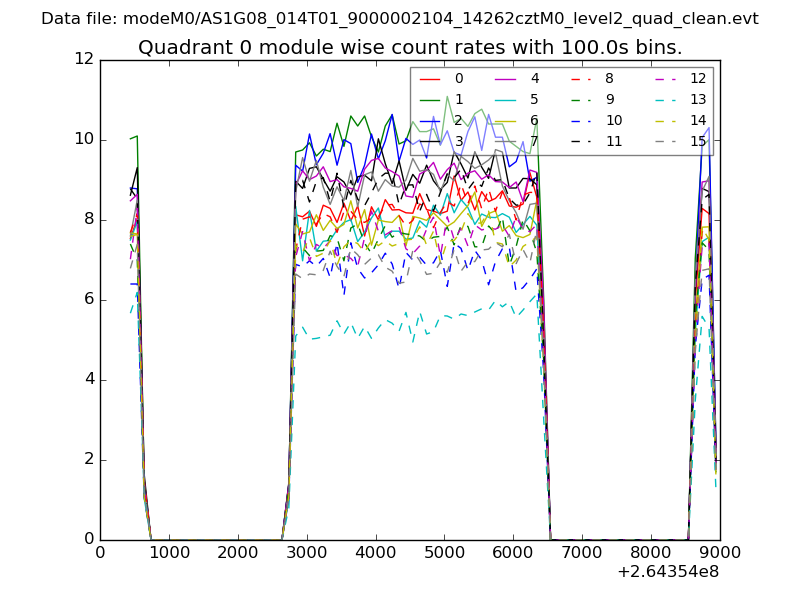
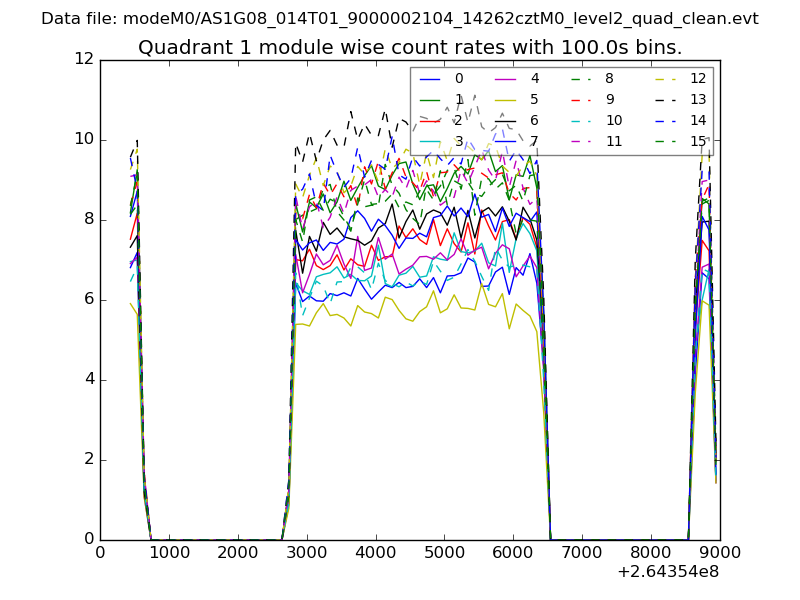
| Module-wise count rates for Quadrant A Data is divided into 100 sec bins |
 |
 |
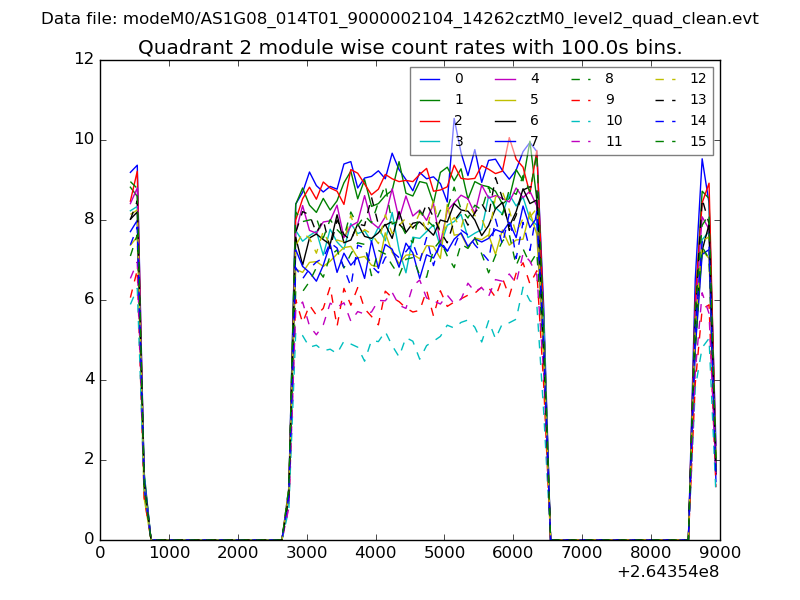
| Module-wise count rates for Quadrant B Data is divided into 100 sec bins |
 |
 |
| Module-wise count rates for Quadrant C Data is divided into 100 sec bins |
 |
 |
| Module-wise count rates for Quadrant D Data is divided into 100 sec bins |
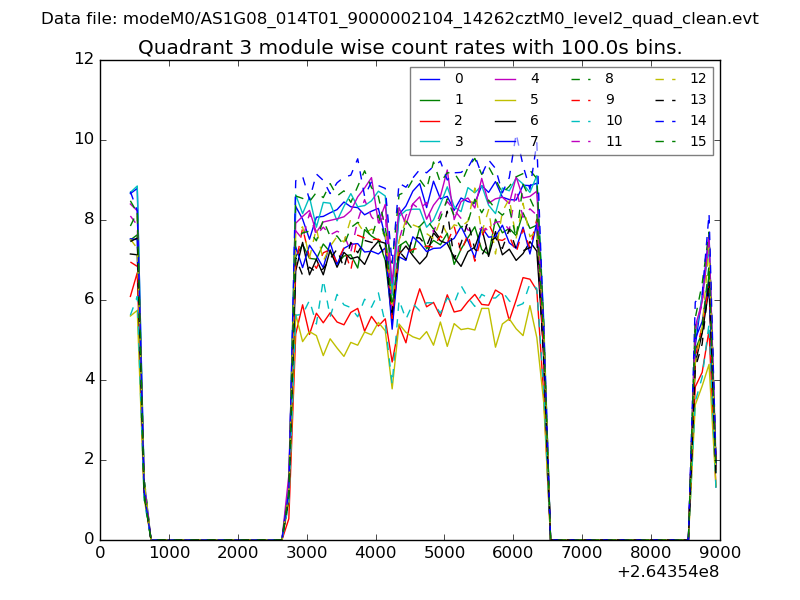 |
 |
| Parameter | Plot |
|---|---|
| CZT HV Monitor | 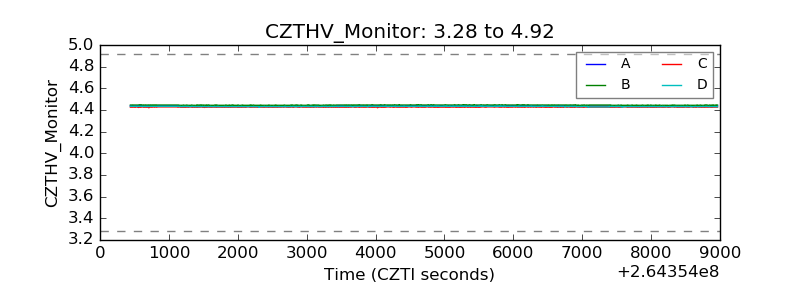 |
| D_VDD | 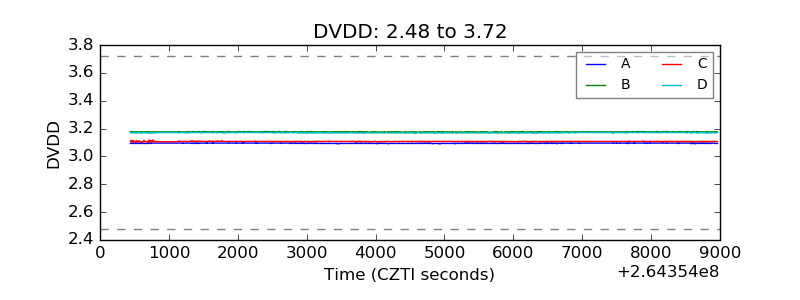 |
| Temperature 1 | 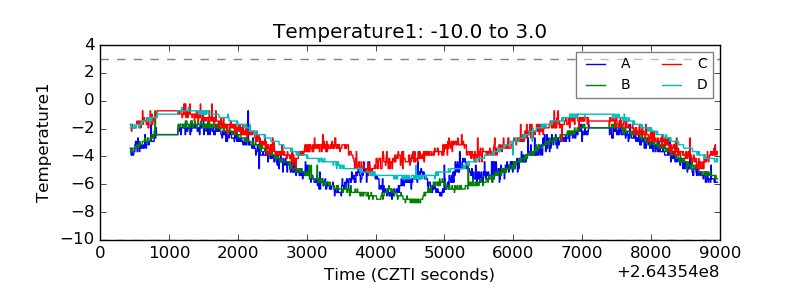 |
| Veto HV Monitor | 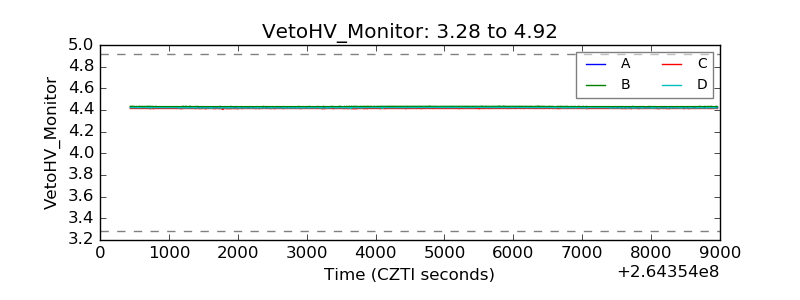 |
| Veto LLD | 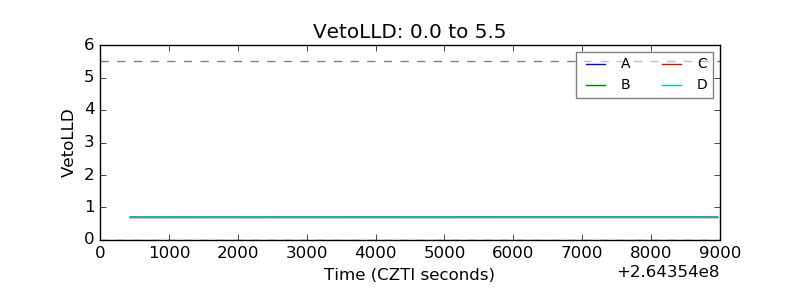 |
| Alpha Counter | 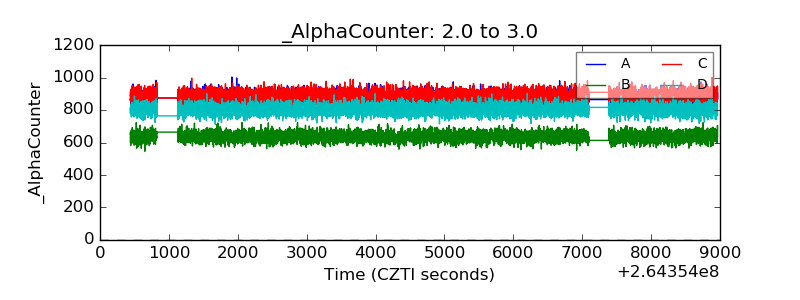 |
| _CPM_Rate | 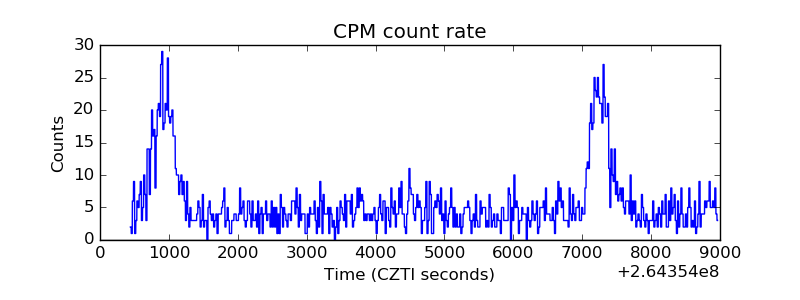 |
| CZT Counter | 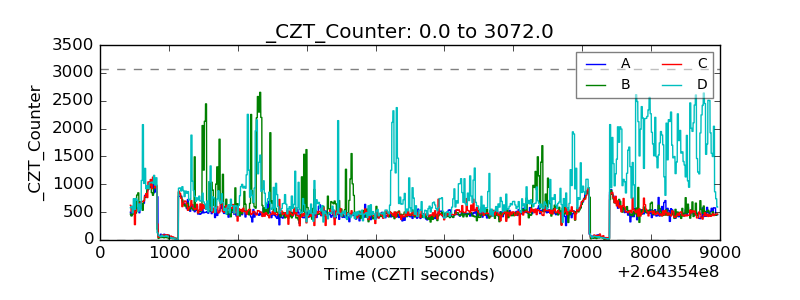 |
| +2.5 Volts monitor |  |
| +5 Volts monitor | 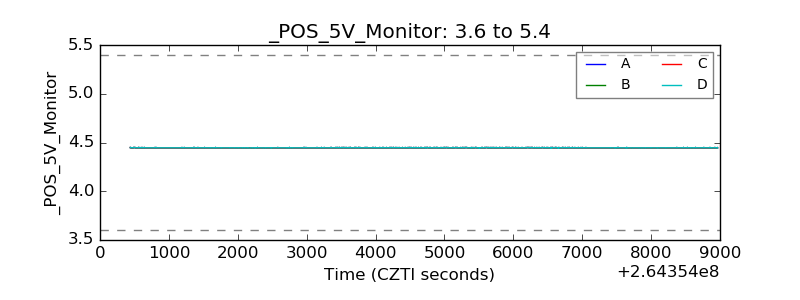 |
| _ROLL_ROT | 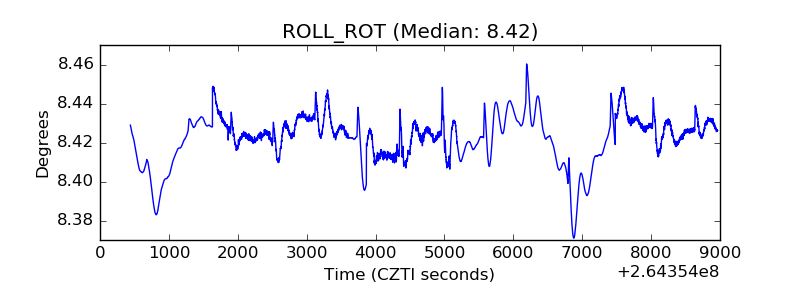 |
| _Roll_DEC | 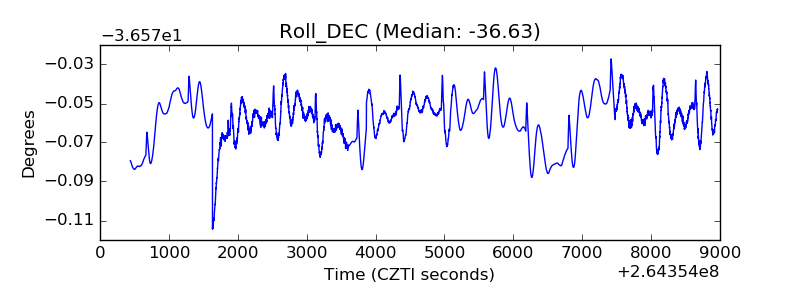 |
| _Roll_RA | 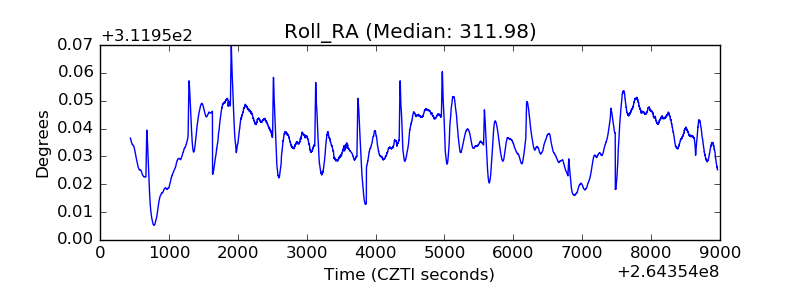 |
| Veto Counter | 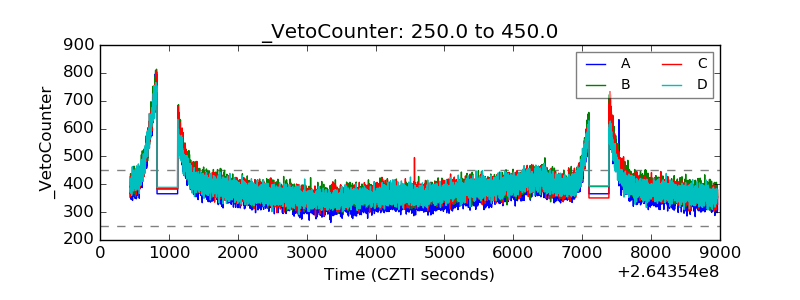 |