| Param | Original file | Final file |
|---|---|---|
| Filename | modeM0/AS1G08_014T01_9000002104_14265cztM0_level2.evt | modeM0/AS1G08_014T01_9000002104_14265cztM0_level2_quad_clean.evt |
| Size (bytes) | 725,725,440 | 72,792,000 |
| Size | 692.1 MB | 69.4 MB |
| Events in quadrant A | 3,446,767 | 467,779 |
| Events in quadrant B | 3,577,637 | 466,345 |
| Events in quadrant C | 3,432,819 | 440,292 |
| Events in quadrant D | 11,057,530 | 351,019 |
| Mode M9 | |||
|---|---|---|---|
| Quadrant | BADHDUFLAG | Total packets | Discarded packets |
| A | 0 | 7 | 0 |
| B | 0 | 7 | 0 |
| C | 0 | 7 | 0 |
| D | 0 | 7 | 0 |
| Mode SS | |||
|---|---|---|---|
| Quadrant | BADHDUFLAG | Total packets | Discarded packets |
| A | 0 | 142 | 0 |
| B | 0 | 142 | 0 |
| C | 0 | 142 | 0 |
| D | 0 | 142 | 0 |
| Mode M0 | |||
|---|---|---|---|
| Quadrant | BADHDUFLAG | Total packets | Discarded packets |
| A | 0 | 14546 | 3 |
| B | 0 | 14986 | 2 |
| C | 0 | 14422 | 2 |
| D | 0 | 37639 | 2 |
| Quadrant | Total seconds | Saturated seconds | Saturation percentage |
|---|---|---|---|
| A | 6853 | 110 | 1.605136% |
| B | 6853 | 169 | 2.466073% |
| C | 6853 | 63 | 0.919305% |
| D | 6853 | 2797 | 40.814242% |
Noise dominated data is calculated using 1-second bins in cleaned event files. If a bin has >2000 counts, and if more than 50% of those come from <1% of pixels, then it is considered to be noise-dominated and hence unusable.
| Quadrant | # 1 sec bins | Bins with >0 counts | Bins with >2000 counts | High rate bins dominated by noise | Noise dominated (total time) | Noise dominated (detector-on time) | Marked lightcurve |
|---|---|---|---|---|---|---|---|
| A | 7594 | 6856 | 2 | 2 | 0.03% | 0.03% | 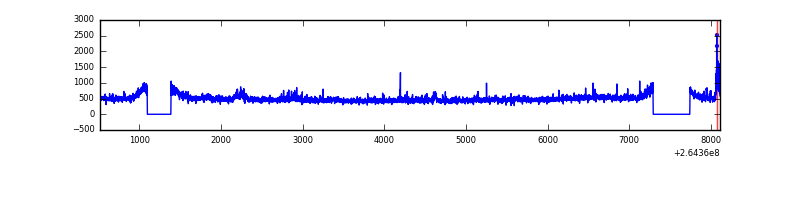 |
| B | 7594 | 6856 | 8 | 8 | 0.11% | 0.12% | 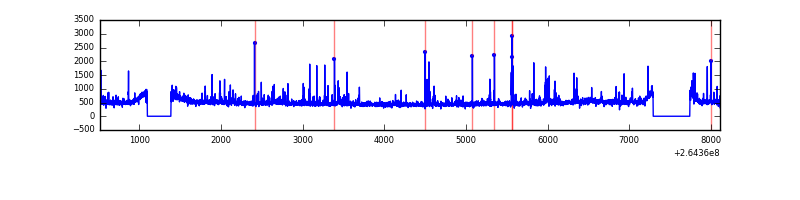 |
| C | 7594 | 6856 | 0 | 0 | 0.00% | 0.00% | 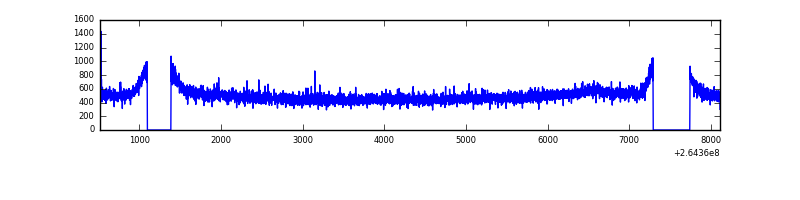 |
| D | 7594 | 6856 | 2062 | 2062 | 27.15% | 30.08% | 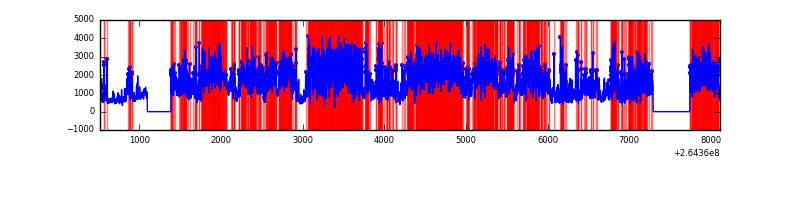 |
Top three noisy pixels from each quadrant. If the there are fewer than three noisy pixels in the level2.evt file, extra rows are filled as -1
| Pixel properties | Quadrant properties | ||||||
|---|---|---|---|---|---|---|---|
| Quadrant | DetID | PixID | Counts | Sigma | Mean | Median | Sigma |
| A | 12 | 189 | 88869 | 515.72 | 844 | 825 | 170.7 |
| A | 8 | 15 | 64207 | 371.26 | 844 | 825 | 170.7 |
| A | 11 | 29 | 39681 | 227.6 | 844 | 825 | 170.7 |
| B | 0 | 229 | 126489 | 784.13 | 836 | 814 | 160.3 |
| B | 10 | 245 | 75655 | 466.96 | 836 | 814 | 160.3 |
| B | 0 | 189 | 26058 | 157.51 | 836 | 814 | 160.3 |
| C | 3 | 233 | 279591 | 1480.01 | 807 | 808 | 188.4 |
| C | 13 | 61 | 5929 | 27.19 | 807 | 808 | 188.4 |
| C | 10 | 22 | 3872 | 16.27 | 807 | 808 | 188.4 |
| D | 13 | 122 | 6359300 | 36875.81 | 709 | 692 | 172.4 |
| D | 12 | 110 | 996681 | 5776.09 | 709 | 692 | 172.4 |
| D | 5 | 222 | 433557 | 2510.34 | 709 | 692 | 172.4 |
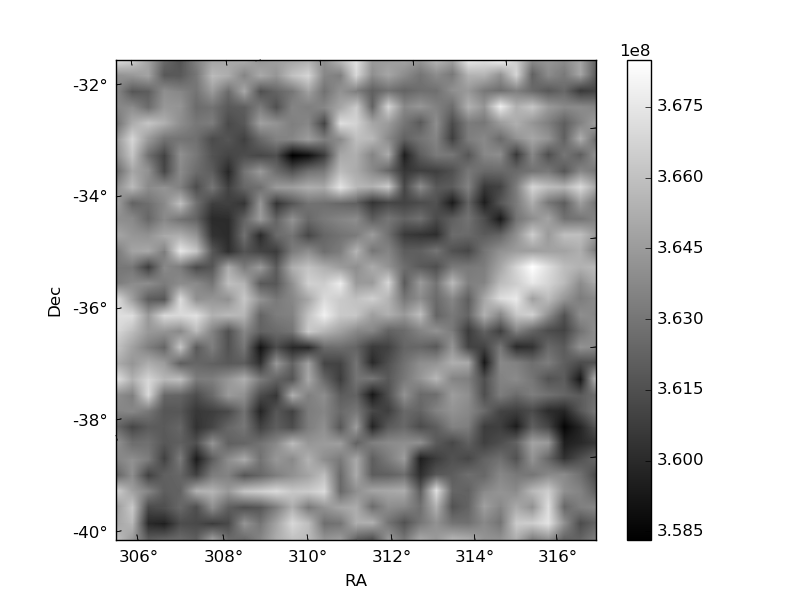
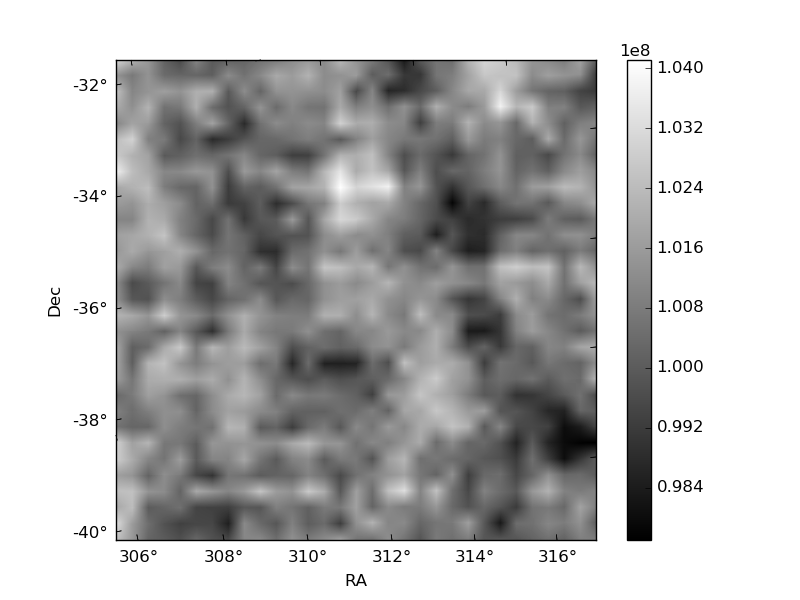
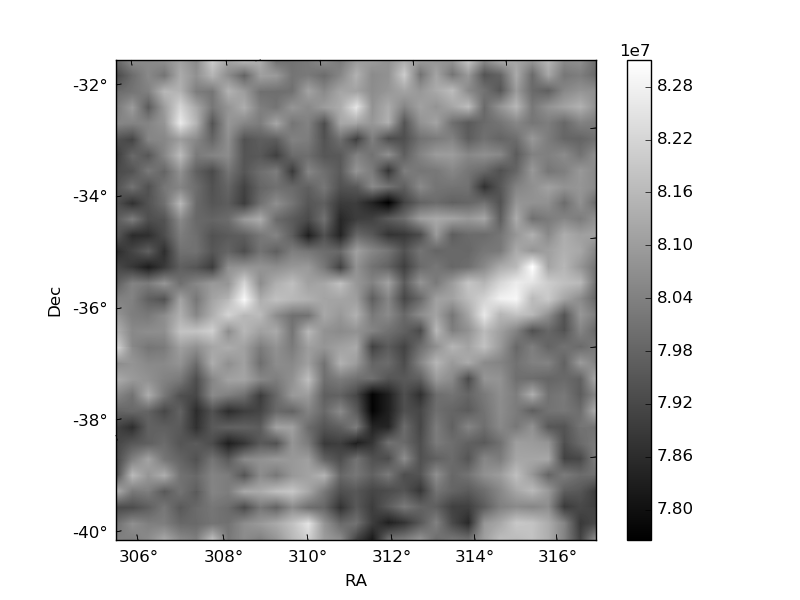
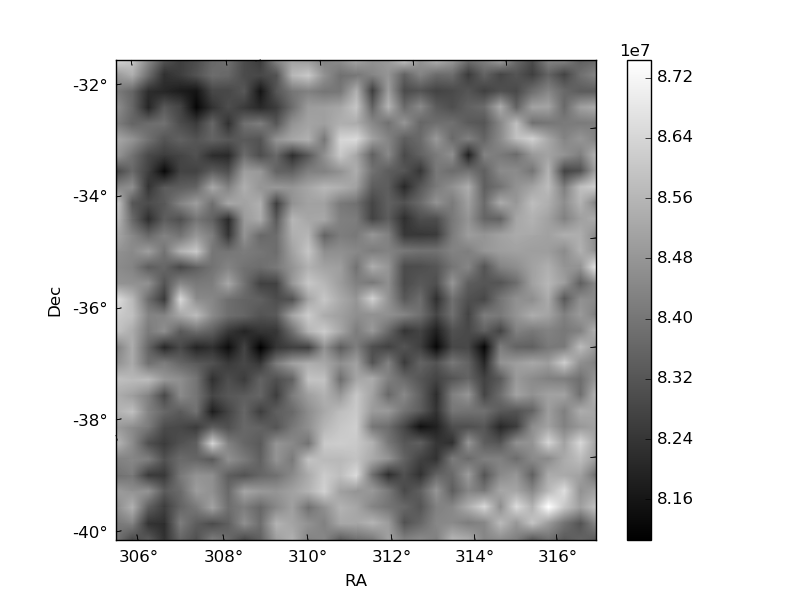
Histogram calculated using DETX and DETY for each event in the final _common_clean file
| Quadrant A | 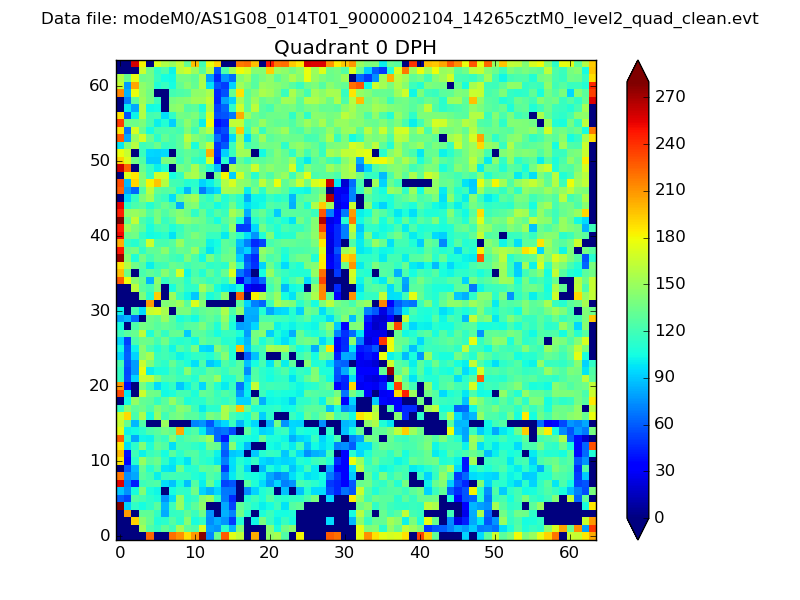 |
 |
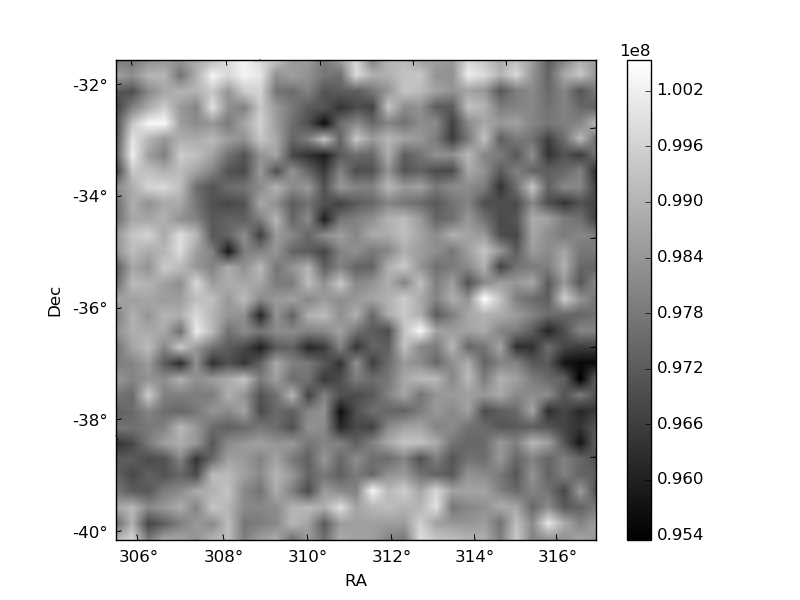
Quadrant B |
|---|---|---|---|
| Quadrant D | 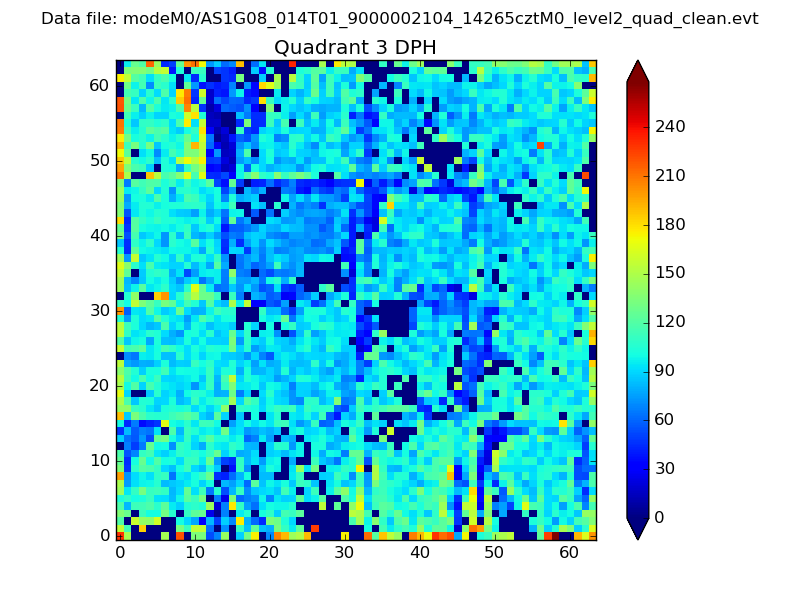 |
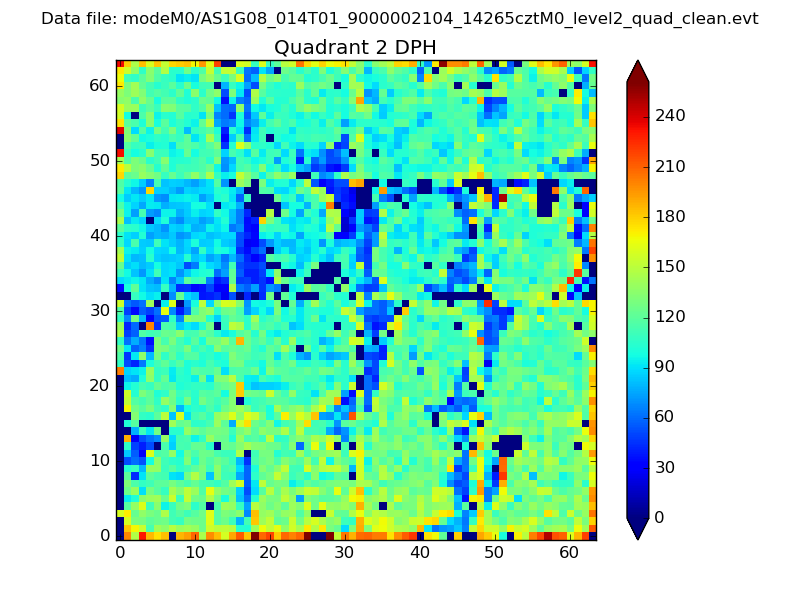 |
Quadrant C |
| Plot type | Count rate plots | Images |
|---|---|---|
| Comparison with Poisson distribution Blue bars denote a histogram of data divided into 1 sec bins. Red curve is a Poisson curve with rate = median count rate of data. |
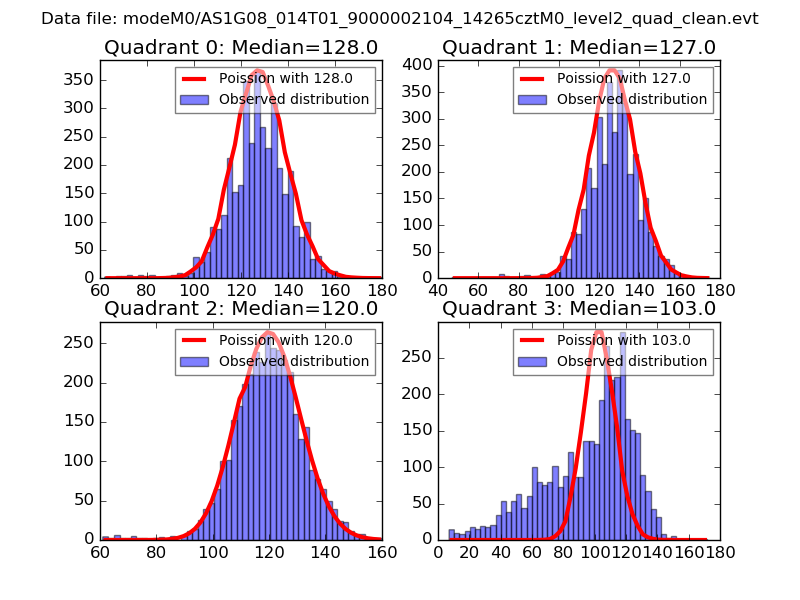 |
 |
| Quadrant-wise count rates Data is divided into 100 sec bins |
 |
|
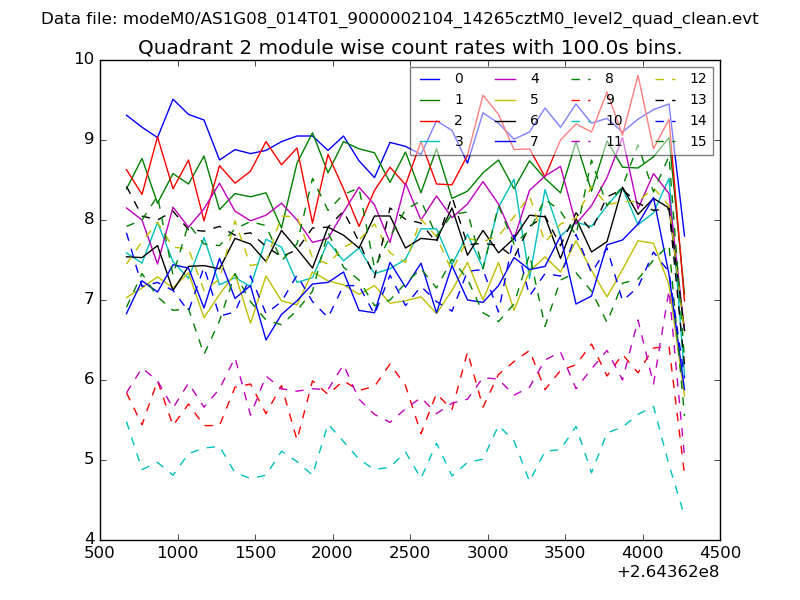
| Module-wise count rates for Quadrant A Data is divided into 100 sec bins |
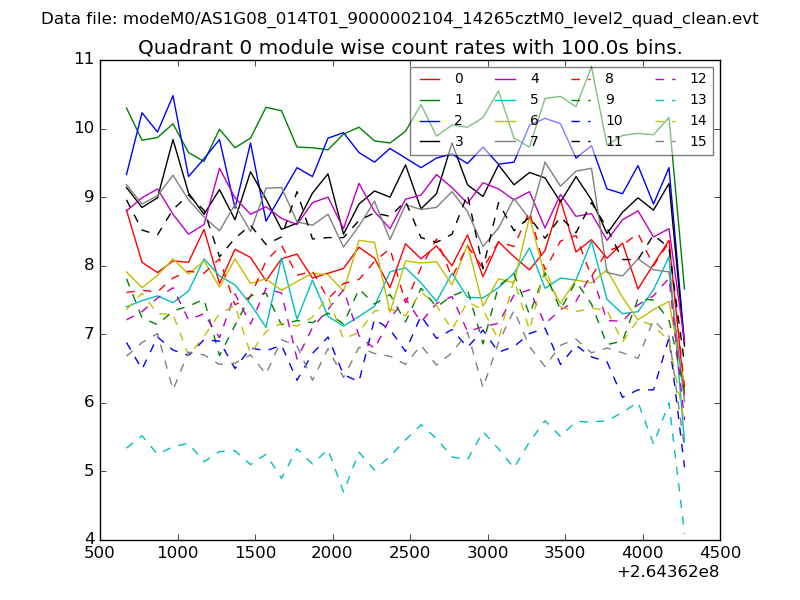 |
 |
| Module-wise count rates for Quadrant B Data is divided into 100 sec bins |
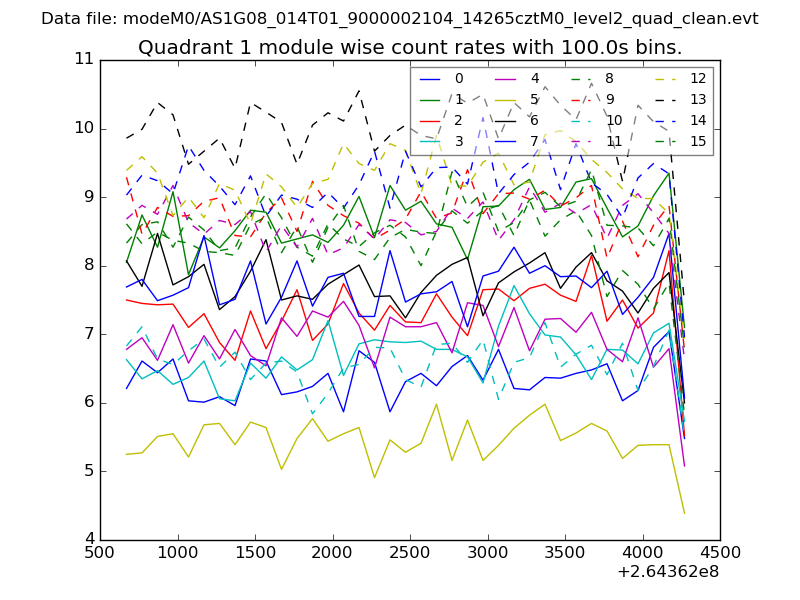 |
 |
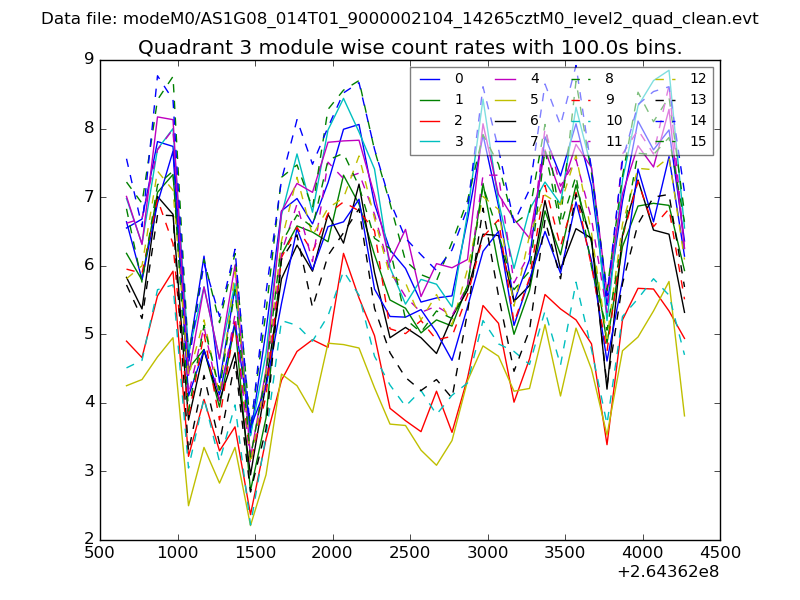
| Module-wise count rates for Quadrant C Data is divided into 100 sec bins |
 |
 |
| Module-wise count rates for Quadrant D Data is divided into 100 sec bins |
 |
 |
| Parameter | Plot |
|---|---|
| CZT HV Monitor | 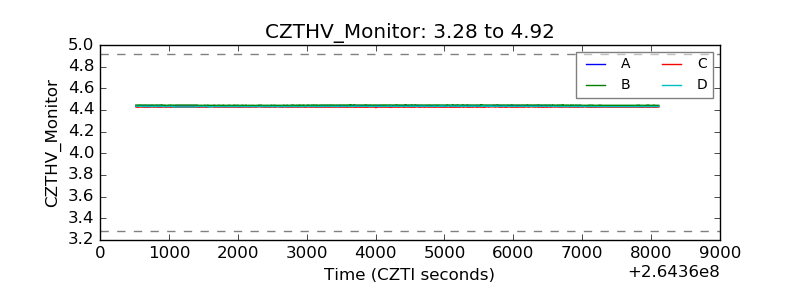 |
| D_VDD | 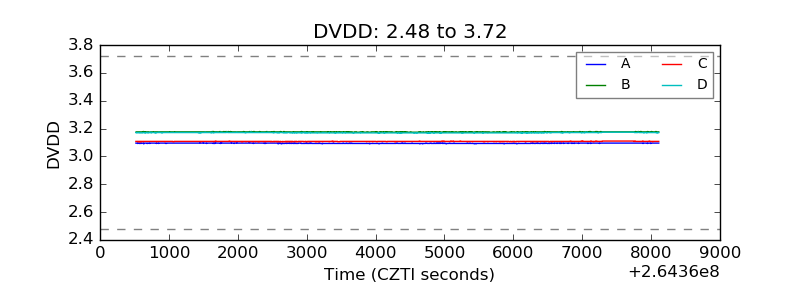 |
| Temperature 1 | 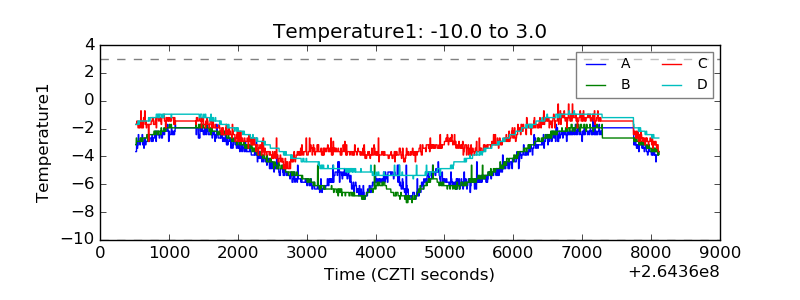 |
| Veto HV Monitor | 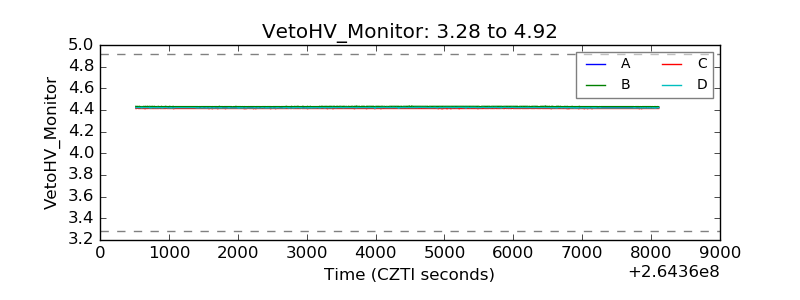 |
| Veto LLD | 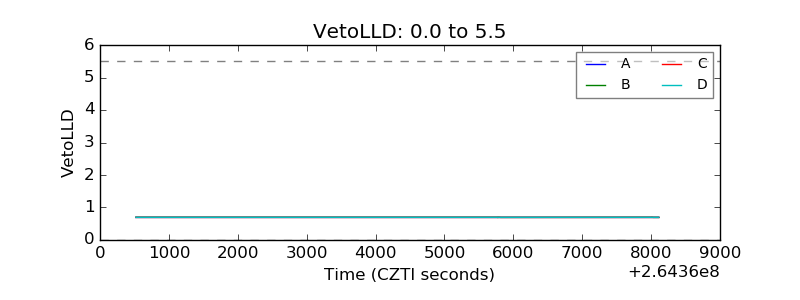 |
| Alpha Counter | 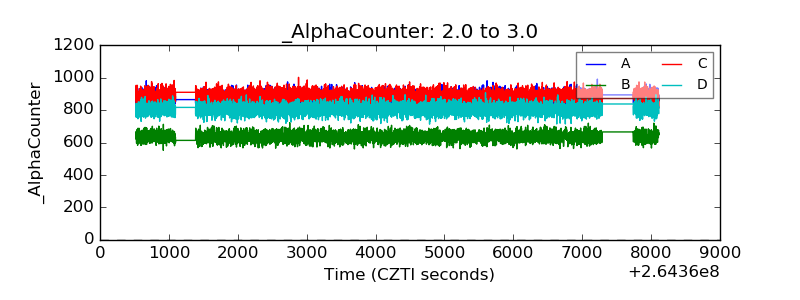 |
| _CPM_Rate | 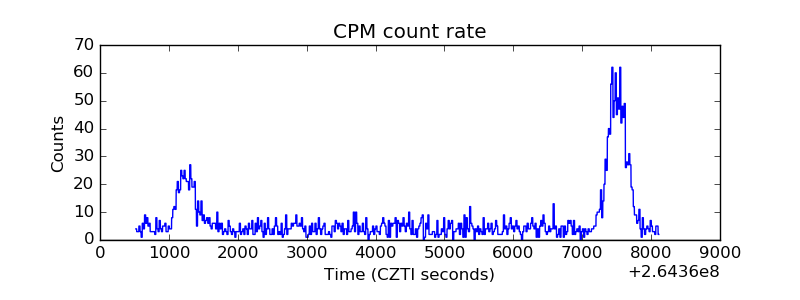 |
| CZT Counter | 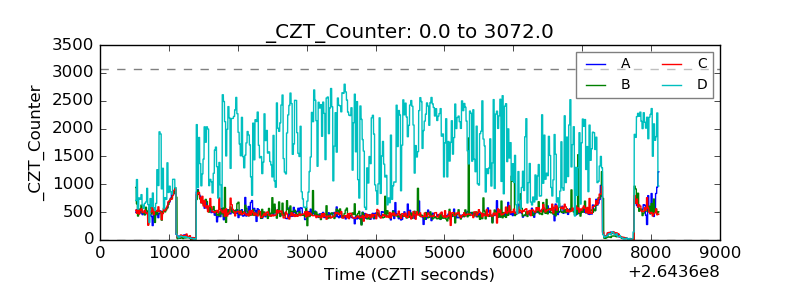 |
| +2.5 Volts monitor |  |
| +5 Volts monitor |  |
| _ROLL_ROT | 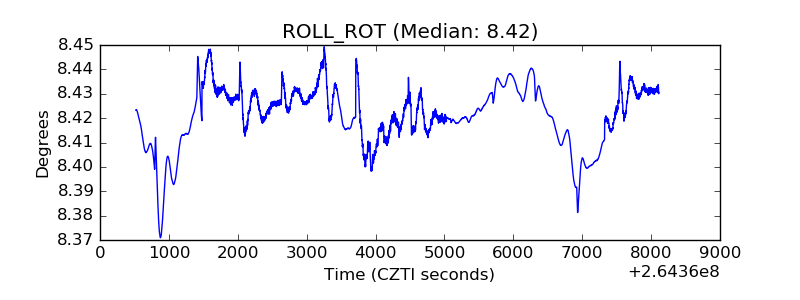 |
| _Roll_DEC | 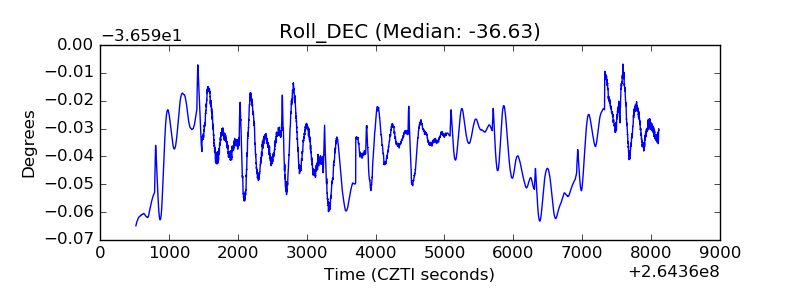 |
| _Roll_RA | 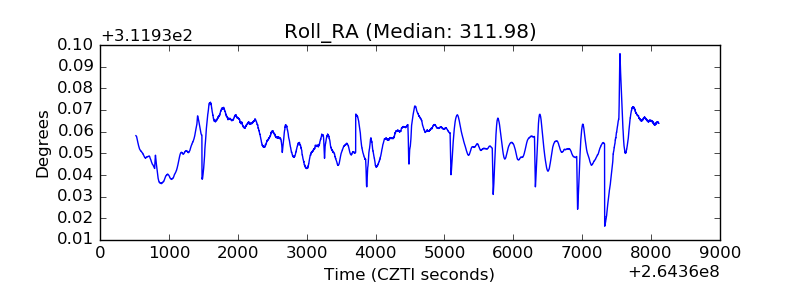 |
| Veto Counter | 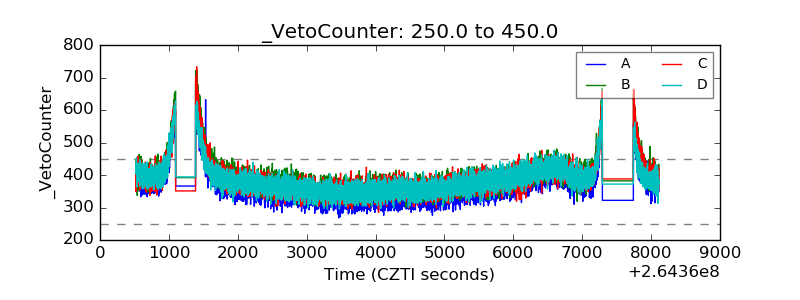 |