| Param | Original file | Final file |
|---|---|---|
| Filename | modeM0/AS1G08_014T01_9000002104_14266cztM0_level2.evt | modeM0/AS1G08_014T01_9000002104_14266cztM0_level2_quad_clean.evt |
| Size (bytes) | 1,187,233,920 | 214,188,480 |
| Size | 1.1 GB | 204.3 MB |
| Events in quadrant A | 8,071,479 | 1,396,400 |
| Events in quadrant B | 8,341,541 | 1,396,765 |
| Events in quadrant C | 8,158,064 | 1,315,701 |
| Events in quadrant D | 10,318,581 | 1,289,824 |
| Mode M9 | |||
|---|---|---|---|
| Quadrant | BADHDUFLAG | Total packets | Discarded packets |
| A | 0 | 23 | 0 |
| B | 0 | 23 | 0 |
| C | 0 | 23 | 0 |
| D | 0 | 24 | 1 |
| Mode SS | |||
|---|---|---|---|
| Quadrant | BADHDUFLAG | Total packets | Discarded packets |
| A | 0 | 326 | 2 |
| B | 0 | 326 | 2 |
| C | 0 | 326 | 2 |
| D | 0 | 326 | 2 |
| Mode M0 | |||
|---|---|---|---|
| Quadrant | BADHDUFLAG | Total packets | Discarded packets |
| A | 0 | 34525 | 124 |
| B | 0 | 35183 | 131 |
| C | 0 | 33820 | 120 |
| D | 0 | 41144 | 189 |
| Quadrant | Total seconds | Saturated seconds | Saturation percentage |
|---|---|---|---|
| A | 15776 | 77 | 0.488083% |
| B | 15769 | 258 | 1.636122% |
| C | 15774 | 57 | 0.361354% |
| D | 15770 | 410 | 2.599873% |
Noise dominated data is calculated using 1-second bins in cleaned event files. If a bin has >2000 counts, and if more than 50% of those come from <1% of pixels, then it is considered to be noise-dominated and hence unusable.
| Quadrant | # 1 sec bins | Bins with >0 counts | Bins with >2000 counts | High rate bins dominated by noise | Noise dominated (total time) | Noise dominated (detector-on time) | Marked lightcurve |
|---|---|---|---|---|---|---|---|
| A | 18326 | 15789 | 4 | 4 | 0.02% | 0.03% | 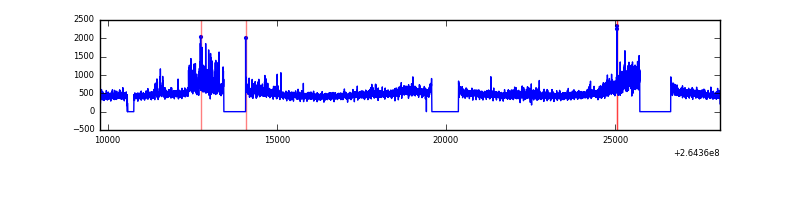 |
| B | 18324 | 15784 | 68 | 68 | 0.37% | 0.43% | 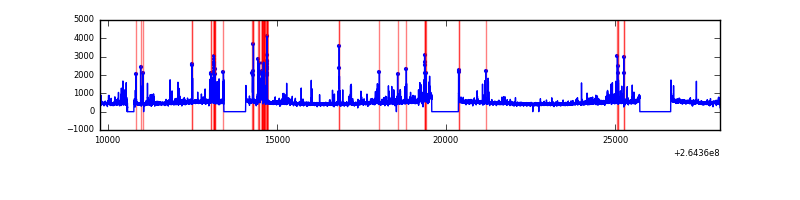 |
| C | 18327 | 15791 | 1 | 1 | 0.01% | 0.01% | 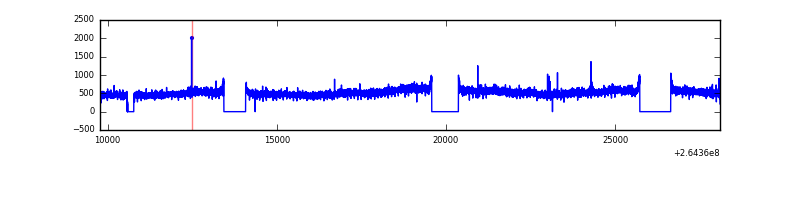 |
| D | 18323 | 15786 | 320 | 320 | 1.75% | 2.03% | 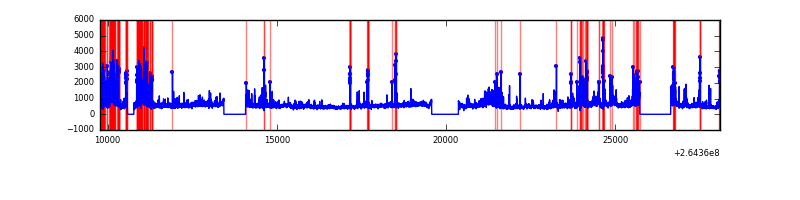 |
Top three noisy pixels from each quadrant. If the there are fewer than three noisy pixels in the level2.evt file, extra rows are filled as -1
| Pixel properties | Quadrant properties | ||||||
|---|---|---|---|---|---|---|---|
| Quadrant | DetID | PixID | Counts | Sigma | Mean | Median | Sigma |
| A | 8 | 15 | 357280 | 937.33 | 1890 | 1848 | 379.2 |
| A | 12 | 189 | 234032 | 612.3 | 1890 | 1848 | 379.2 |
| A | 11 | 29 | 177698 | 463.74 | 1890 | 1848 | 379.2 |
| B | 0 | 229 | 568812 | 1597.83 | 1880 | 1836 | 354.8 |
| B | 0 | 182 | 127358 | 353.74 | 1880 | 1836 | 354.8 |
| B | 10 | 245 | 107923 | 298.97 | 1880 | 1836 | 354.8 |
| C | 3 | 233 | 1018785 | 2395.74 | 1828 | 1838 | 424.5 |
| C | 13 | 61 | 12977 | 26.24 | 1828 | 1838 | 424.5 |
| C | 10 | 22 | 10492 | 20.39 | 1828 | 1838 | 424.5 |
| D | 13 | 122 | 1219725 | 2852.57 | 1817 | 1776 | 427.0 |
| D | 8 | 195 | 933447 | 2182.08 | 1817 | 1776 | 427.0 |
| D | 5 | 222 | 621777 | 1452.11 | 1817 | 1776 | 427.0 |
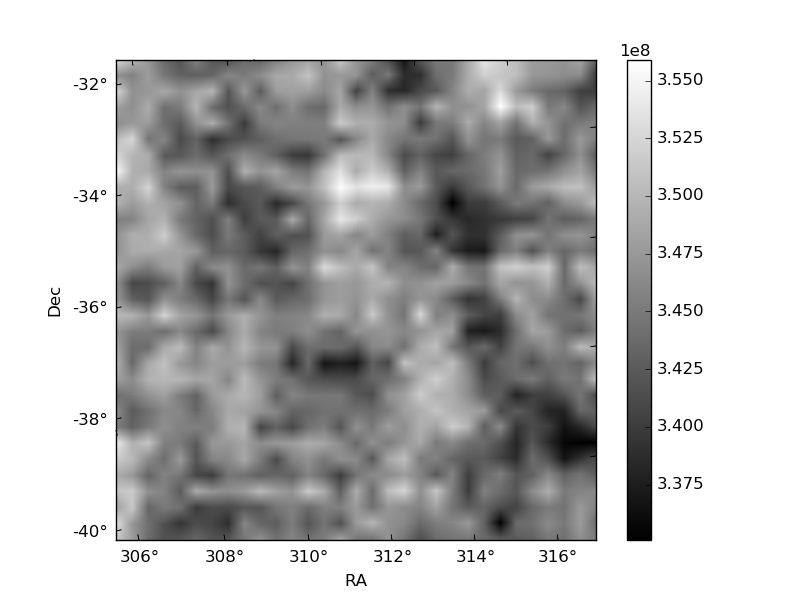
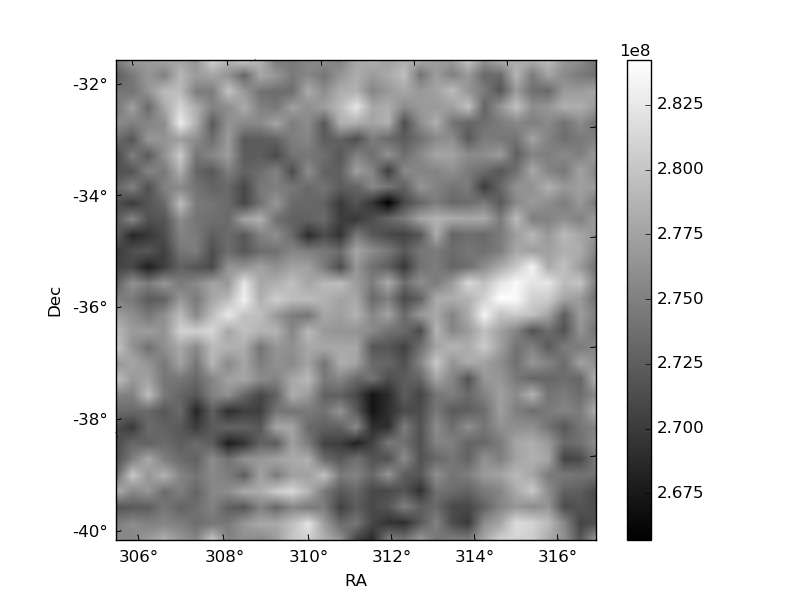
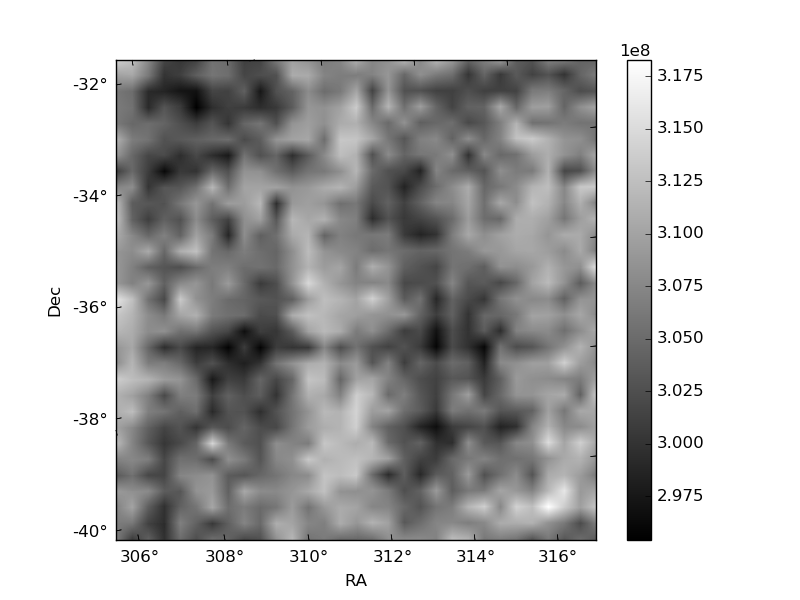
Histogram calculated using DETX and DETY for each event in the final _common_clean file
| Quadrant A | 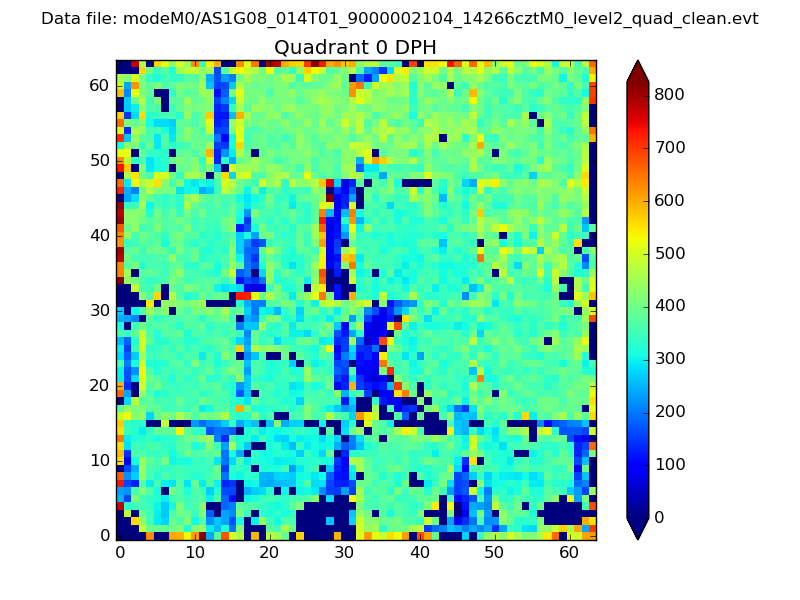 |
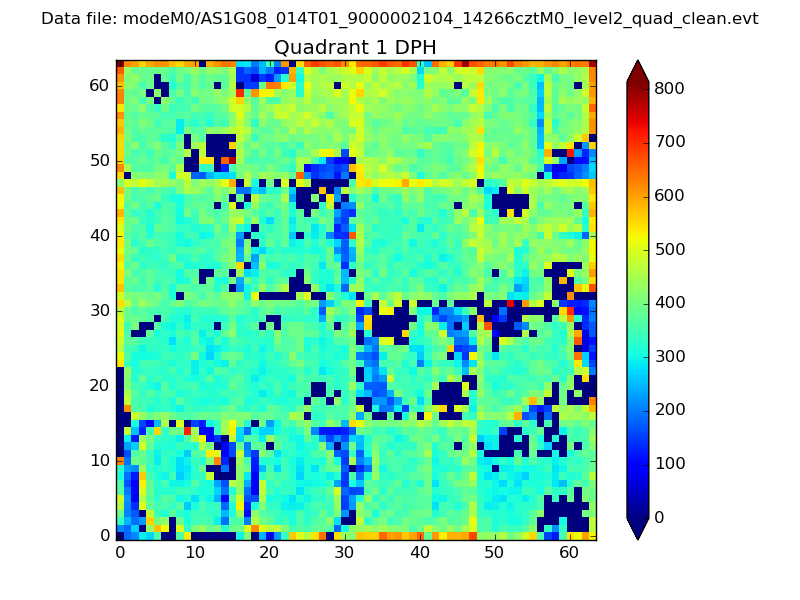 |
Quadrant B |
|---|---|---|---|
| Quadrant D | 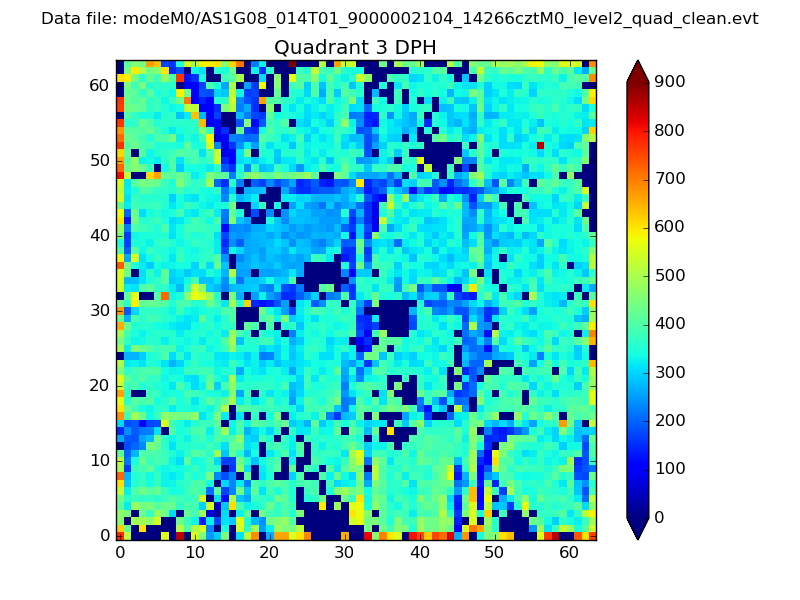 |
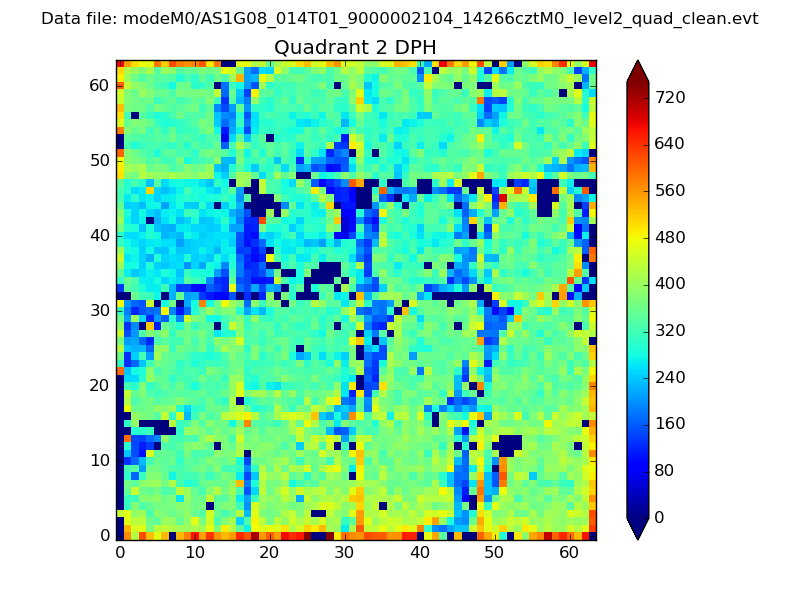 |
Quadrant C |
| Plot type | Count rate plots | Images |
|---|---|---|
| Comparison with Poisson distribution Blue bars denote a histogram of data divided into 1 sec bins. Red curve is a Poisson curve with rate = median count rate of data. |
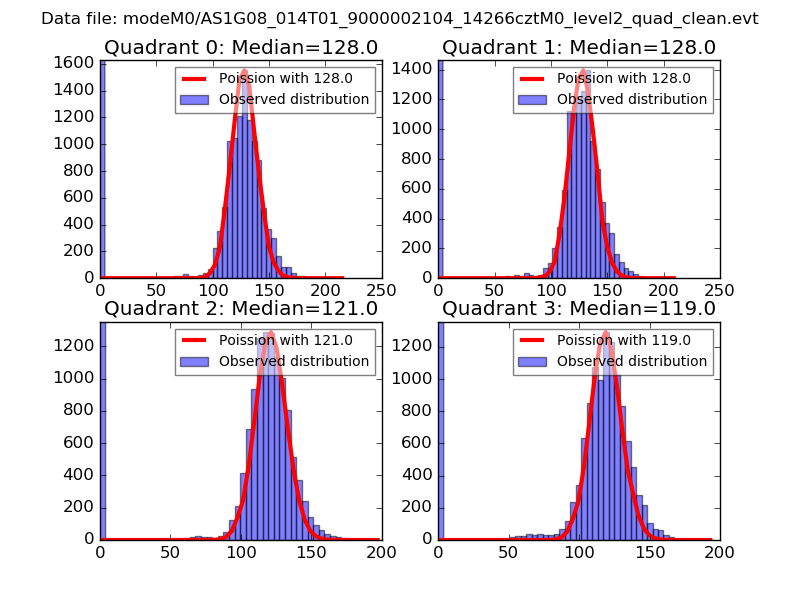 |
 |
| Quadrant-wise count rates Data is divided into 100 sec bins |
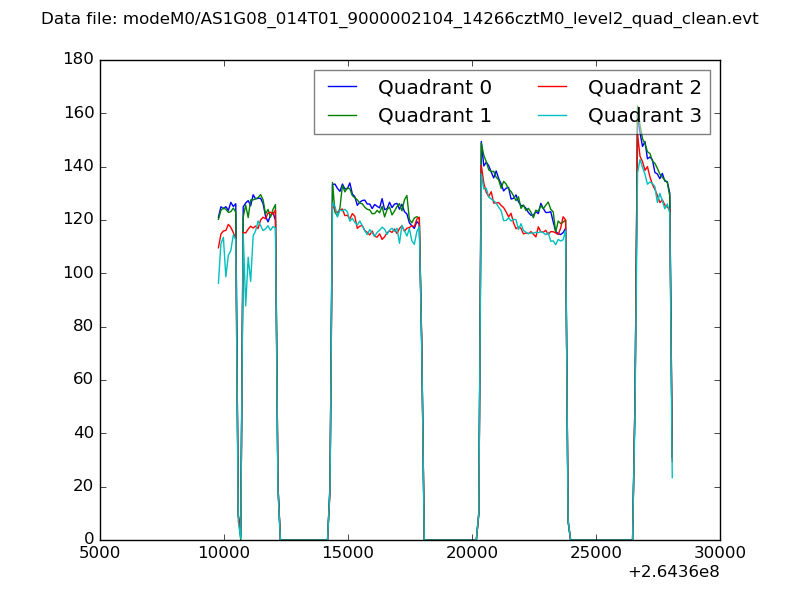 |
|
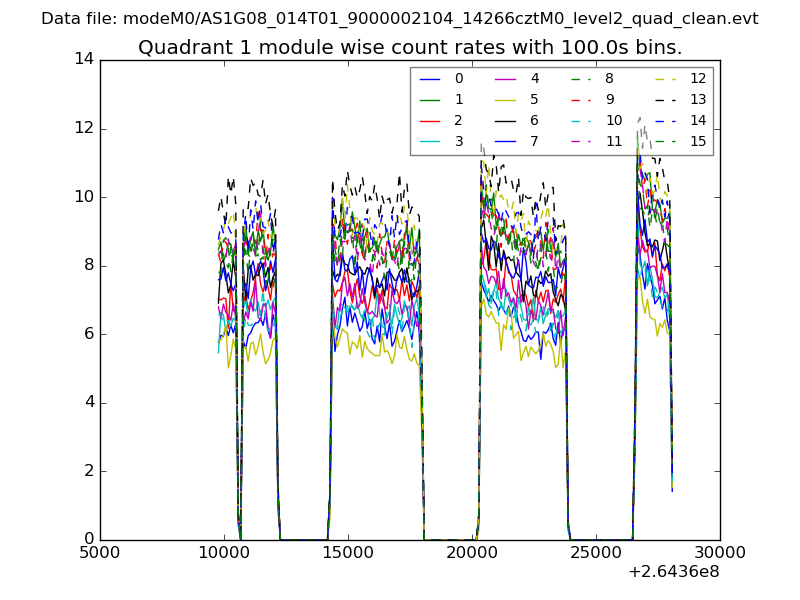
| Module-wise count rates for Quadrant A Data is divided into 100 sec bins |
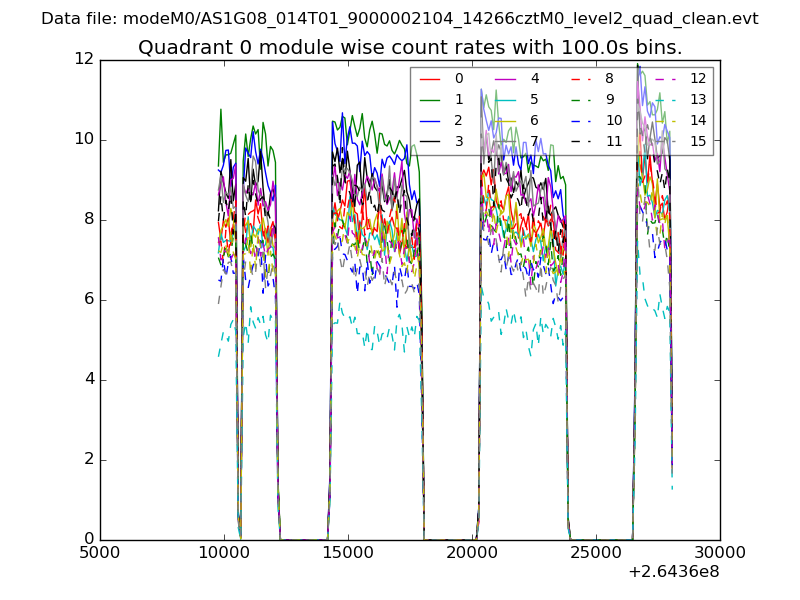 |
 |
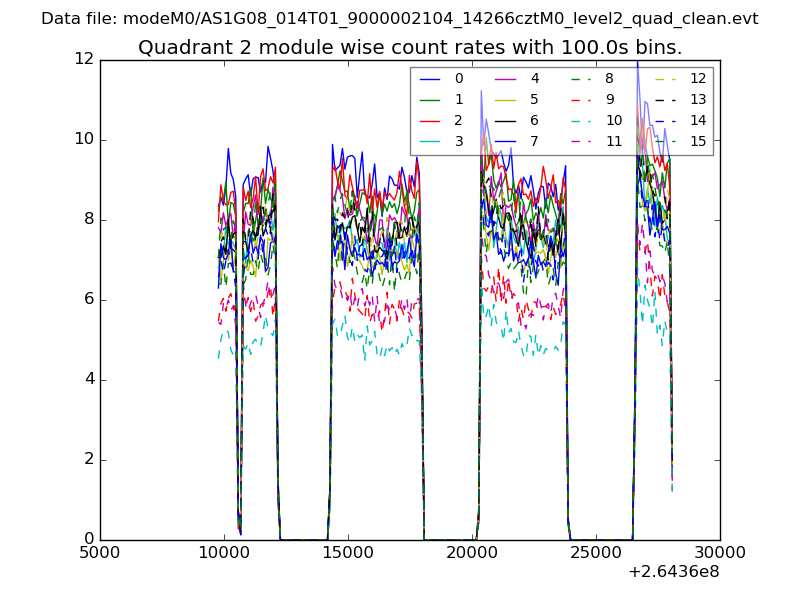
| Module-wise count rates for Quadrant B Data is divided into 100 sec bins |
 |
 |
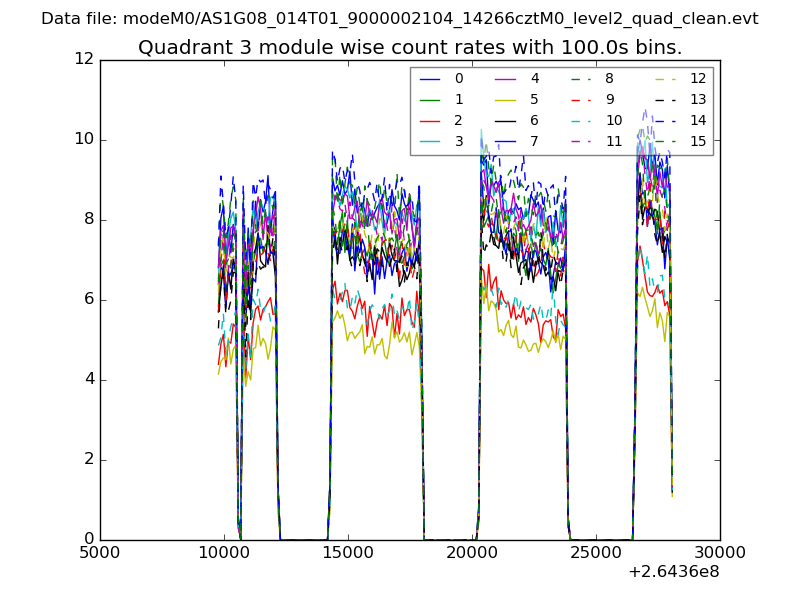
| Module-wise count rates for Quadrant C Data is divided into 100 sec bins |
 |
 |
| Module-wise count rates for Quadrant D Data is divided into 100 sec bins |
 |
 |
| Parameter | Plot |
|---|---|
| CZT HV Monitor | 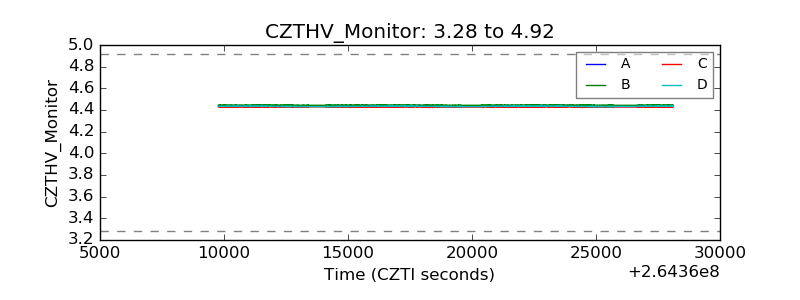 |
| D_VDD | 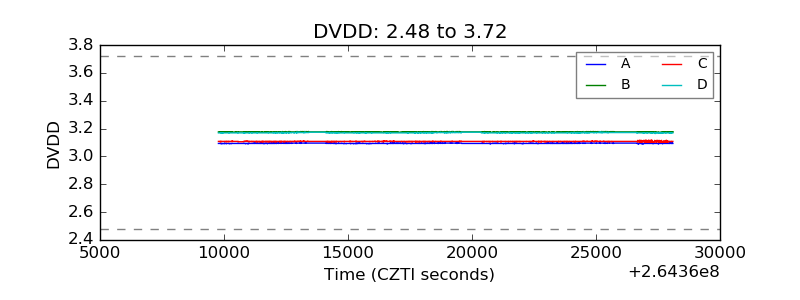 |
| Temperature 1 | 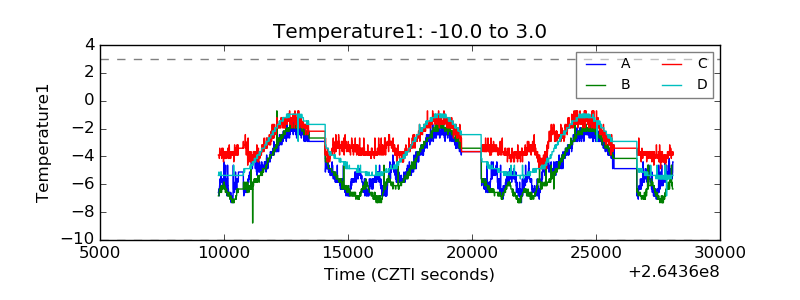 |
| Veto HV Monitor | 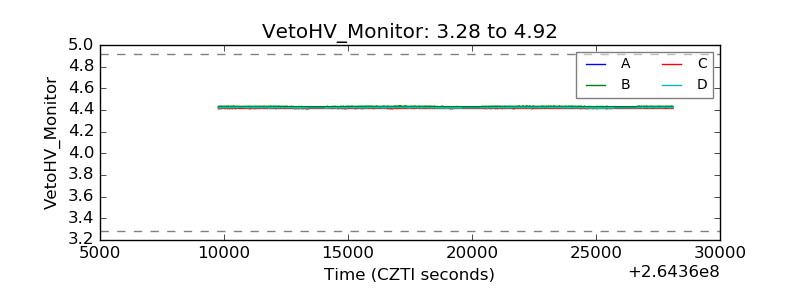 |
| Veto LLD | 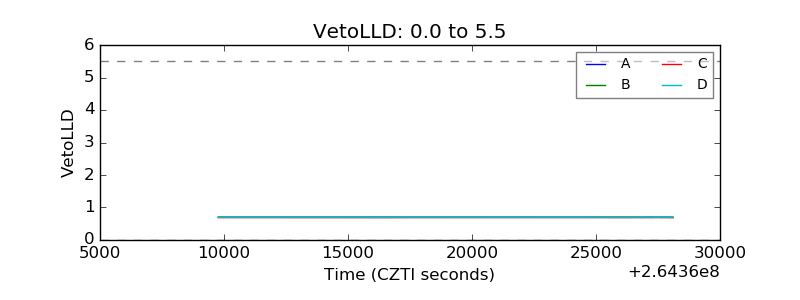 |
| Alpha Counter | 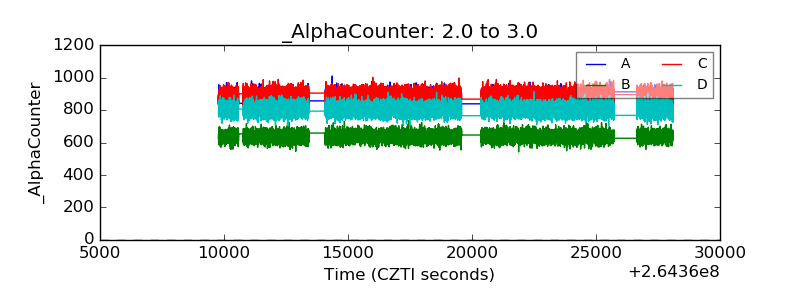 |
| _CPM_Rate | 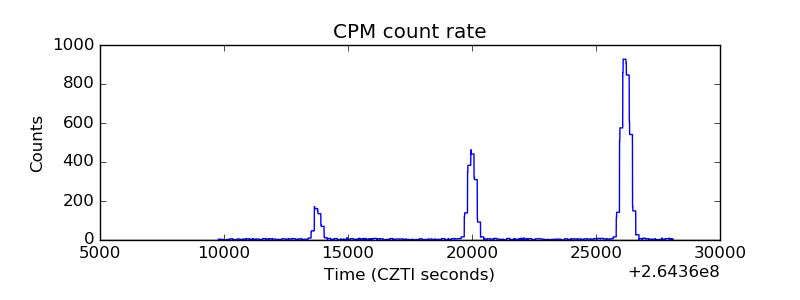 |
| CZT Counter | 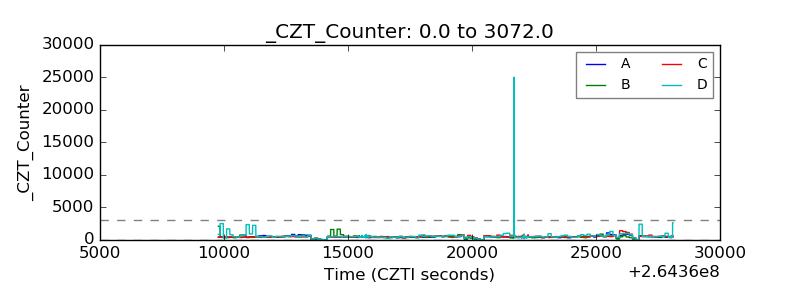 |
| +2.5 Volts monitor |  |
| +5 Volts monitor |  |
| _ROLL_ROT | 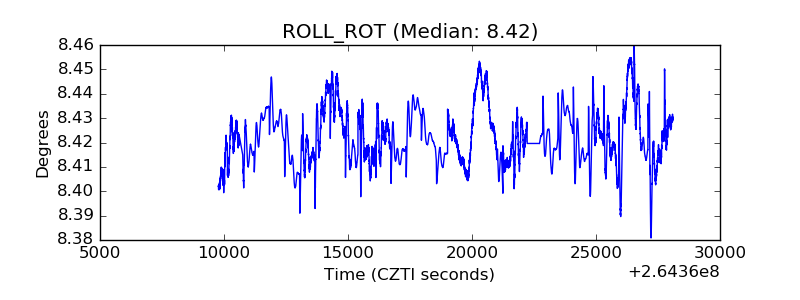 |
| _Roll_DEC | 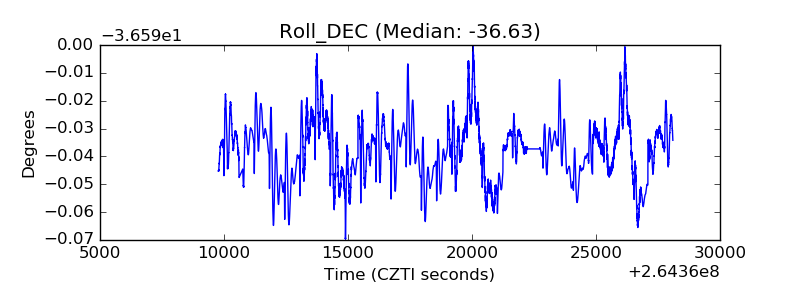 |
| _Roll_RA | 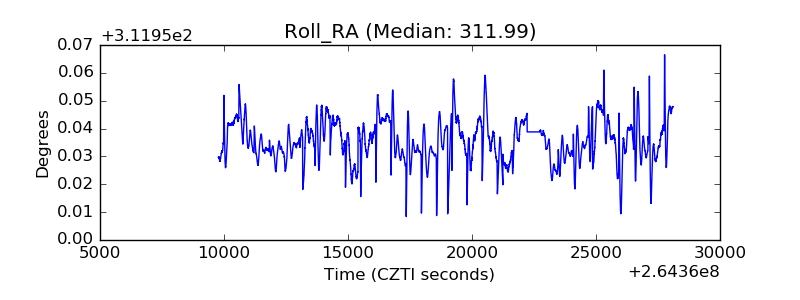 |
| Veto Counter |  |