| Param | Original file | Final file |
|---|---|---|
| Filename | modeM0/AS1G08_014T01_9000002104_14267cztM0_level2.evt | modeM0/AS1G08_014T01_9000002104_14267cztM0_level2_quad_clean.evt |
| Size (bytes) | 888,500,160 | 163,293,120 |
| Size | 847.3 MB | 155.7 MB |
| Events in quadrant A | 5,966,688 | 1,064,505 |
| Events in quadrant B | 5,951,751 | 1,072,127 |
| Events in quadrant C | 6,289,978 | 1,014,605 |
| Events in quadrant D | 7,897,004 | 973,181 |
| Mode M9 | |||
|---|---|---|---|
| Quadrant | BADHDUFLAG | Total packets | Discarded packets |
| A | 0 | 20 | 3 |
| B | 0 | 20 | 3 |
| C | 0 | 20 | 3 |
| D | 0 | 20 | 2 |
| Mode SS | |||
|---|---|---|---|
| Quadrant | BADHDUFLAG | Total packets | Discarded packets |
| A | 0 | 244 | 4 |
| B | 0 | 244 | 4 |
| C | 0 | 244 | 4 |
| D | 0 | 244 | 4 |
| Mode M0 | |||
|---|---|---|---|
| Quadrant | BADHDUFLAG | Total packets | Discarded packets |
| A | 0 | 25692 | 279 |
| B | 0 | 25470 | 213 |
| C | 0 | 25614 | 220 |
| D | 0 | 31446 | 338 |
| Quadrant | Total seconds | Saturated seconds | Saturation percentage |
|---|---|---|---|
| A | 11871 | 30 | 0.252717% |
| B | 11877 | 73 | 0.614633% |
| C | 11875 | 15 | 0.126316% |
| D | 11866 | 398 | 3.354121% |
Noise dominated data is calculated using 1-second bins in cleaned event files. If a bin has >2000 counts, and if more than 50% of those come from <1% of pixels, then it is considered to be noise-dominated and hence unusable.
| Quadrant | # 1 sec bins | Bins with >0 counts | Bins with >2000 counts | High rate bins dominated by noise | Noise dominated (total time) | Noise dominated (detector-on time) | Marked lightcurve |
|---|---|---|---|---|---|---|---|
| A | 13927 | 11883 | 2 | 2 | 0.01% | 0.02% | 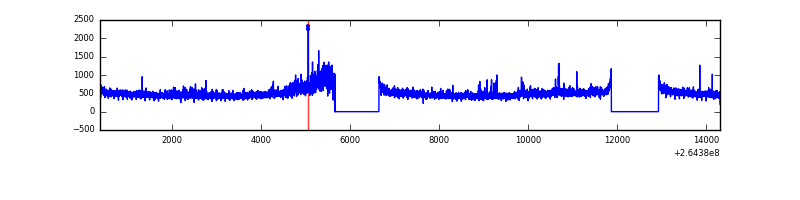 |
| B | 13927 | 11885 | 10 | 10 | 0.07% | 0.08% | 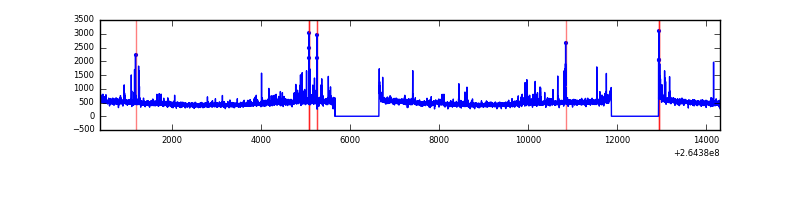 |
| C | 13927 | 11883 | 0 | 0 | 0.00% | 0.00% | 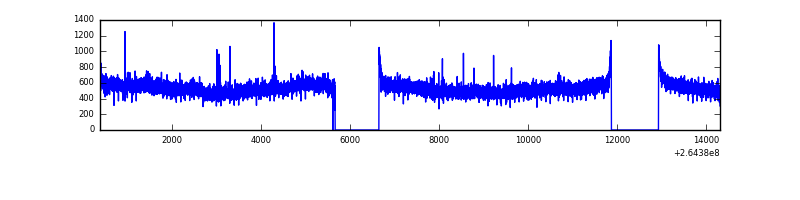 |
| D | 13926 | 11874 | 329 | 329 | 2.36% | 2.77% | 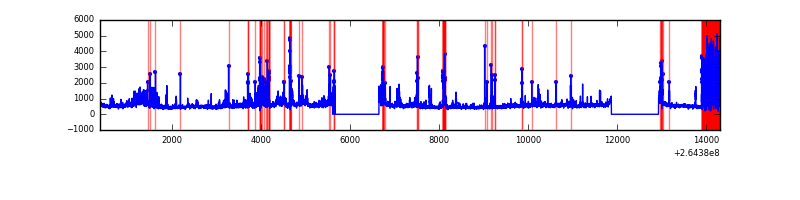 |
Top three noisy pixels from each quadrant. If the there are fewer than three noisy pixels in the level2.evt file, extra rows are filled as -1
| Pixel properties | Quadrant properties | ||||||
|---|---|---|---|---|---|---|---|
| Quadrant | DetID | PixID | Counts | Sigma | Mean | Median | Sigma |
| A | 12 | 189 | 206847 | 716.27 | 1436 | 1406 | 286.8 |
| A | 11 | 29 | 173401 | 599.66 | 1436 | 1406 | 286.8 |
| A | 6 | 16 | 24715 | 81.27 | 1436 | 1406 | 286.8 |
| B | 0 | 229 | 133477 | 487.3 | 1435 | 1400 | 271.0 |
| B | 0 | 219 | 84137 | 305.26 | 1435 | 1400 | 271.0 |
| B | 10 | 245 | 67200 | 242.77 | 1435 | 1400 | 271.0 |
| C | 3 | 233 | 830435 | 2555.89 | 1397 | 1404 | 324.4 |
| C | 13 | 61 | 9988 | 26.46 | 1397 | 1404 | 324.4 |
| C | 10 | 22 | 5967 | 14.07 | 1397 | 1404 | 324.4 |
| D | 5 | 222 | 1271769 | 3946.14 | 1372 | 1340 | 321.9 |
| D | 8 | 195 | 599715 | 1858.64 | 1372 | 1340 | 321.9 |
| D | 12 | 110 | 328657 | 1016.7 | 1372 | 1340 | 321.9 |
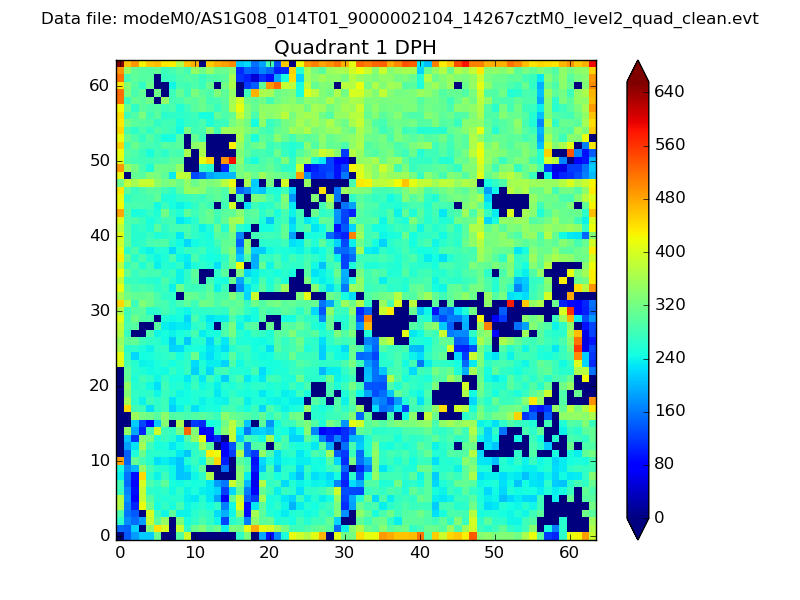
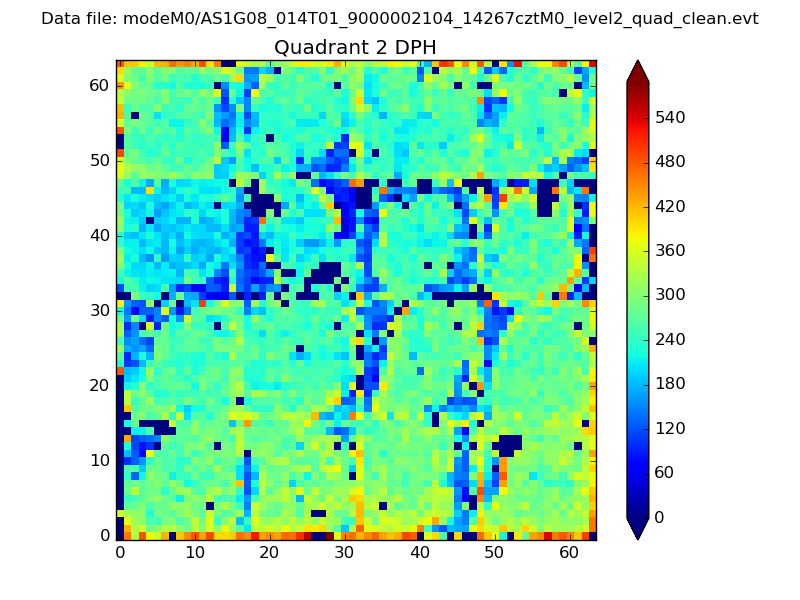
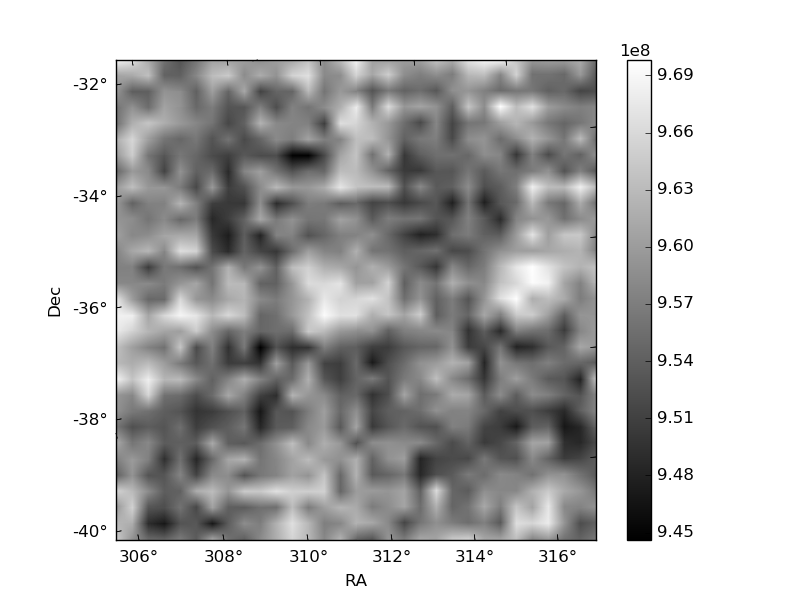
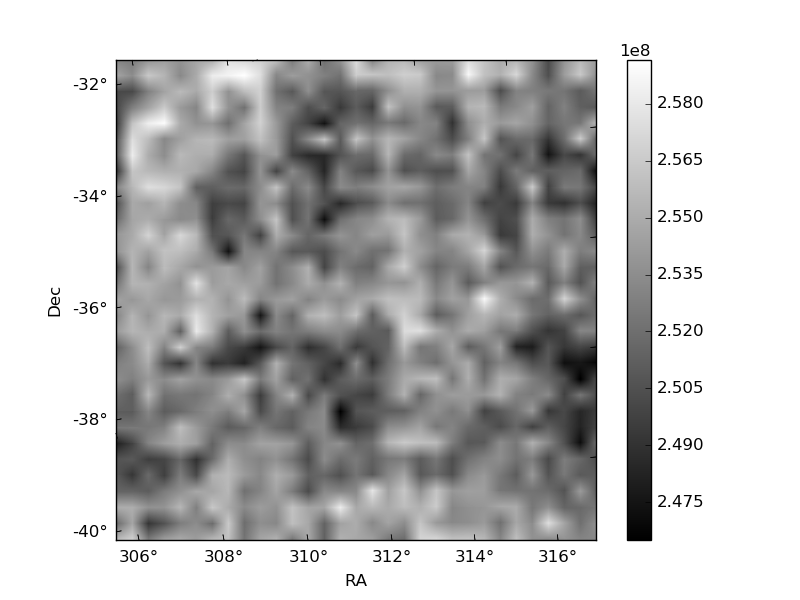
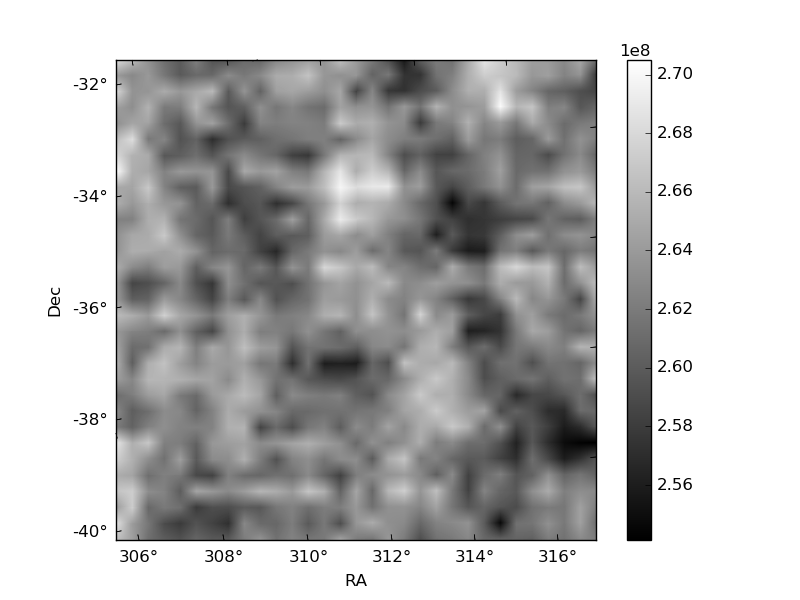
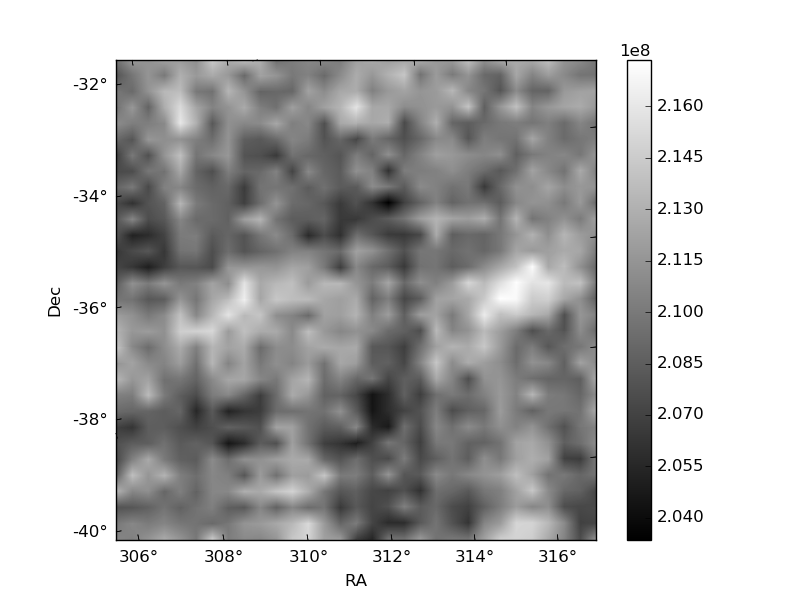
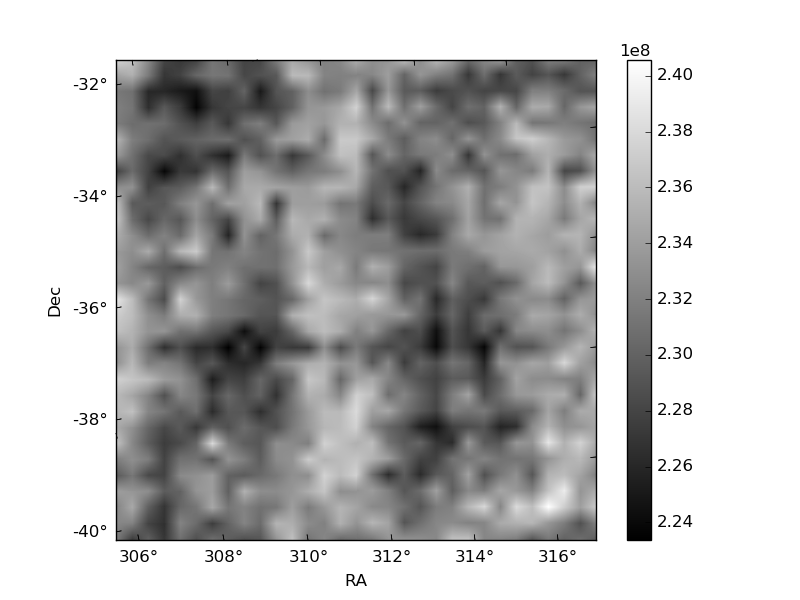
Histogram calculated using DETX and DETY for each event in the final _common_clean file
| Quadrant A |  |
 |
Quadrant B |
|---|---|---|---|
| Quadrant D | 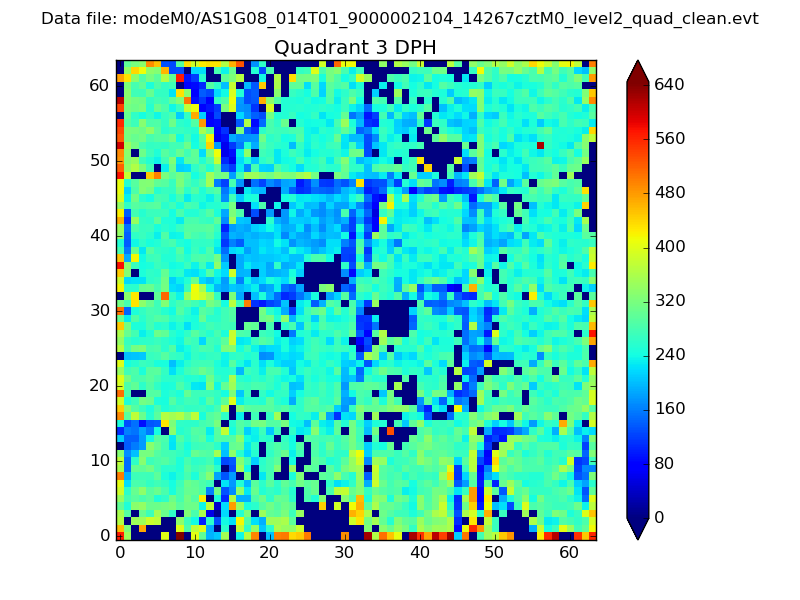 |
 |
Quadrant C |
| Plot type | Count rate plots | Images |
|---|---|---|
| Comparison with Poisson distribution Blue bars denote a histogram of data divided into 1 sec bins. Red curve is a Poisson curve with rate = median count rate of data. |
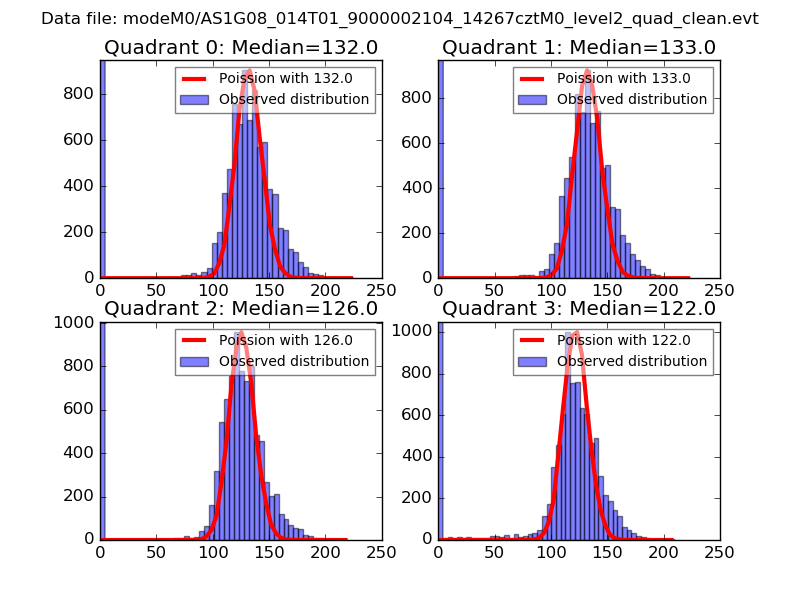 |
 |
| Quadrant-wise count rates Data is divided into 100 sec bins |
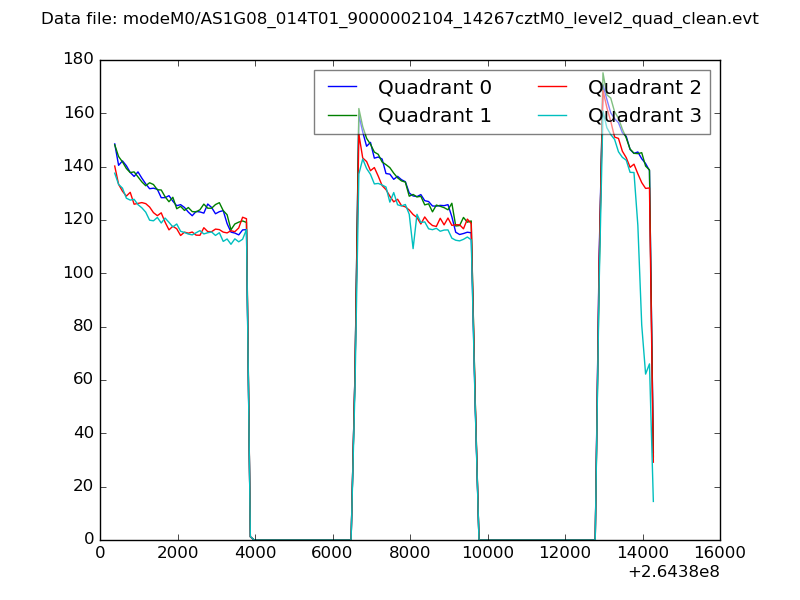 |
|
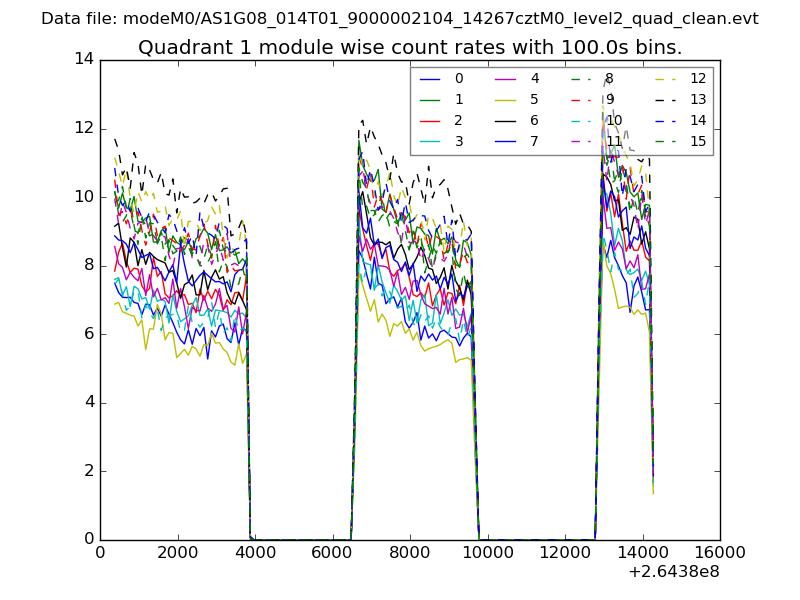
| Module-wise count rates for Quadrant A Data is divided into 100 sec bins |
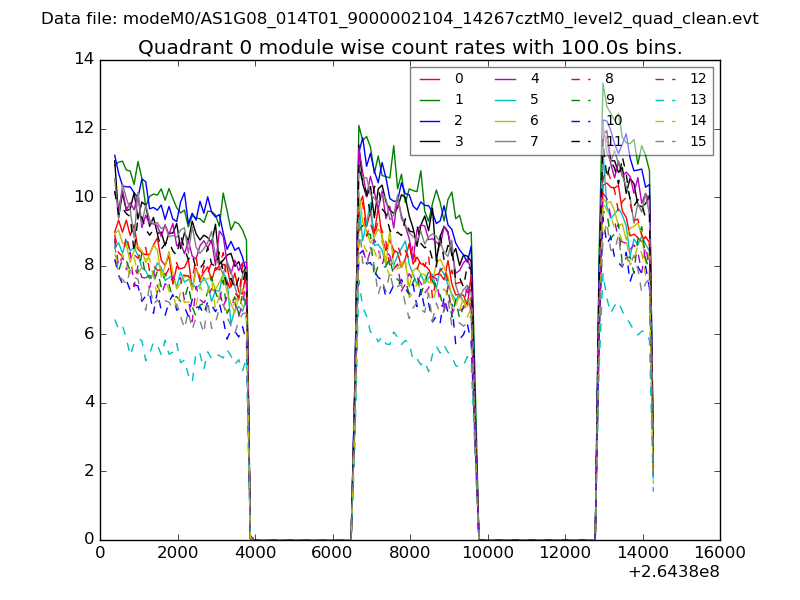 |
 |
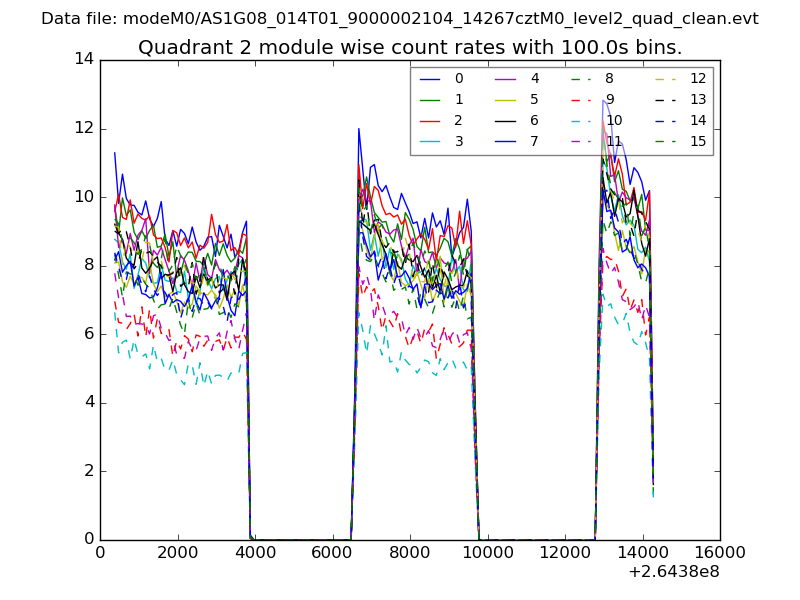
| Module-wise count rates for Quadrant B Data is divided into 100 sec bins |
 |
 |
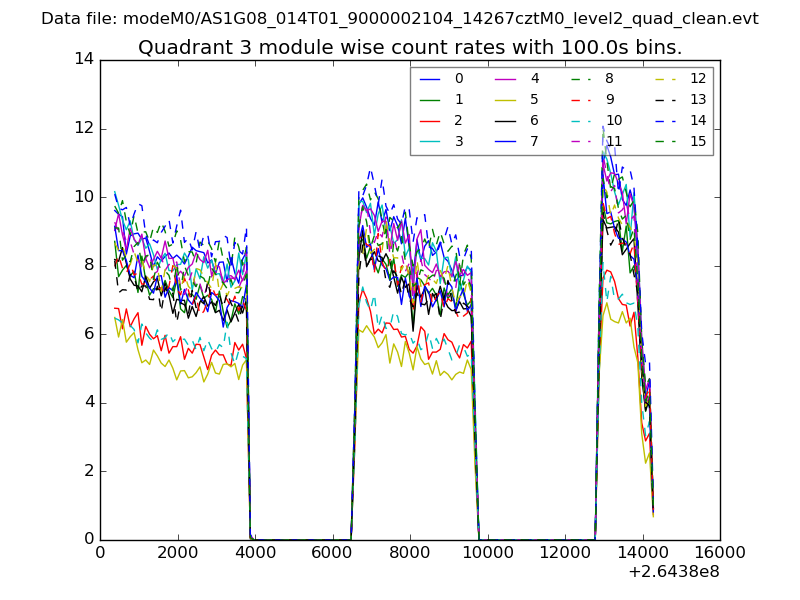
| Module-wise count rates for Quadrant C Data is divided into 100 sec bins |
 |
 |
| Module-wise count rates for Quadrant D Data is divided into 100 sec bins |
 |
 |
| Parameter | Plot |
|---|---|
| CZT HV Monitor | 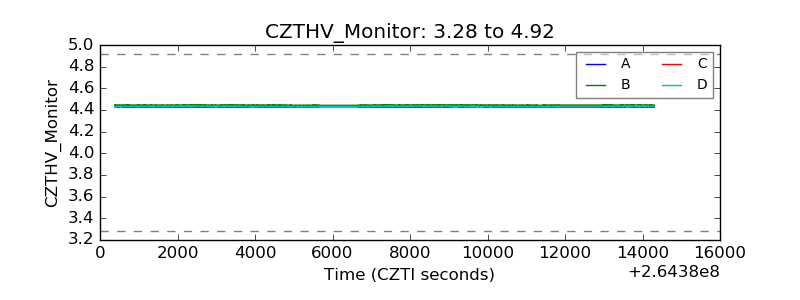 |
| D_VDD | 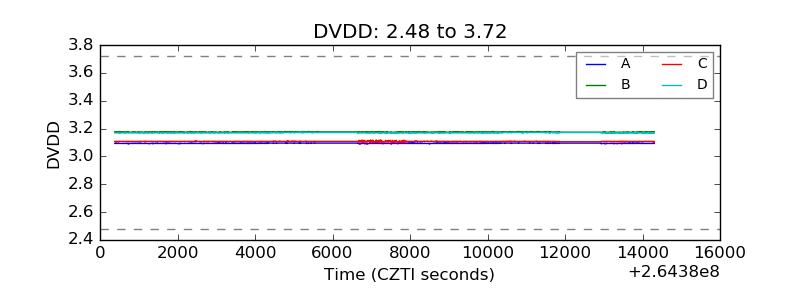 |
| Temperature 1 | 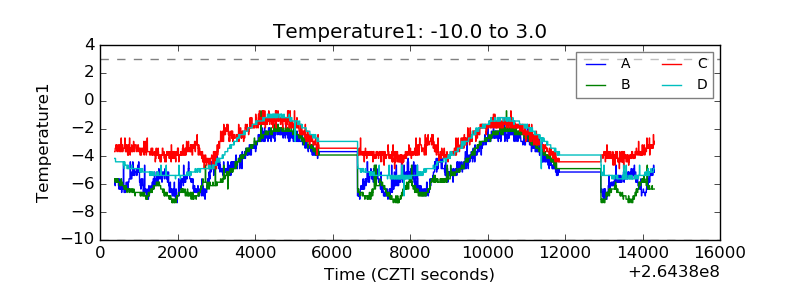 |
| Veto HV Monitor | 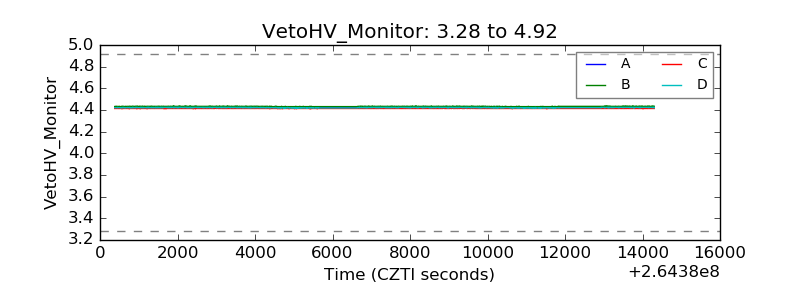 |
| Veto LLD | 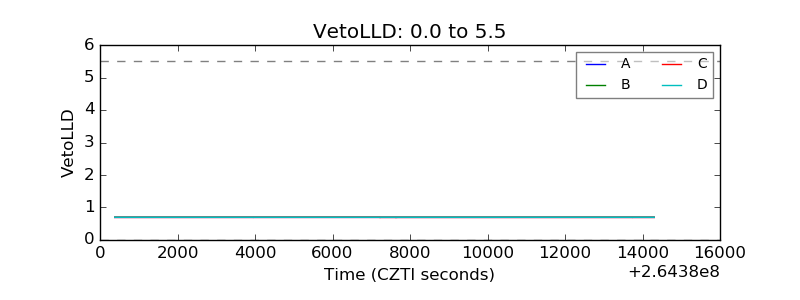 |
| Alpha Counter | 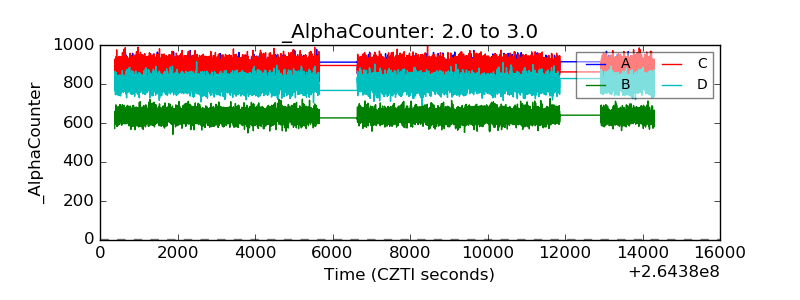 |
| _CPM_Rate | 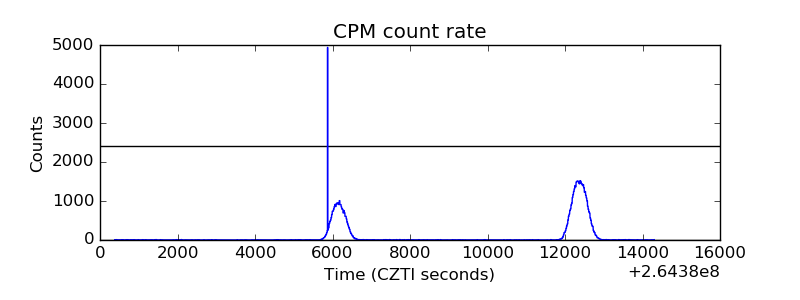 |
| CZT Counter | 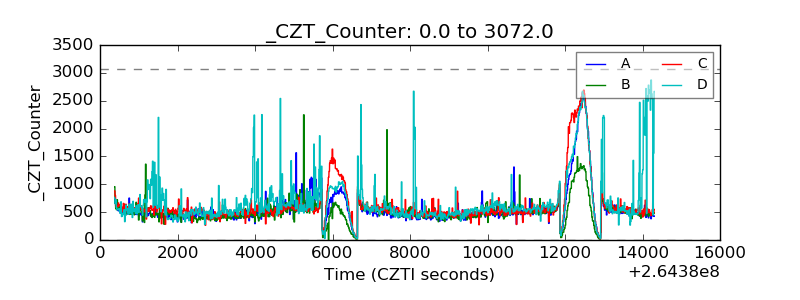 |
| +2.5 Volts monitor | 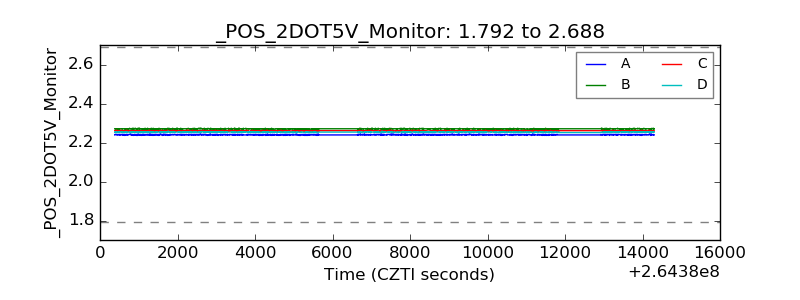 |
| +5 Volts monitor |  |
| _ROLL_ROT | 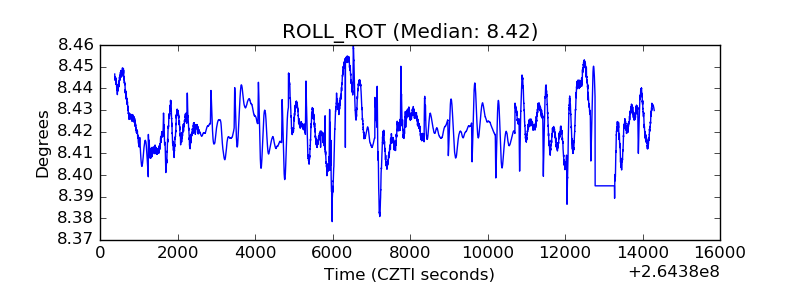 |
| _Roll_DEC | 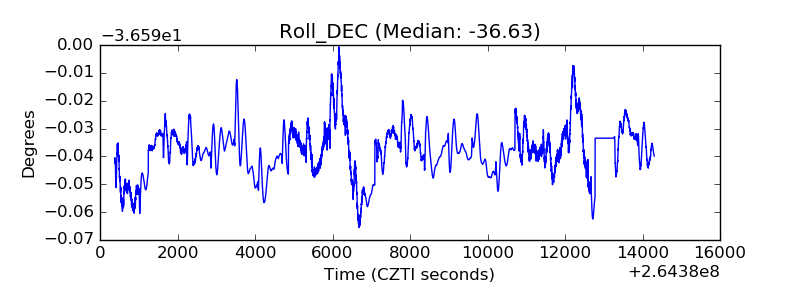 |
| _Roll_RA |  |
| Veto Counter | 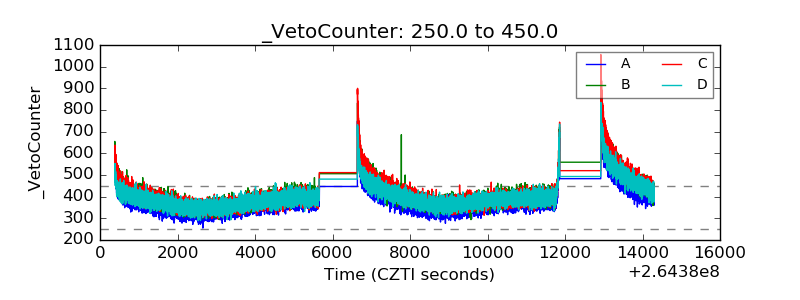 |