| Param | Original file | Final file |
|---|---|---|
| Filename | modeM0/AS1G08_014T01_9000002104_14270cztM0_level2.evt | modeM0/AS1G08_014T01_9000002104_14270cztM0_level2_quad_clean.evt |
| Size (bytes) | 609,675,840 | 113,267,520 |
| Size | 581.4 MB | 108.0 MB |
| Events in quadrant A | 3,686,171 | 774,293 |
| Events in quadrant B | 3,764,949 | 776,577 |
| Events in quadrant C | 3,836,724 | 743,288 |
| Events in quadrant D | 6,693,228 | 639,861 |
| Mode M9 | |||
|---|---|---|---|
| Quadrant | BADHDUFLAG | Total packets | Discarded packets |
| A | 0 | 17 | 9 |
| B | 0 | 18 | 12 |
| C | 0 | 19 | 11 |
| D | 0 | 23 | 14 |
| Mode SS | |||
|---|---|---|---|
| Quadrant | BADHDUFLAG | Total packets | Discarded packets |
| A | 0 | 158 | 10 |
| B | 0 | 156 | 16 |
| C | 0 | 159 | 11 |
| D | 0 | 157 | 17 |
| Mode M0 | |||
|---|---|---|---|
| Quadrant | BADHDUFLAG | Total packets | Discarded packets |
| A | 0 | 16871 | 1502 |
| B | 0 | 17107 | 1565 |
| C | 0 | 17013 | 1478 |
| D | 0 | 27251 | 2787 |
| Quadrant | Total seconds | Saturated seconds | Saturation percentage |
|---|---|---|---|
| A | 7161 | 22 | 0.307220% |
| B | 7143 | 40 | 0.559989% |
| C | 7166 | 16 | 0.223277% |
| D | 6999 | 1007 | 14.387770% |
Noise dominated data is calculated using 1-second bins in cleaned event files. If a bin has >2000 counts, and if more than 50% of those come from <1% of pixels, then it is considered to be noise-dominated and hence unusable.
| Quadrant | # 1 sec bins | Bins with >0 counts | Bins with >2000 counts | High rate bins dominated by noise | Noise dominated (total time) | Noise dominated (detector-on time) | Marked lightcurve |
|---|---|---|---|---|---|---|---|
| A | 14156 | 7460 | 3 | 3 | 0.02% | 0.04% | 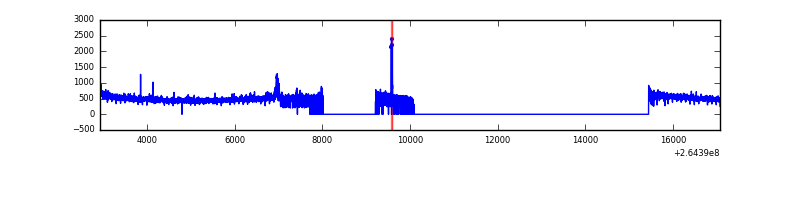 |
| B | 14156 | 7440 | 7 | 7 | 0.05% | 0.09% | 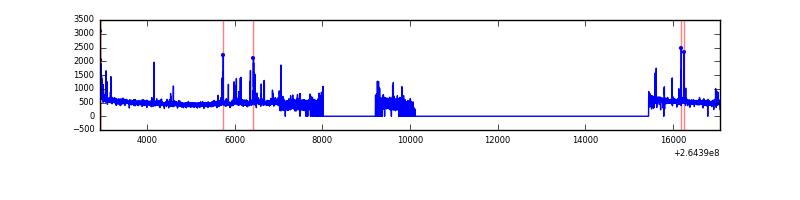 |
| C | 14156 | 7450 | 1 | 1 | 0.01% | 0.01% | 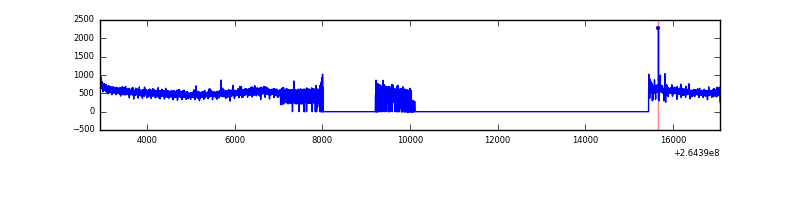 |
| D | 14156 | 7348 | 811 | 811 | 5.73% | 11.04% | 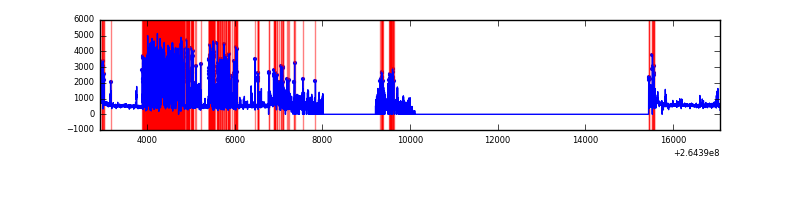 |
Top three noisy pixels from each quadrant. If the there are fewer than three noisy pixels in the level2.evt file, extra rows are filled as -1
| Pixel properties | Quadrant properties | ||||||
|---|---|---|---|---|---|---|---|
| Quadrant | DetID | PixID | Counts | Sigma | Mean | Median | Sigma |
| A | 12 | 189 | 94981 | 512.55 | 920 | 902 | 183.6 |
| A | 4 | 2 | 19610 | 101.92 | 920 | 902 | 183.6 |
| A | 8 | 15 | 19184 | 99.6 | 920 | 902 | 183.6 |
| B | 0 | 229 | 113194 | 660.45 | 907 | 887 | 170.0 |
| B | 4 | 48 | 41600 | 239.42 | 907 | 887 | 170.0 |
| B | 15 | 201 | 19538 | 109.68 | 907 | 887 | 170.0 |
| C | 3 | 233 | 338581 | 1652.51 | 895 | 903 | 204.3 |
| C | 13 | 61 | 6342 | 26.62 | 895 | 903 | 204.3 |
| C | 14 | 234 | 4796 | 19.05 | 895 | 903 | 204.3 |
| D | 5 | 222 | 2813726 | 14618.14 | 819 | 801 | 192.4 |
| D | 8 | 195 | 310001 | 1606.84 | 819 | 801 | 192.4 |
| D | 12 | 110 | 265029 | 1373.13 | 819 | 801 | 192.4 |
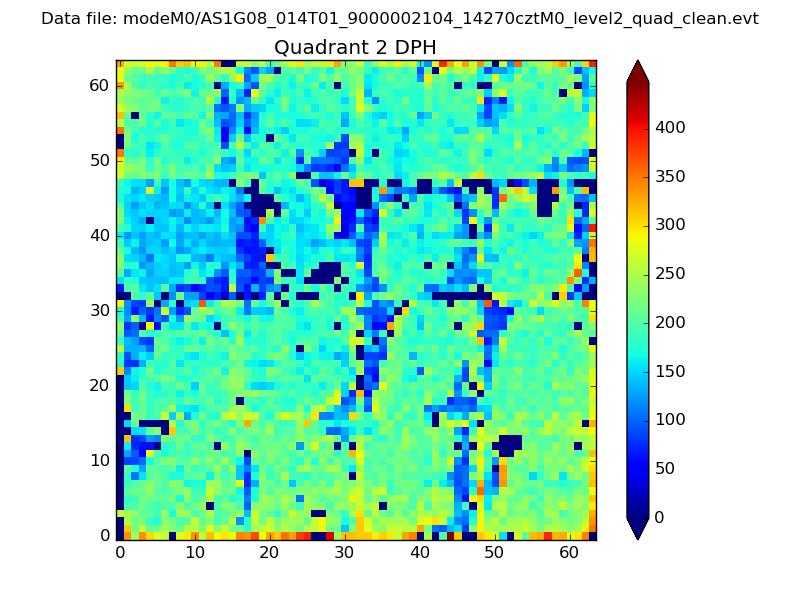
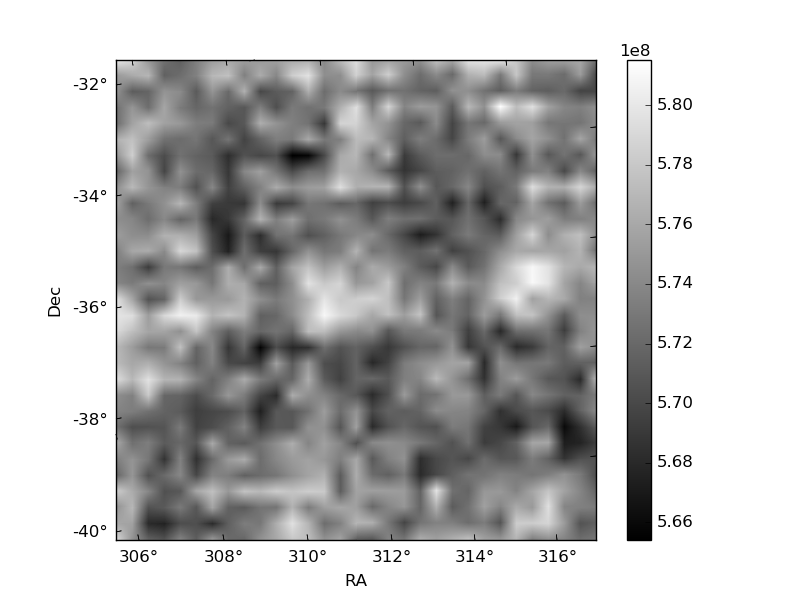
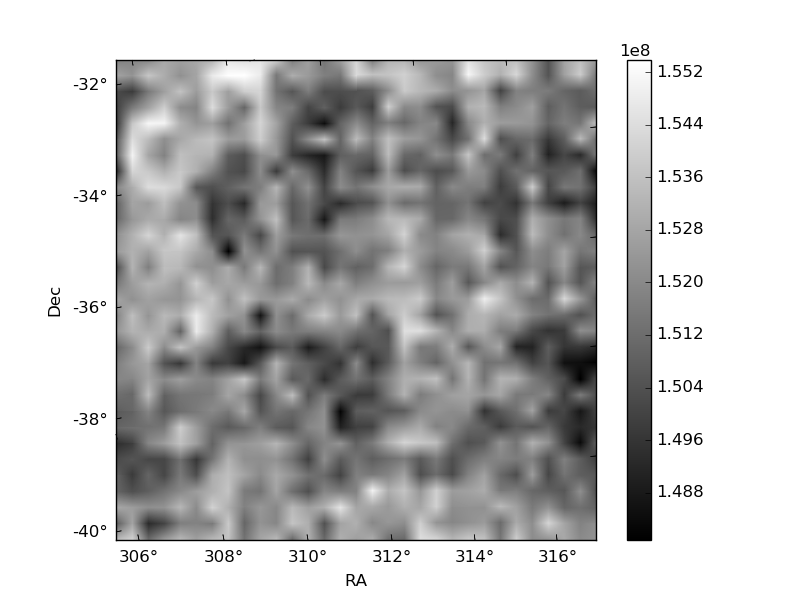
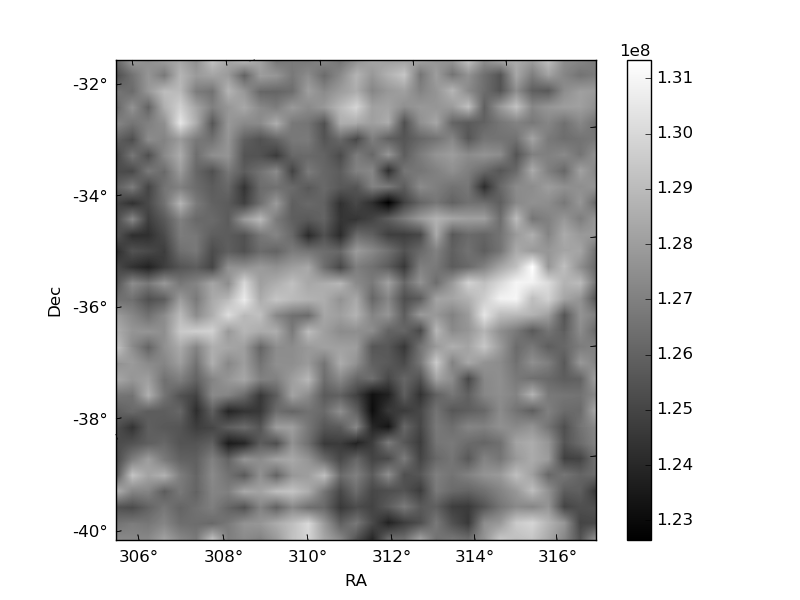
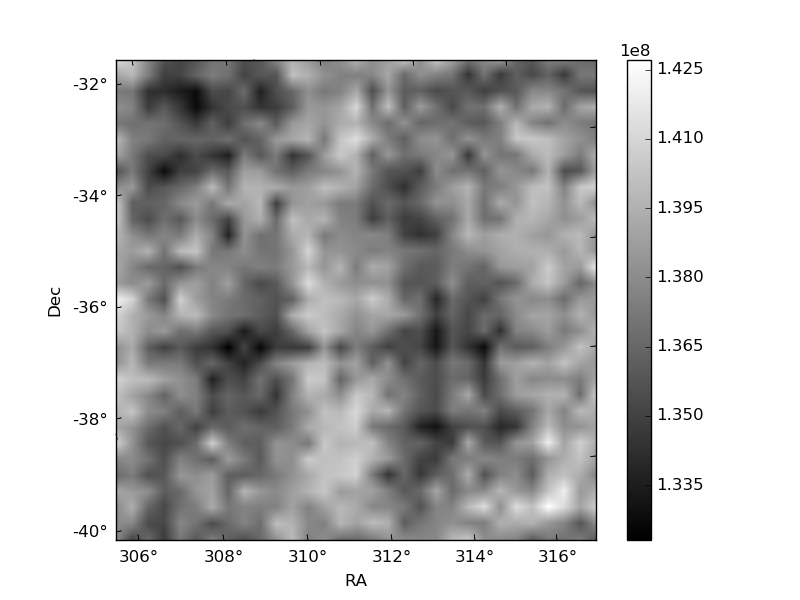
Histogram calculated using DETX and DETY for each event in the final _common_clean file
| Quadrant A | 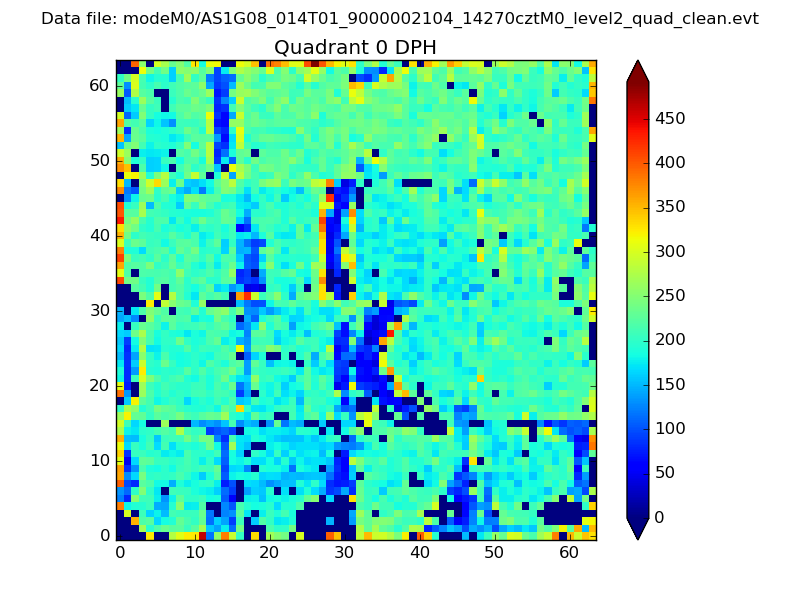 |
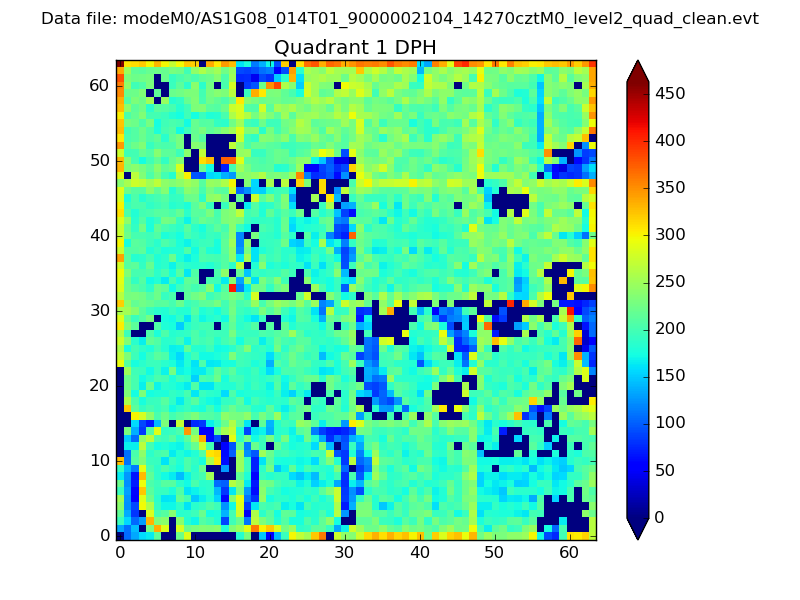 |
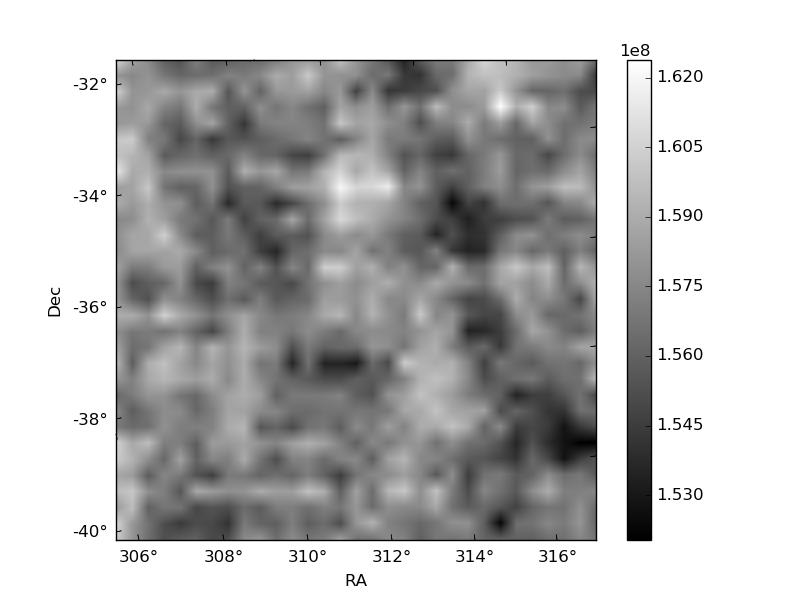
Quadrant B |
|---|---|---|---|
| Quadrant D | 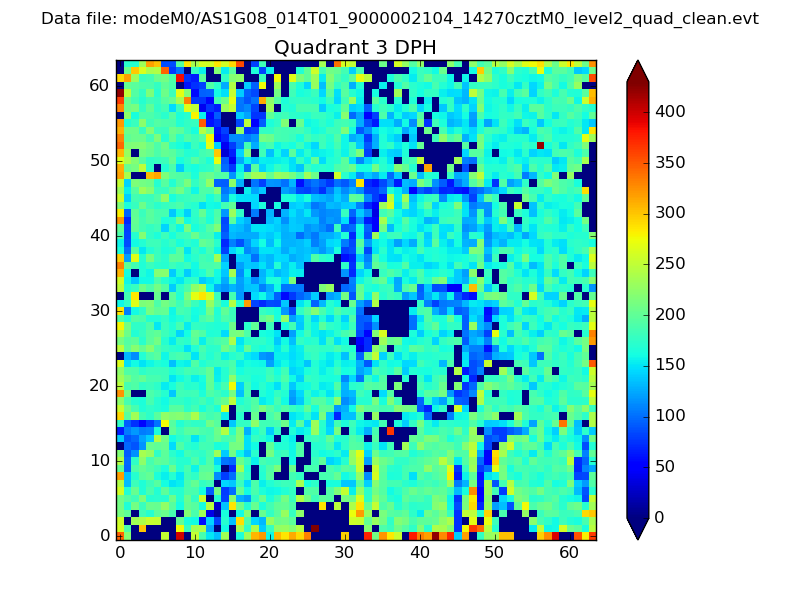 |
 |
Quadrant C |
| Plot type | Count rate plots | Images |
|---|---|---|
| Comparison with Poisson distribution Blue bars denote a histogram of data divided into 1 sec bins. Red curve is a Poisson curve with rate = median count rate of data. |
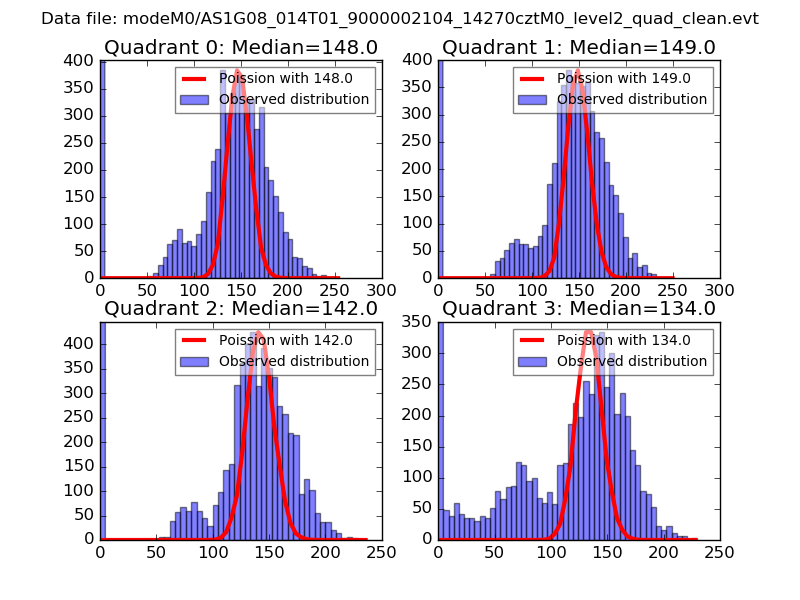 |
 |
| Quadrant-wise count rates Data is divided into 100 sec bins |
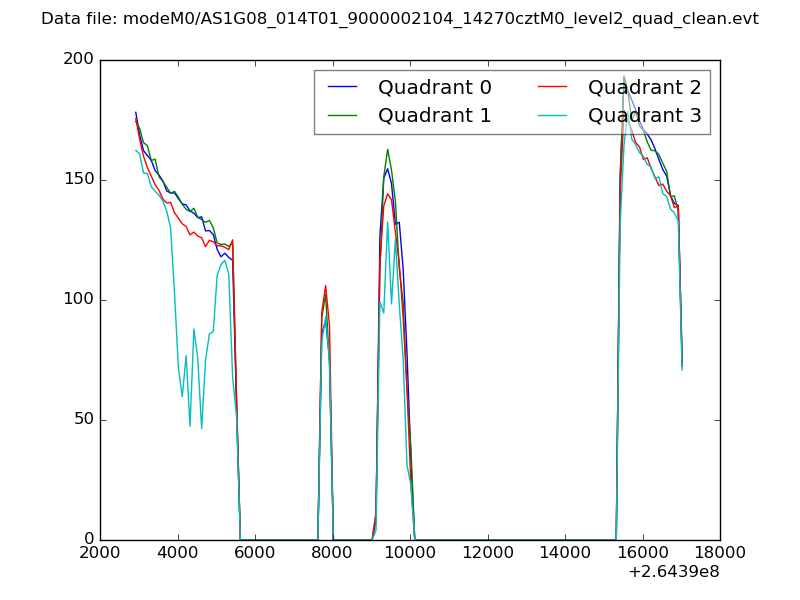 |
|
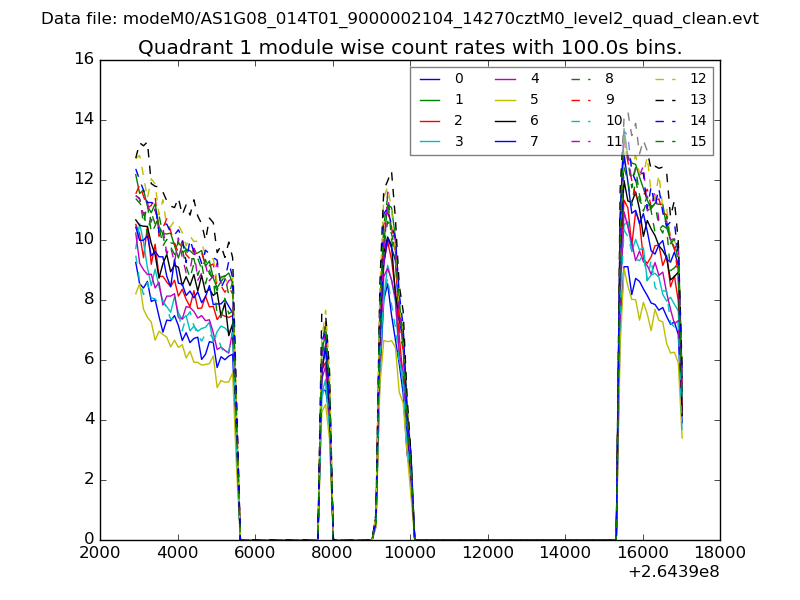
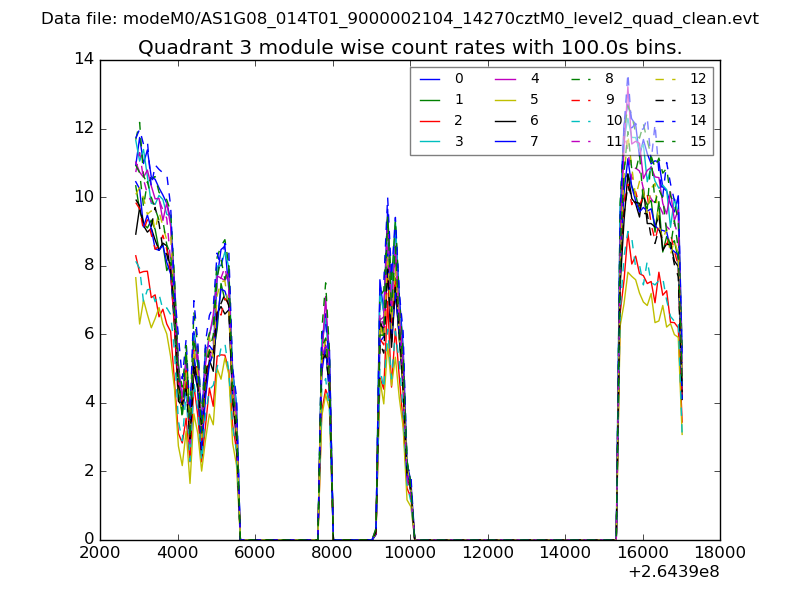
| Module-wise count rates for Quadrant A Data is divided into 100 sec bins |
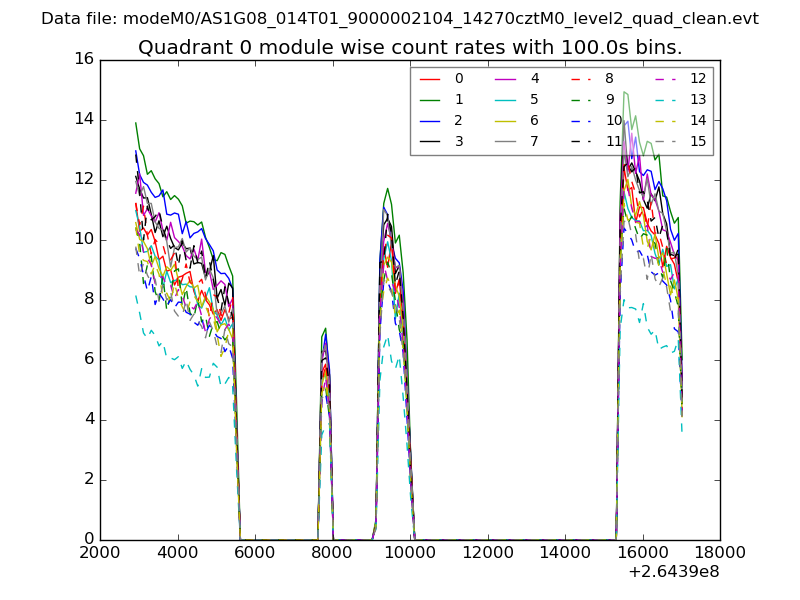 |
 |
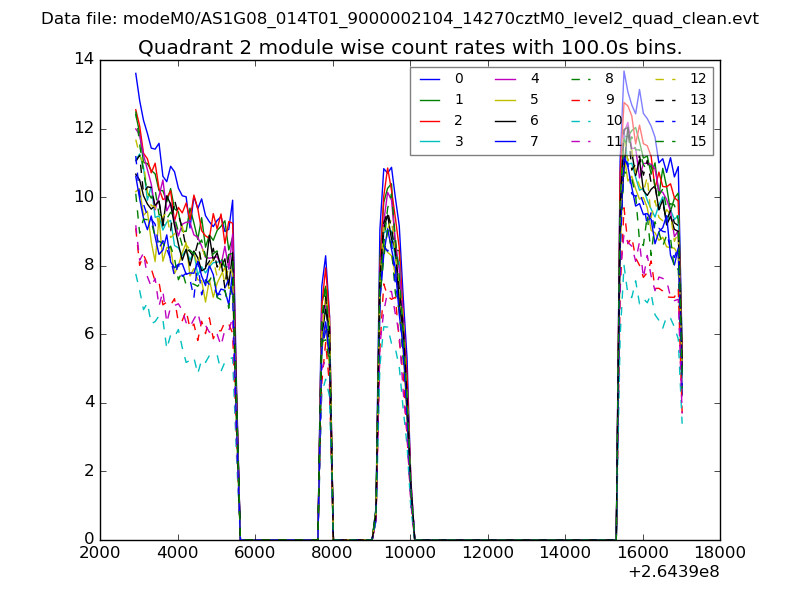
| Module-wise count rates for Quadrant B Data is divided into 100 sec bins |
 |
 |
| Module-wise count rates for Quadrant C Data is divided into 100 sec bins |
 |
 |
| Module-wise count rates for Quadrant D Data is divided into 100 sec bins |
 |
 |
| Parameter | Plot |
|---|---|
| CZT HV Monitor | 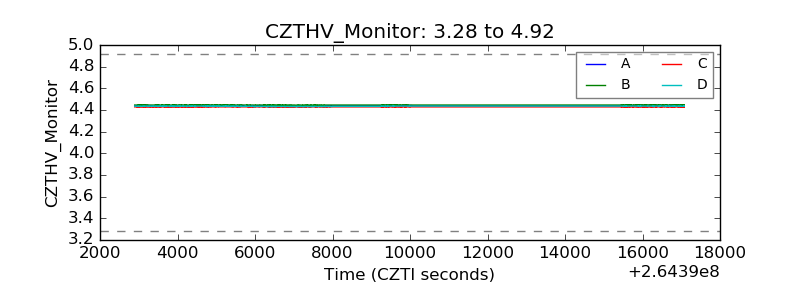 |
| D_VDD | 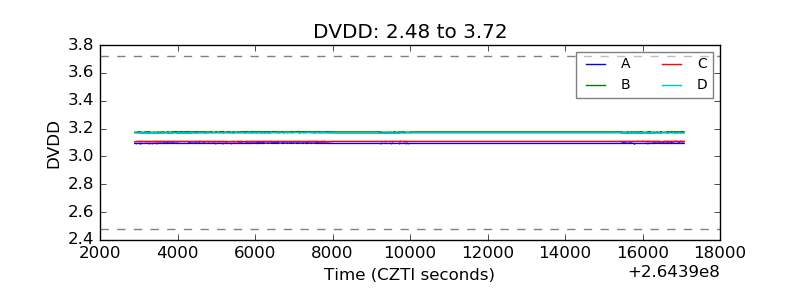 |
| Temperature 1 | 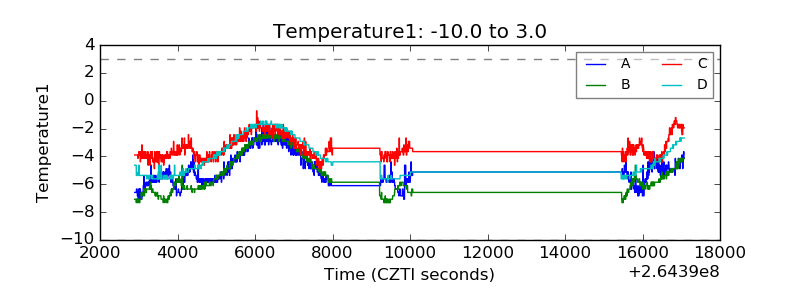 |
| Veto HV Monitor | 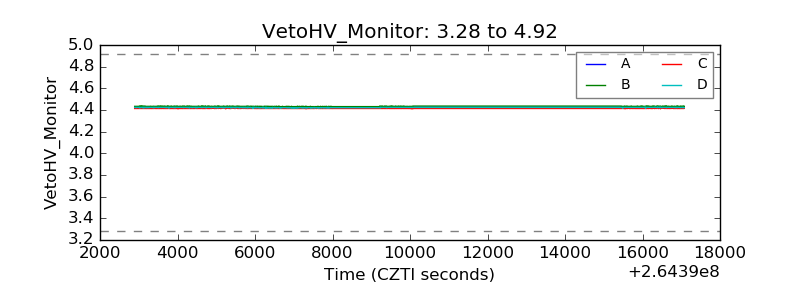 |
| Veto LLD | 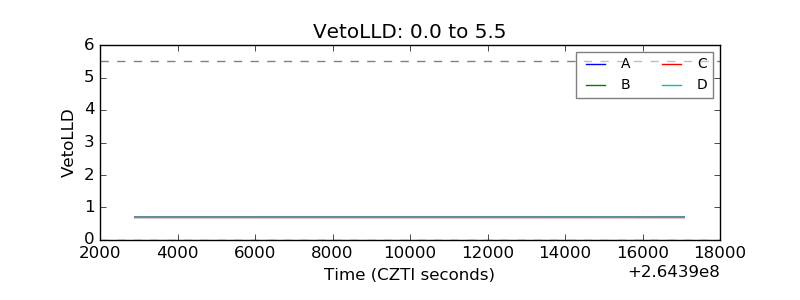 |
| Alpha Counter | 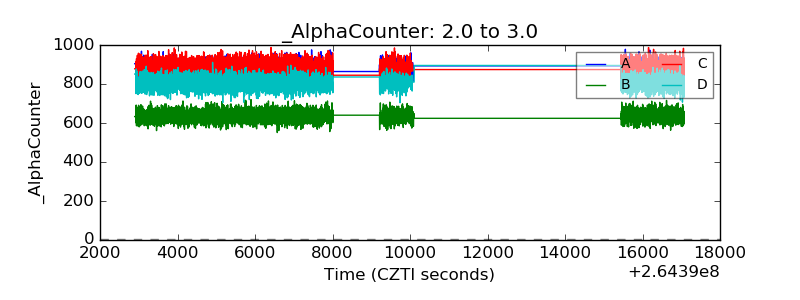 |
| _CPM_Rate | 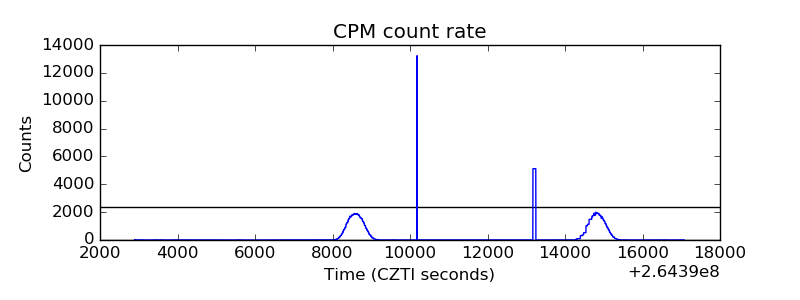 |
| CZT Counter | 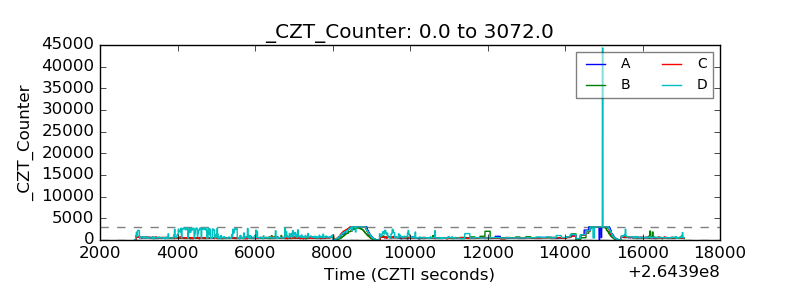 |
| +2.5 Volts monitor | 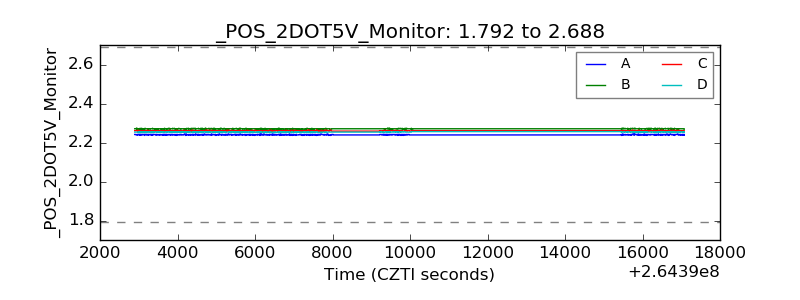 |
| +5 Volts monitor |  |
| _ROLL_ROT | 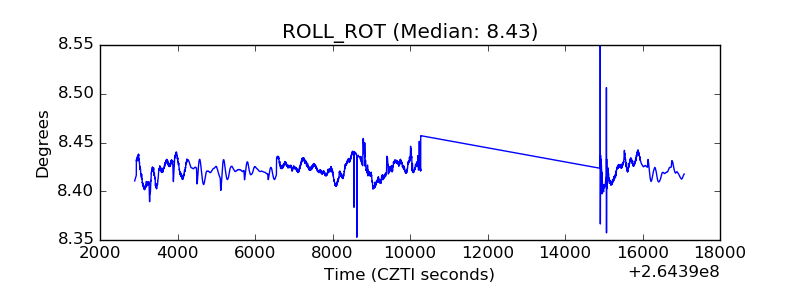 |
| _Roll_DEC | 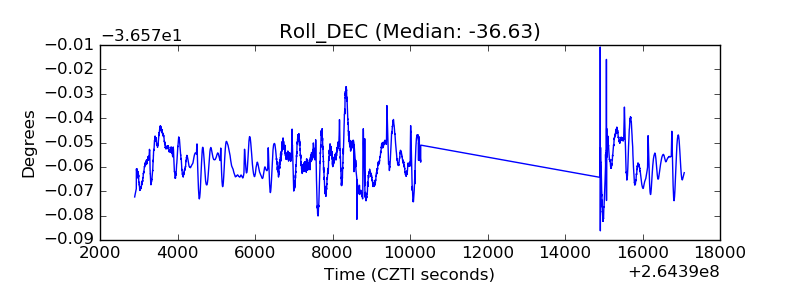 |
| _Roll_RA | 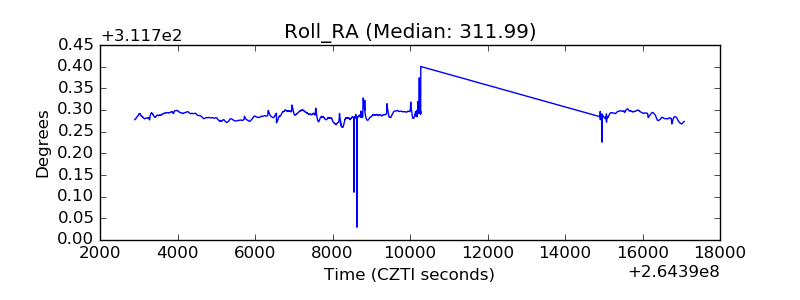 |
| Veto Counter |  |