| Param | Original file | Final file |
|---|---|---|
| Filename | modeM0/AS1G08_014T01_9000002104_14271cztM0_level2.evt | modeM0/AS1G08_014T01_9000002104_14271cztM0_level2_quad_clean.evt |
| Size (bytes) | 474,151,680 | 87,621,120 |
| Size | 452.2 MB | 83.6 MB |
| Events in quadrant A | 3,193,302 | 572,646 |
| Events in quadrant B | 3,383,797 | 573,272 |
| Events in quadrant C | 3,286,371 | 545,320 |
| Events in quadrant D | 4,084,671 | 538,505 |
| Mode M9 | |||
|---|---|---|---|
| Quadrant | BADHDUFLAG | Total packets | Discarded packets |
| A | 0 | 13 | 0 |
| B | 0 | 13 | 0 |
| C | 0 | 13 | 0 |
| D | 0 | 13 | 0 |
| Mode SS | |||
|---|---|---|---|
| Quadrant | BADHDUFLAG | Total packets | Discarded packets |
| A | 0 | 124 | 0 |
| B | 0 | 124 | 0 |
| C | 0 | 124 | 0 |
| D | 0 | 124 | 0 |
| Mode M0 | |||
|---|---|---|---|
| Quadrant | BADHDUFLAG | Total packets | Discarded packets |
| A | 0 | 13021 | 2 |
| B | 0 | 13617 | 1 |
| C | 0 | 13056 | 1 |
| D | 0 | 15991 | 1 |
| Quadrant | Total seconds | Saturated seconds | Saturation percentage |
|---|---|---|---|
| A | 6072 | 58 | 0.955204% |
| B | 6072 | 113 | 1.861001% |
| C | 6072 | 44 | 0.724638% |
| D | 6072 | 118 | 1.943347% |
Noise dominated data is calculated using 1-second bins in cleaned event files. If a bin has >2000 counts, and if more than 50% of those come from <1% of pixels, then it is considered to be noise-dominated and hence unusable.
| Quadrant | # 1 sec bins | Bins with >0 counts | Bins with >2000 counts | High rate bins dominated by noise | Noise dominated (total time) | Noise dominated (detector-on time) | Marked lightcurve |
|---|---|---|---|---|---|---|---|
| A | 7353 | 6075 | 1 | 1 | 0.01% | 0.02% | 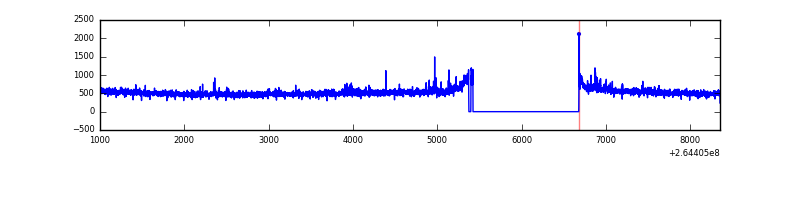 |
| B | 7353 | 6075 | 25 | 25 | 0.34% | 0.41% | 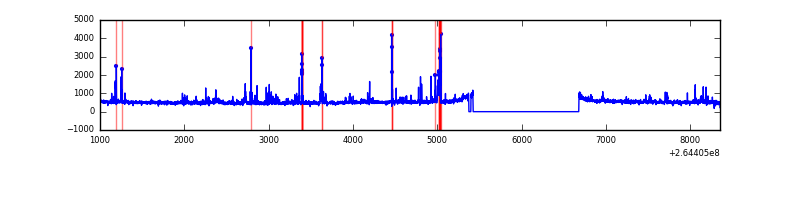 |
| C | 7353 | 6075 | 1 | 1 | 0.01% | 0.02% | 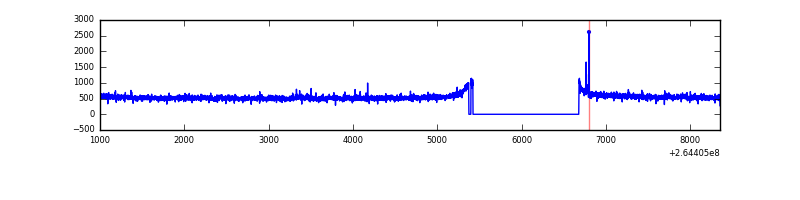 |
| D | 7353 | 6075 | 49 | 49 | 0.67% | 0.81% | 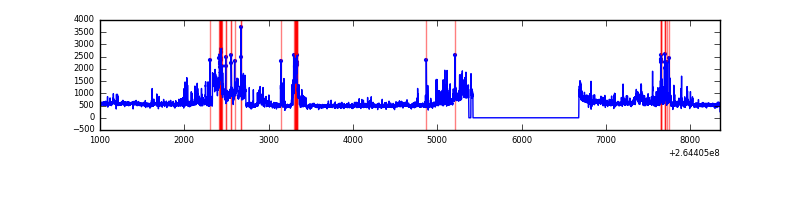 |
Top three noisy pixels from each quadrant. If the there are fewer than three noisy pixels in the level2.evt file, extra rows are filled as -1
| Pixel properties | Quadrant properties | ||||||
|---|---|---|---|---|---|---|---|
| Quadrant | DetID | PixID | Counts | Sigma | Mean | Median | Sigma |
| A | 12 | 189 | 90624 | 561.11 | 802 | 785 | 160.1 |
| A | 3 | 1 | 7502 | 41.95 | 802 | 785 | 160.1 |
| A | 0 | 226 | 7484 | 41.84 | 802 | 785 | 160.1 |
| B | 0 | 229 | 221932 | 1490.23 | 786 | 767 | 148.4 |
| B | 10 | 244 | 31372 | 206.22 | 786 | 767 | 148.4 |
| B | 0 | 189 | 24901 | 162.62 | 786 | 767 | 148.4 |
| C | 3 | 233 | 282610 | 1605.53 | 768 | 775 | 175.5 |
| C | 10 | 22 | 12181 | 64.98 | 768 | 775 | 175.5 |
| C | 13 | 61 | 5560 | 27.26 | 768 | 775 | 175.5 |
| D | 12 | 110 | 357817 | 1952.5 | 777 | 759 | 182.9 |
| D | 10 | 199 | 213154 | 1161.44 | 777 | 759 | 182.9 |
| D | 8 | 195 | 204301 | 1113.03 | 777 | 759 | 182.9 |
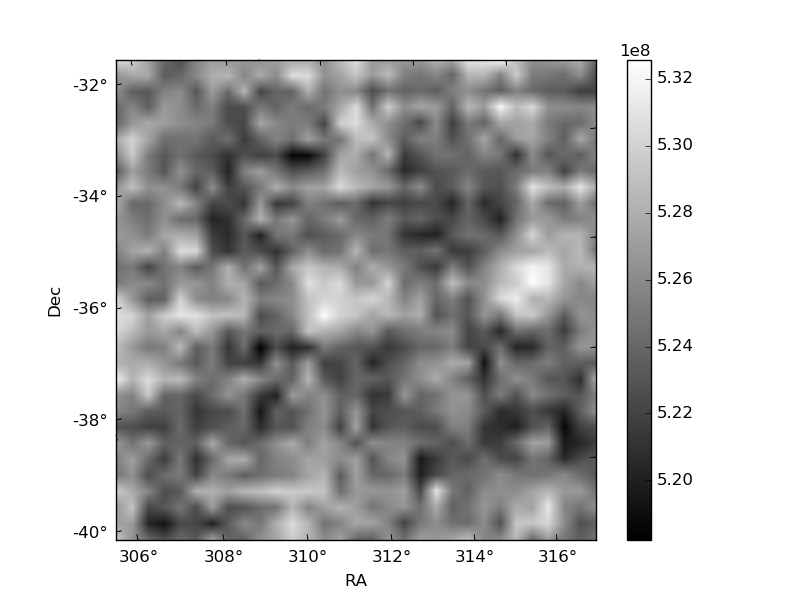
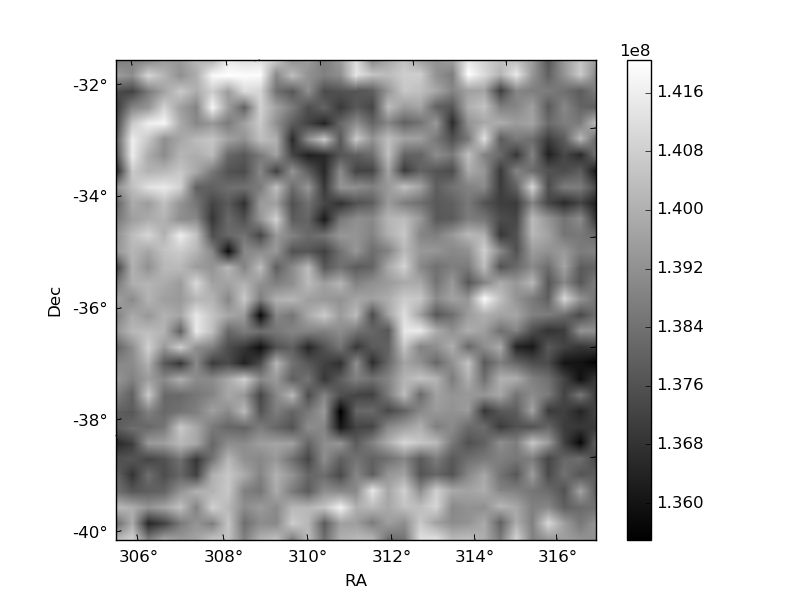
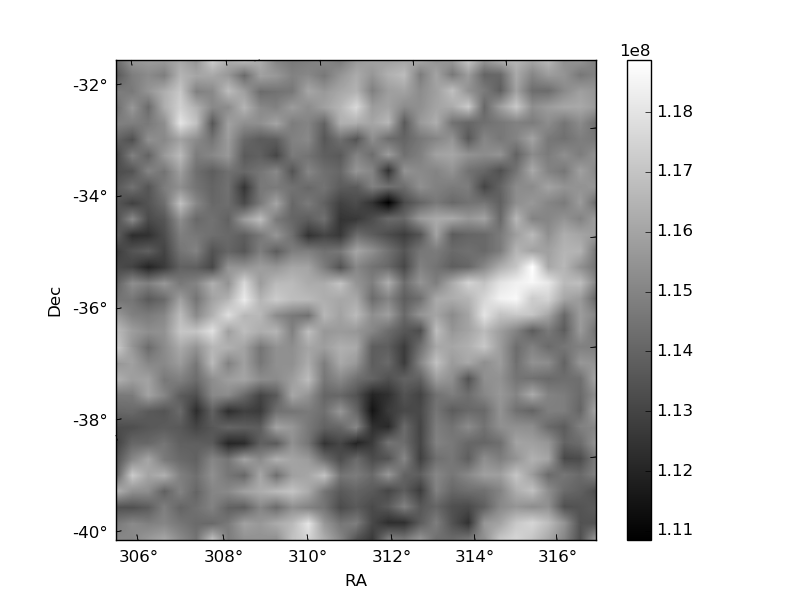
Histogram calculated using DETX and DETY for each event in the final _common_clean file
| Quadrant A | 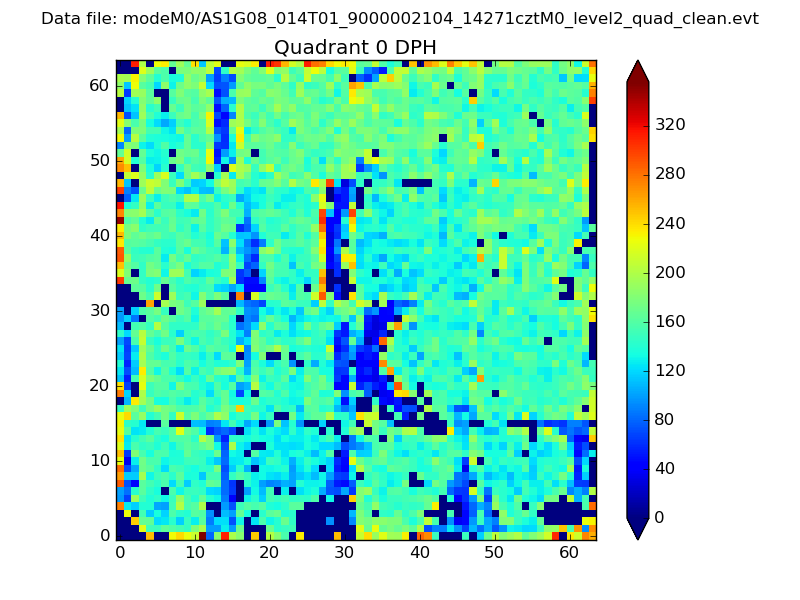 |
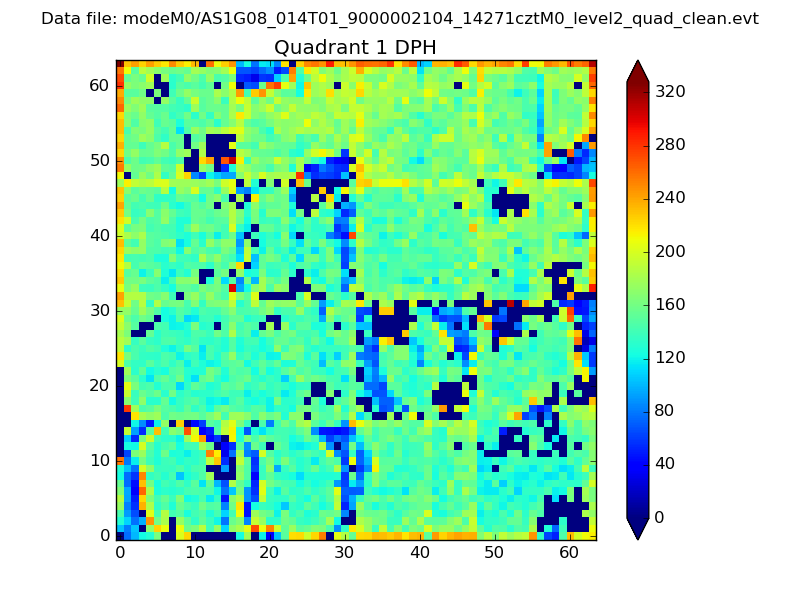 |
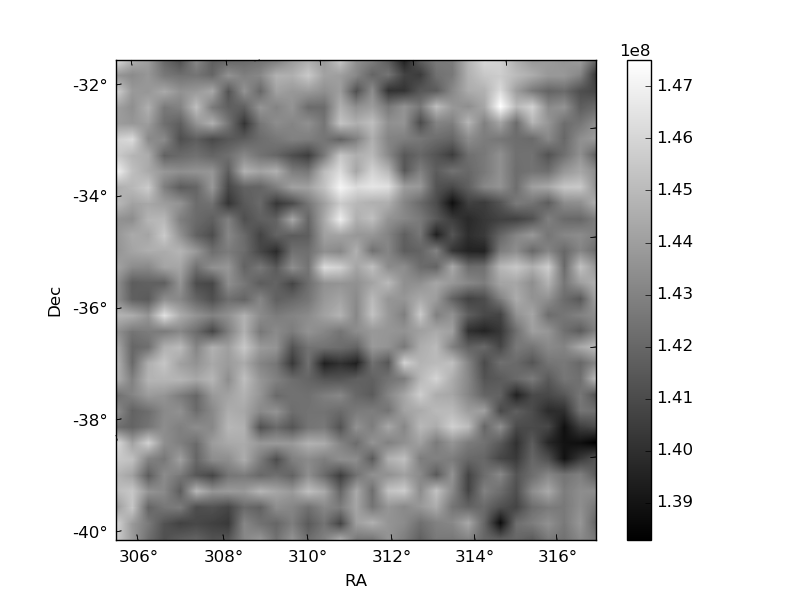
Quadrant B |
|---|---|---|---|
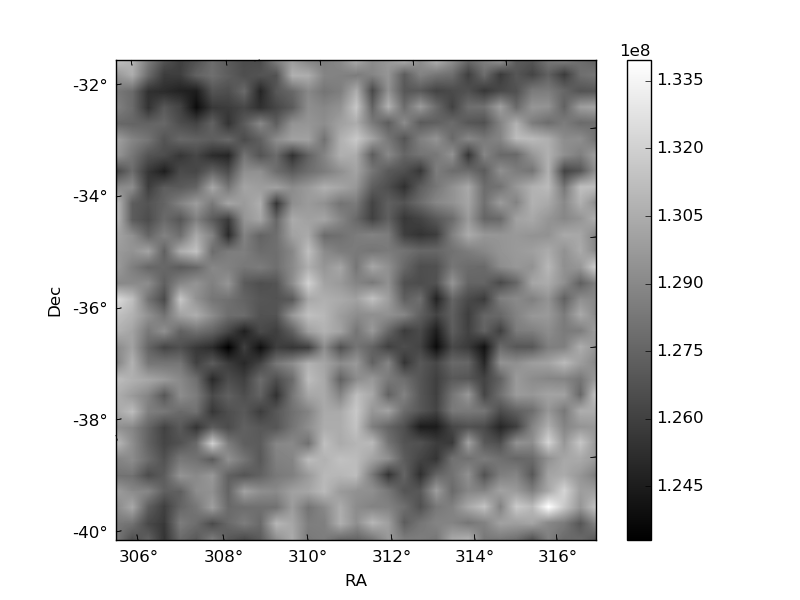
| Quadrant D | 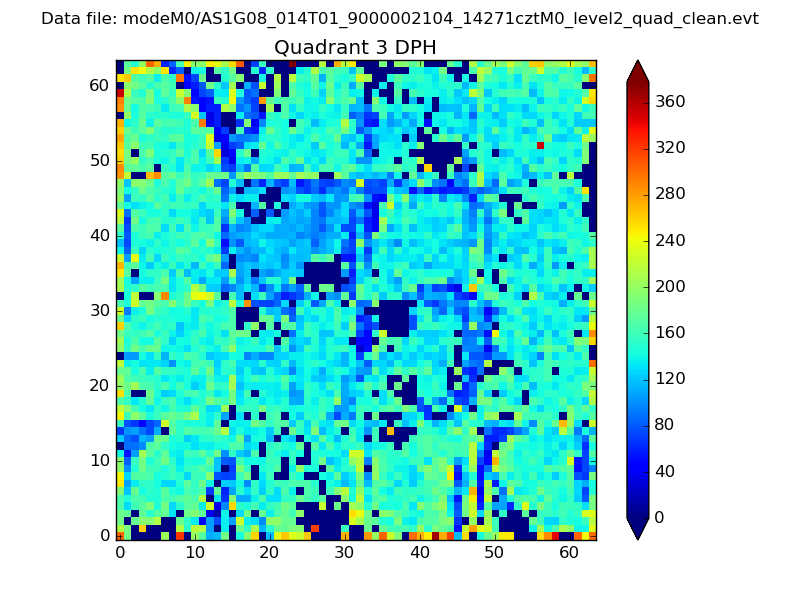 |
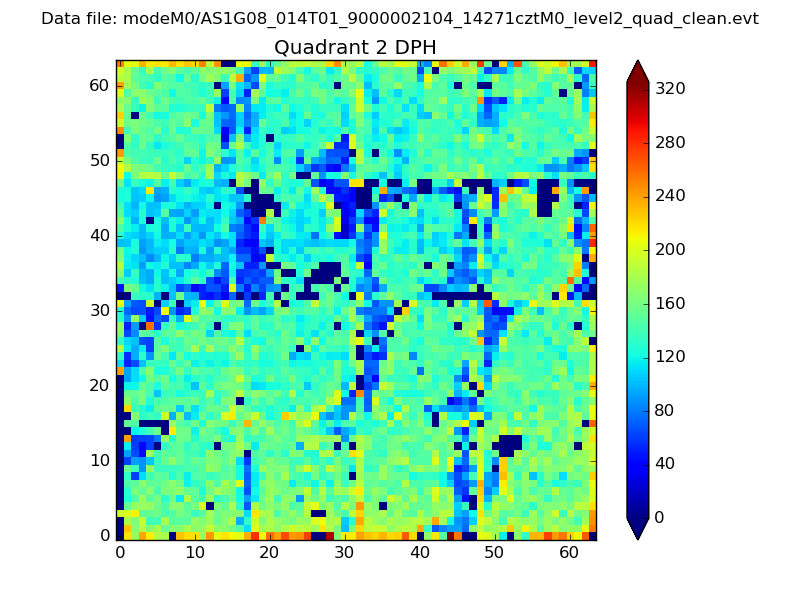 |
Quadrant C |
| Plot type | Count rate plots | Images |
|---|---|---|
| Comparison with Poisson distribution Blue bars denote a histogram of data divided into 1 sec bins. Red curve is a Poisson curve with rate = median count rate of data. |
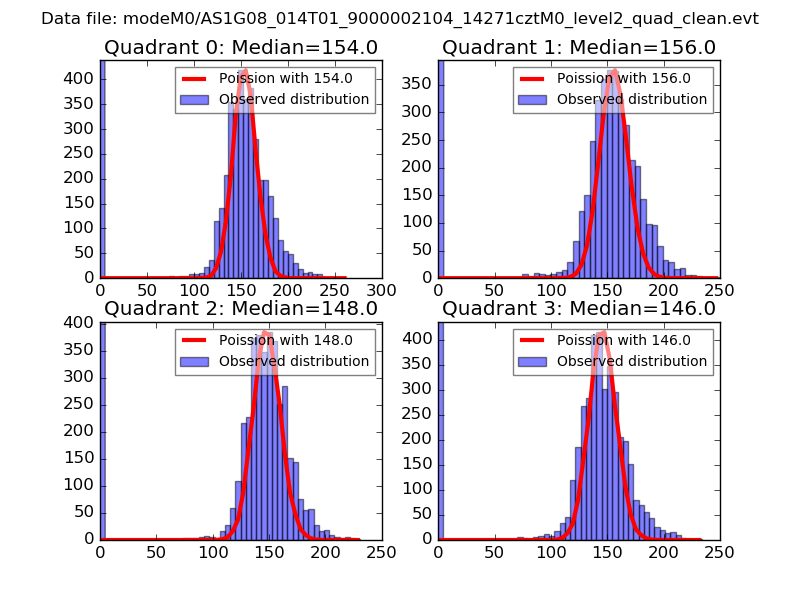 |
 |
| Quadrant-wise count rates Data is divided into 100 sec bins |
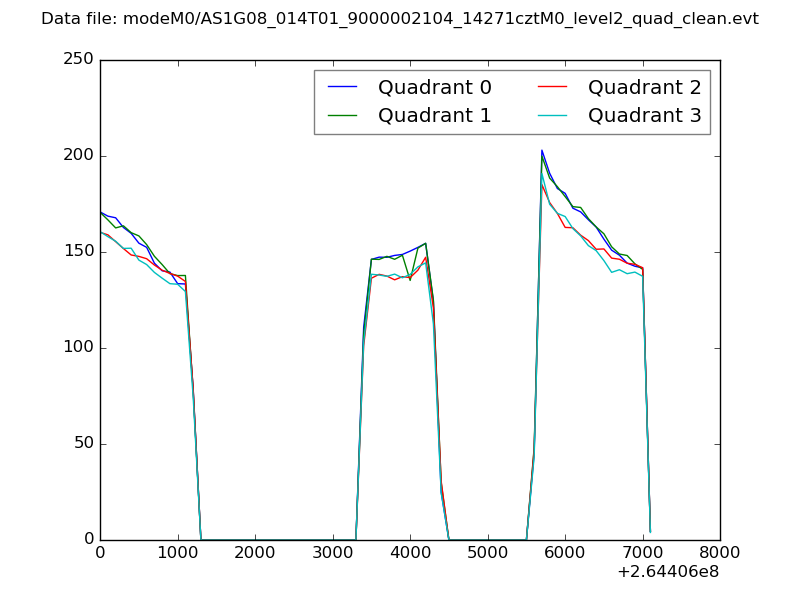 |
|
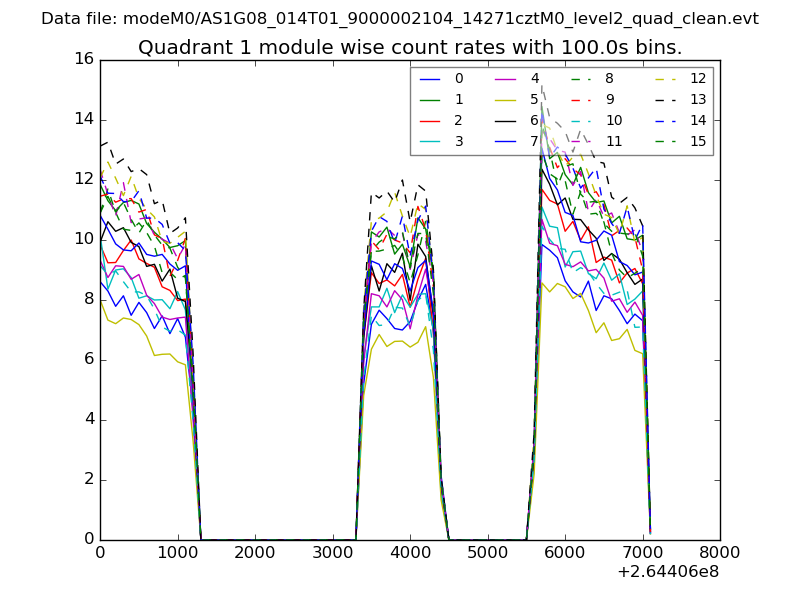
| Module-wise count rates for Quadrant A Data is divided into 100 sec bins |
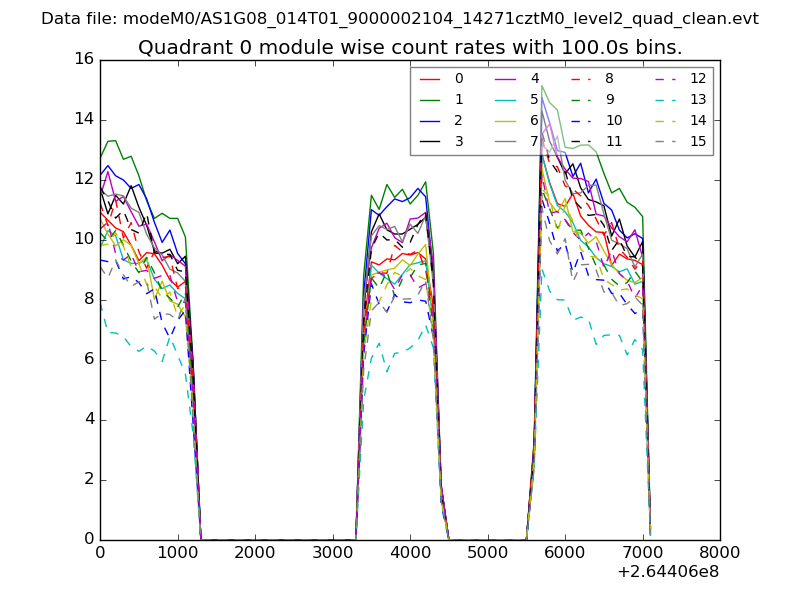 |
 |
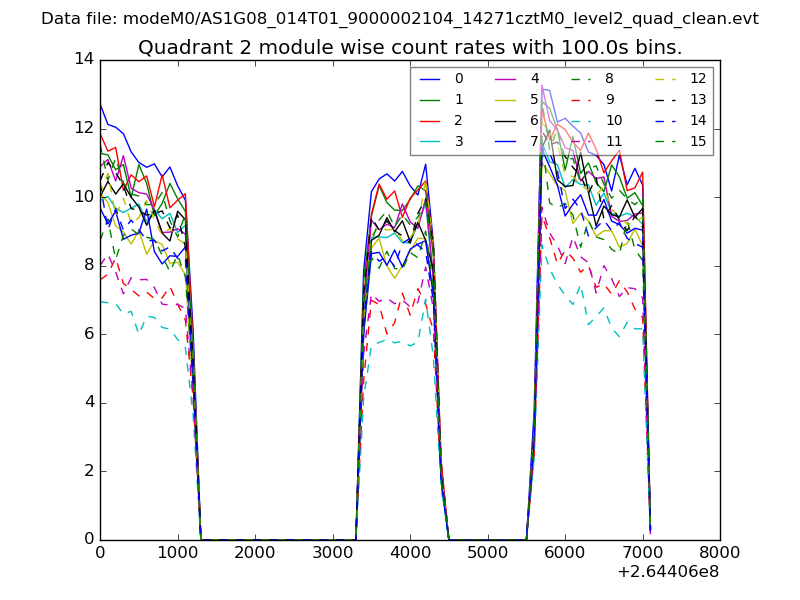
| Module-wise count rates for Quadrant B Data is divided into 100 sec bins |
 |
 |
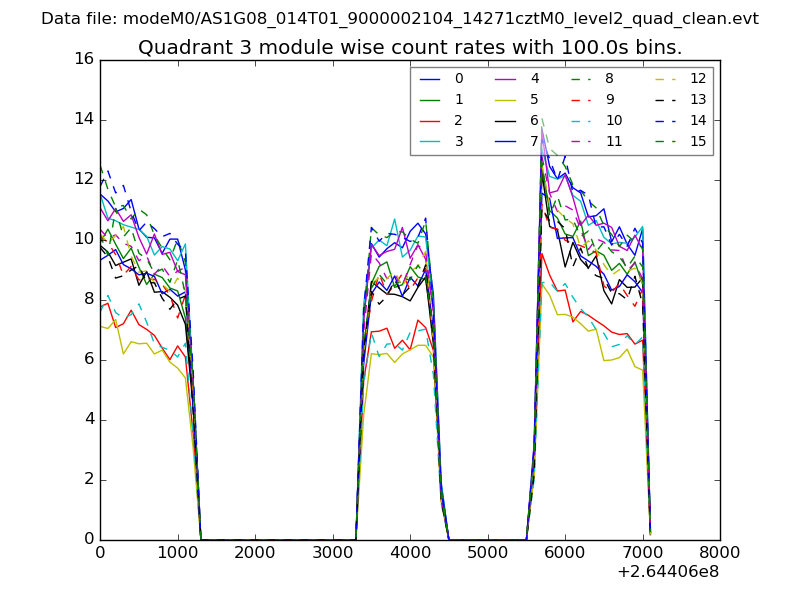
| Module-wise count rates for Quadrant C Data is divided into 100 sec bins |
 |
 |
| Module-wise count rates for Quadrant D Data is divided into 100 sec bins |
 |
 |
| Parameter | Plot |
|---|---|
| CZT HV Monitor | 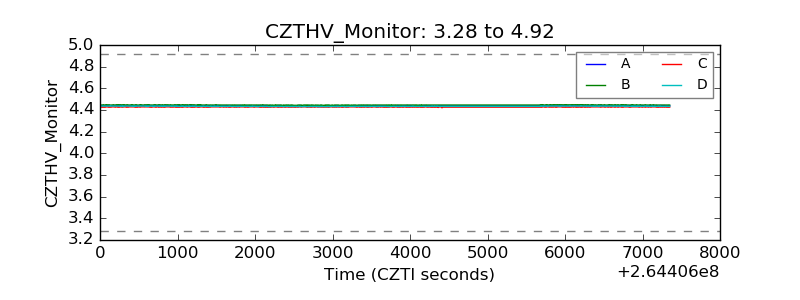 |
| D_VDD | 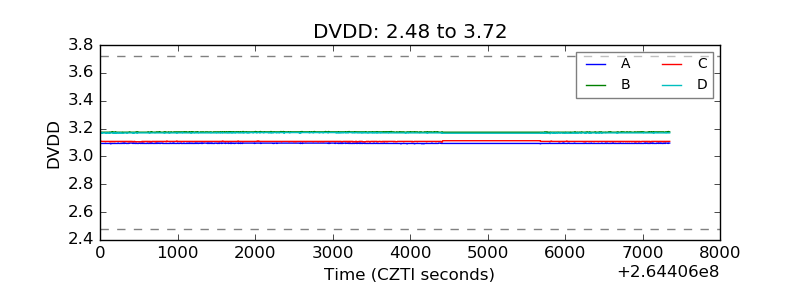 |
| Temperature 1 | 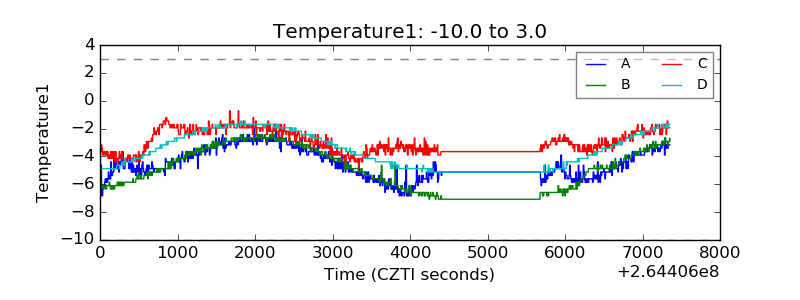 |
| Veto HV Monitor | 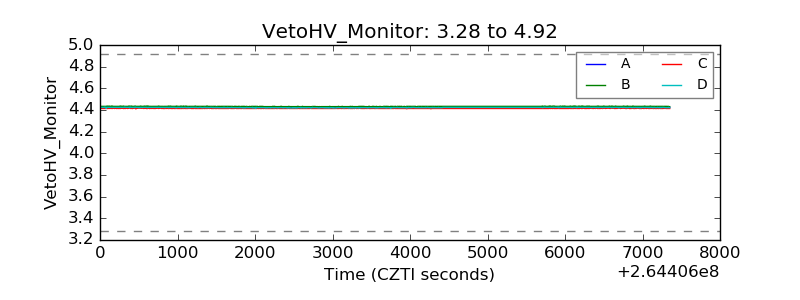 |
| Veto LLD | 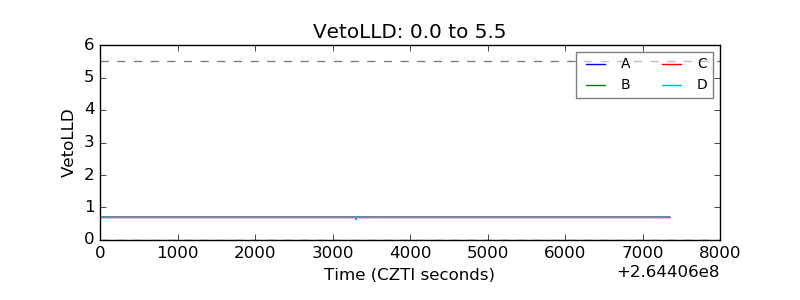 |
| Alpha Counter | 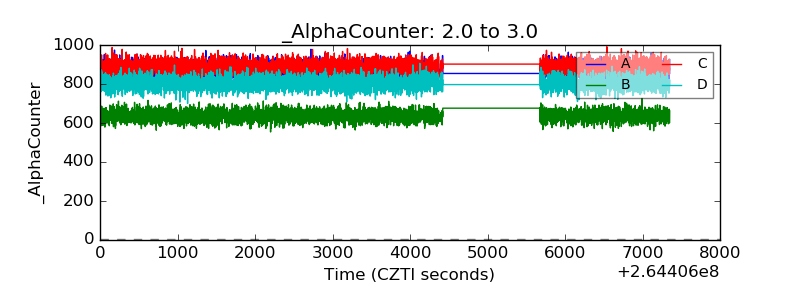 |
| _CPM_Rate | 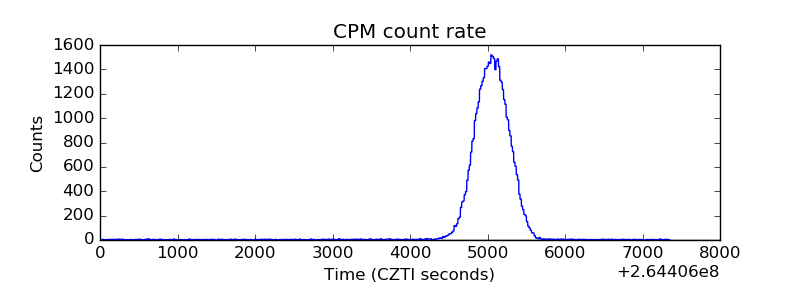 |
| CZT Counter | 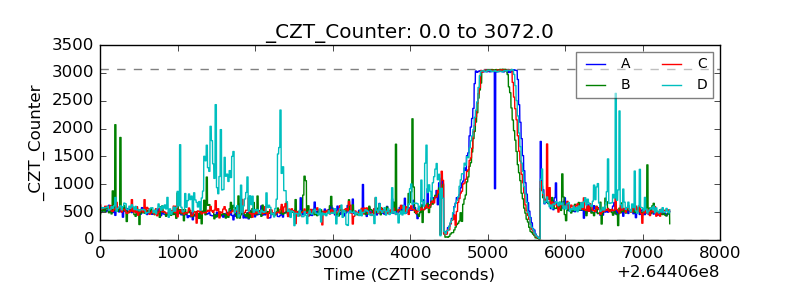 |
| +2.5 Volts monitor |  |
| +5 Volts monitor |  |
| _ROLL_ROT | 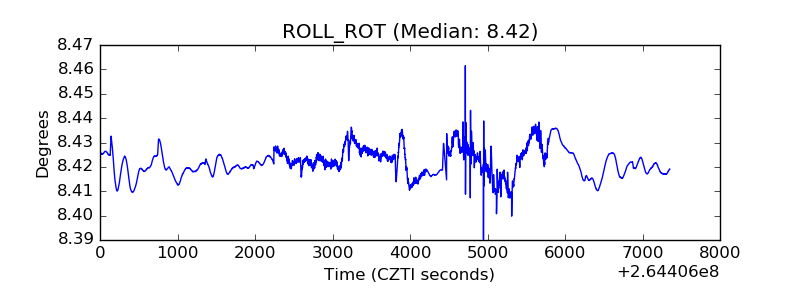 |
| _Roll_DEC | 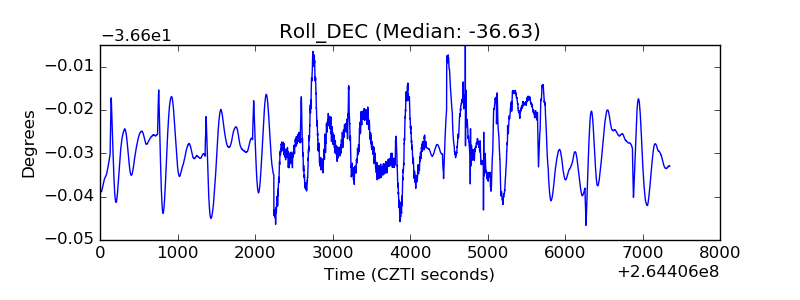 |
| _Roll_RA |  |
| Veto Counter |  |