| Param | Original file | Final file |
|---|---|---|
| Filename | modeM0/AS1G08_014T01_9000002104_14273cztM0_level2.evt | modeM0/AS1G08_014T01_9000002104_14273cztM0_level2_quad_clean.evt |
| Size (bytes) | 527,094,720 | 82,719,360 |
| Size | 502.7 MB | 78.9 MB |
| Events in quadrant A | 3,443,978 | 527,284 |
| Events in quadrant B | 3,838,988 | 522,296 |
| Events in quadrant C | 3,471,763 | 500,604 |
| Events in quadrant D | 4,755,460 | 488,934 |
| Mode M9 | |||
|---|---|---|---|
| Quadrant | BADHDUFLAG | Total packets | Discarded packets |
| A | 0 | 11 | 0 |
| B | 0 | 11 | 0 |
| C | 0 | 11 | 0 |
| D | 0 | 11 | 0 |
| Mode SS | |||
|---|---|---|---|
| Quadrant | BADHDUFLAG | Total packets | Discarded packets |
| A | 0 | 136 | 0 |
| B | 0 | 136 | 0 |
| C | 0 | 136 | 0 |
| D | 0 | 136 | 0 |
| Mode M0 | |||
|---|---|---|---|
| Quadrant | BADHDUFLAG | Total packets | Discarded packets |
| A | 0 | 14129 | 3 |
| B | 0 | 15426 | 2 |
| C | 0 | 14045 | 2 |
| D | 0 | 18448 | 2 |
| Quadrant | Total seconds | Saturated seconds | Saturation percentage |
|---|---|---|---|
| A | 6676 | 133 | 1.992211% |
| B | 6676 | 235 | 3.520072% |
| C | 6676 | 96 | 1.437987% |
| D | 6676 | 256 | 3.834632% |
Noise dominated data is calculated using 1-second bins in cleaned event files. If a bin has >2000 counts, and if more than 50% of those come from <1% of pixels, then it is considered to be noise-dominated and hence unusable.
| Quadrant | # 1 sec bins | Bins with >0 counts | Bins with >2000 counts | High rate bins dominated by noise | Noise dominated (total time) | Noise dominated (detector-on time) | Marked lightcurve |
|---|---|---|---|---|---|---|---|
| A | 7747 | 6677 | 0 | 0 | 0.00% | 0.00% | 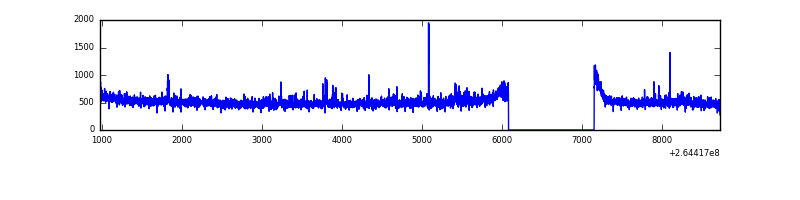 |
| B | 7747 | 6677 | 49 | 49 | 0.63% | 0.73% | 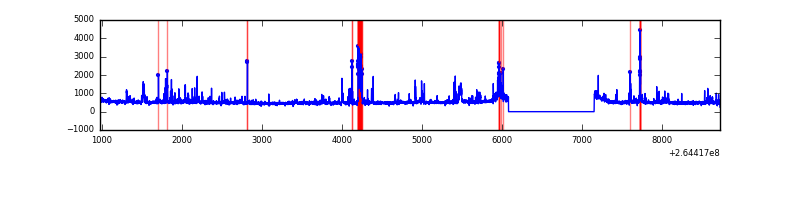 |
| C | 7747 | 6678 | 0 | 0 | 0.00% | 0.00% | 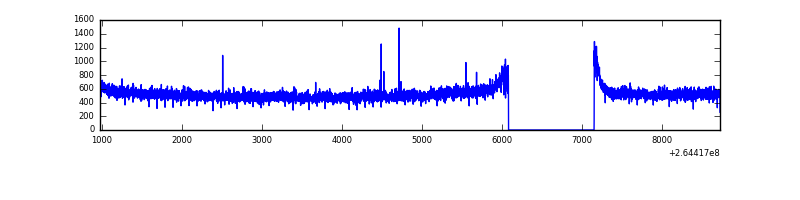 |
| D | 7747 | 6678 | 96 | 96 | 1.24% | 1.44% | 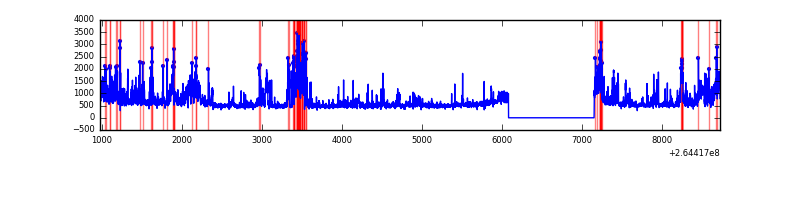 |
Top three noisy pixels from each quadrant. If the there are fewer than three noisy pixels in the level2.evt file, extra rows are filled as -1
| Pixel properties | Quadrant properties | ||||||
|---|---|---|---|---|---|---|---|
| Quadrant | DetID | PixID | Counts | Sigma | Mean | Median | Sigma |
| A | 12 | 189 | 91388 | 522.17 | 865 | 847 | 173.4 |
| A | 15 | 222 | 12851 | 69.23 | 865 | 847 | 173.4 |
| A | 8 | 15 | 12091 | 64.85 | 865 | 847 | 173.4 |
| B | 0 | 229 | 334583 | 2067.28 | 845 | 825 | 161.4 |
| B | 10 | 245 | 125376 | 771.46 | 845 | 825 | 161.4 |
| B | 0 | 189 | 27164 | 163.14 | 845 | 825 | 161.4 |
| C | 3 | 233 | 258427 | 1358.68 | 824 | 831 | 189.6 |
| C | 13 | 61 | 5715 | 25.76 | 824 | 831 | 189.6 |
| C | 3 | 202 | 1932 | 5.81 | 824 | 831 | 189.6 |
| D | 5 | 222 | 639105 | 3276.54 | 827 | 808 | 194.8 |
| D | 10 | 199 | 269946 | 1381.55 | 827 | 808 | 194.8 |
| D | 13 | 122 | 269766 | 1380.63 | 827 | 808 | 194.8 |
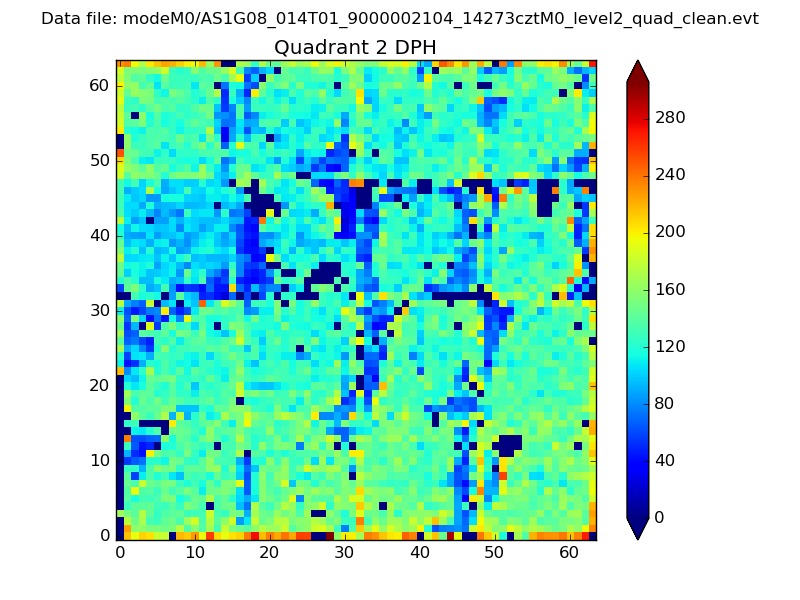
Histogram calculated using DETX and DETY for each event in the final _common_clean file
| Quadrant A | 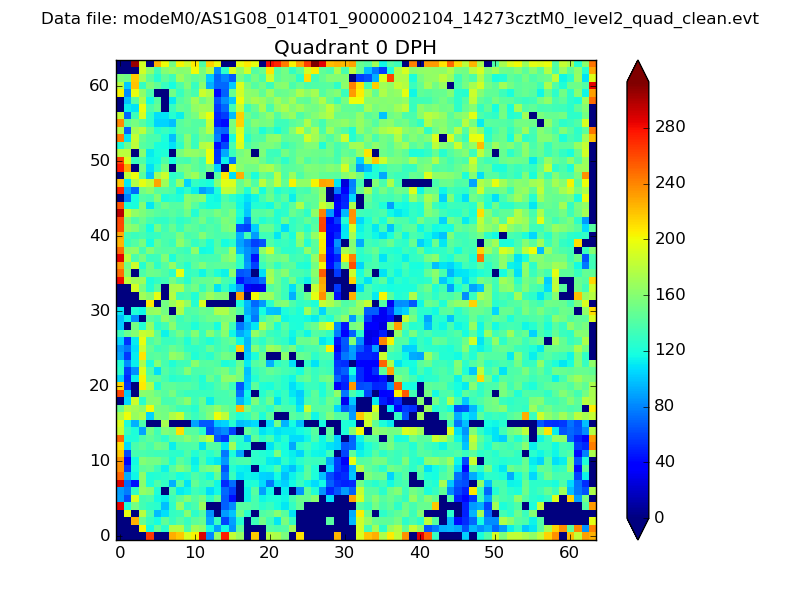 |
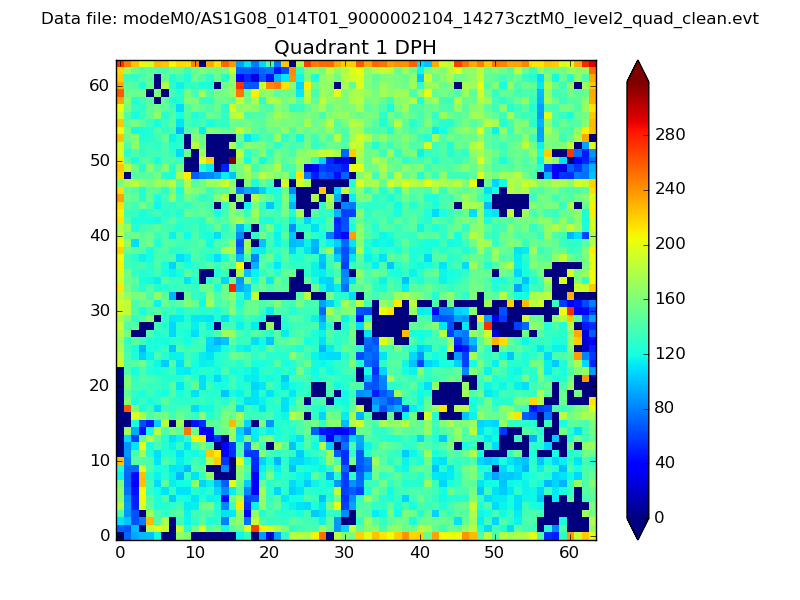 |
Quadrant B |
|---|---|---|---|
| Quadrant D | 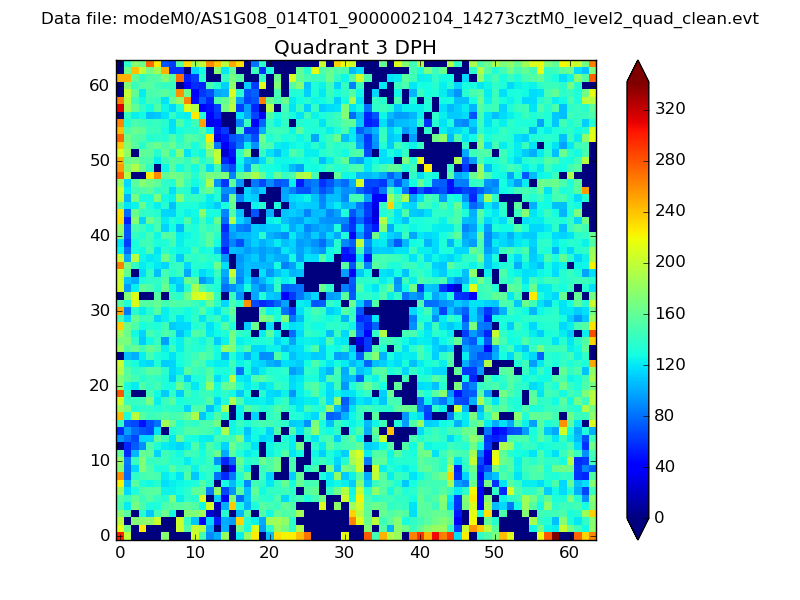 |
 |
Quadrant C |
| Plot type | Count rate plots | Images |
|---|---|---|
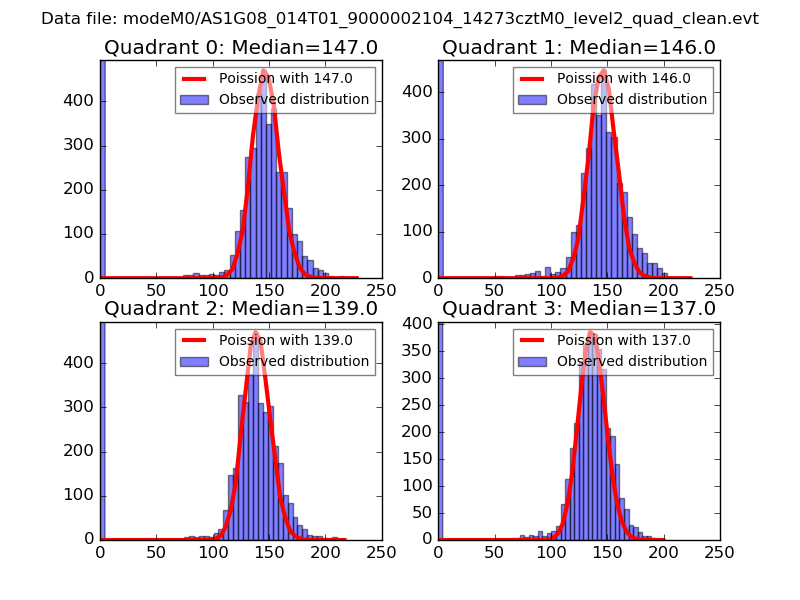
| Comparison with Poisson distribution Blue bars denote a histogram of data divided into 1 sec bins. Red curve is a Poisson curve with rate = median count rate of data. |
 |
 |
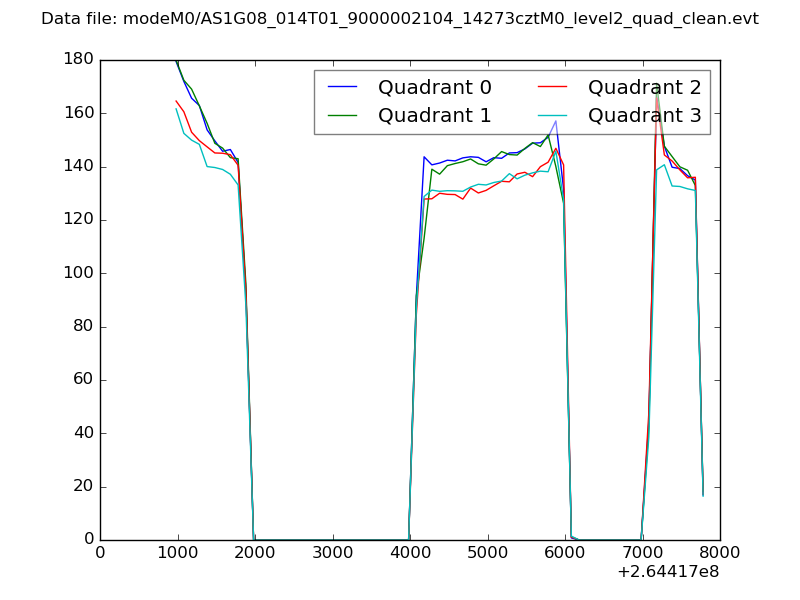
| Quadrant-wise count rates Data is divided into 100 sec bins |
 |
|
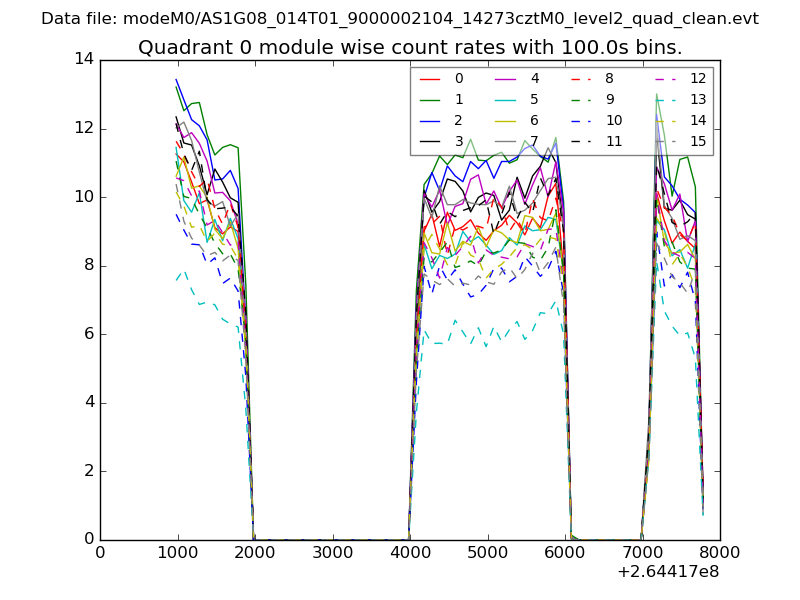
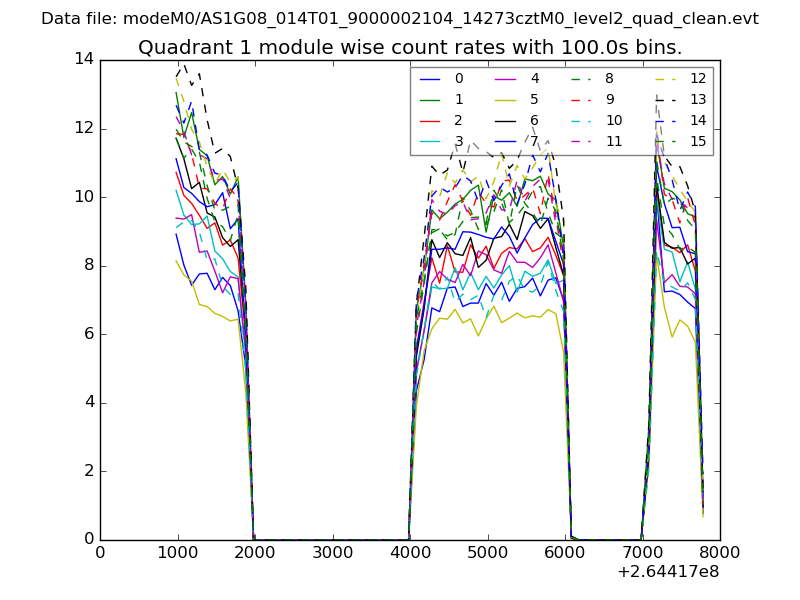
| Module-wise count rates for Quadrant A Data is divided into 100 sec bins |
 |
 |
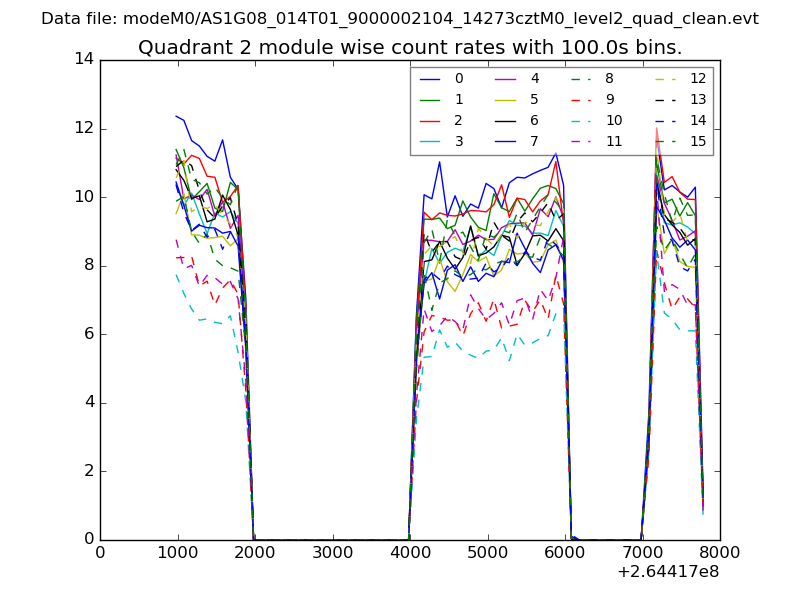
| Module-wise count rates for Quadrant B Data is divided into 100 sec bins |
 |
 |
| Module-wise count rates for Quadrant C Data is divided into 100 sec bins |
 |
 |
| Module-wise count rates for Quadrant D Data is divided into 100 sec bins |
 |
 |
| Parameter | Plot |
|---|---|
| CZT HV Monitor | 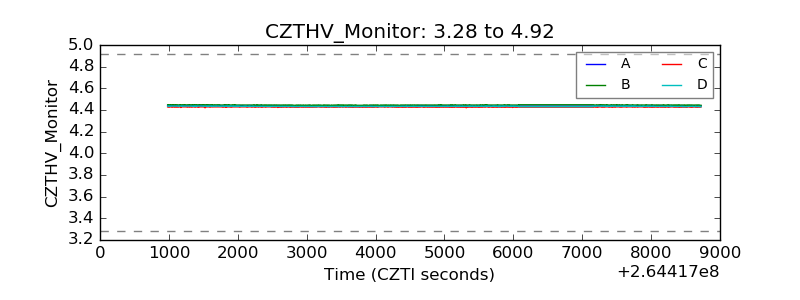 |
| D_VDD | 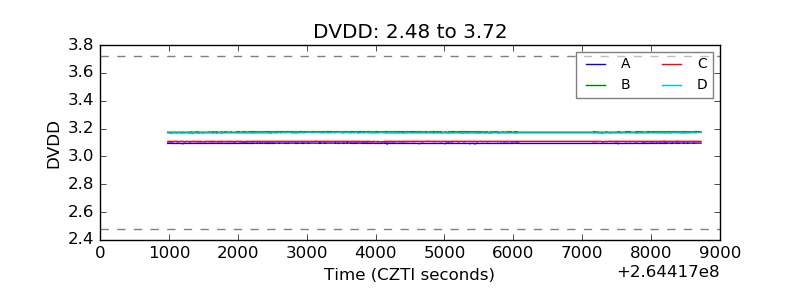 |
| Temperature 1 | 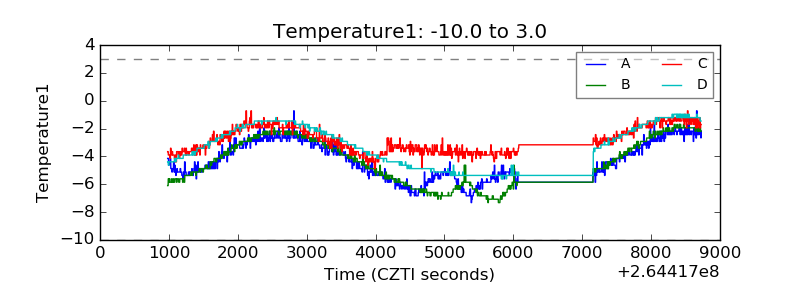 |
| Veto HV Monitor | 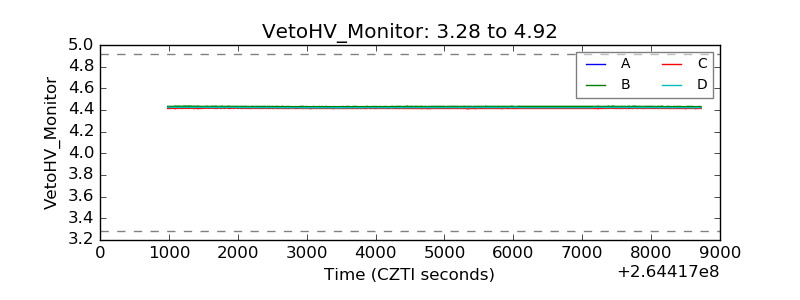 |
| Veto LLD | 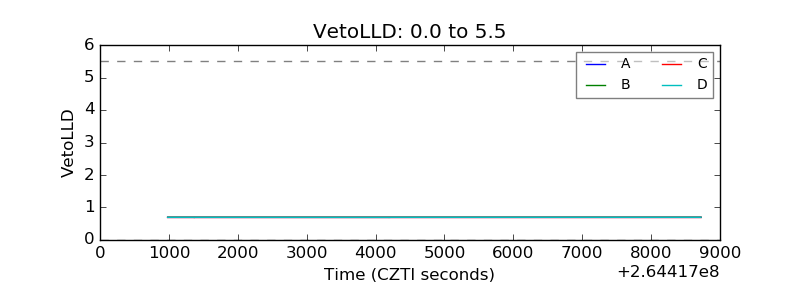 |
| Alpha Counter | 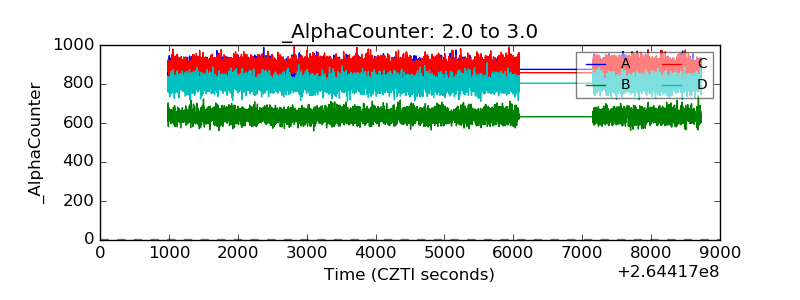 |
| _CPM_Rate | 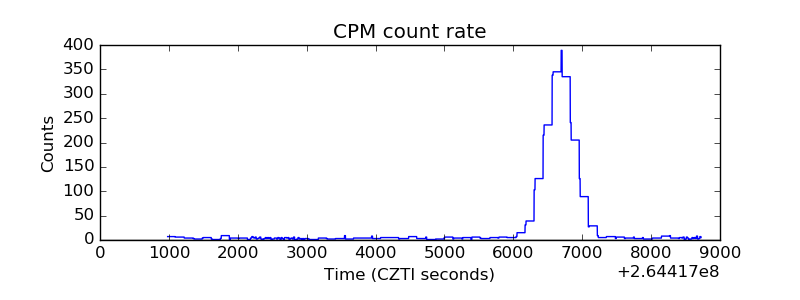 |
| CZT Counter |  |
| +2.5 Volts monitor |  |
| +5 Volts monitor |  |
| _ROLL_ROT |  |
| _Roll_DEC |  |
| _Roll_RA |  |
| Veto Counter | 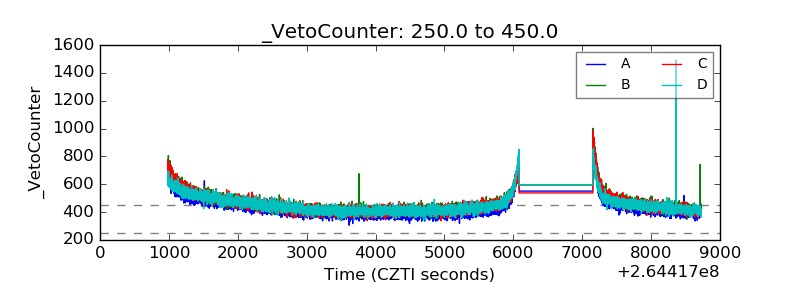 |