| Param | Original file | Final file |
|---|---|---|
| Filename | modeM0/AS1G08_014T01_9000002104_14274cztM0_level2.evt | modeM0/AS1G08_014T01_9000002104_14274cztM0_level2_quad_clean.evt |
| Size (bytes) | 2,436,935,040 | 383,189,760 |
| Size | 2.3 GB | 365.4 MB |
| Events in quadrant A | 15,962,492 | 2,456,492 |
| Events in quadrant B | 17,219,165 | 2,444,875 |
| Events in quadrant C | 16,241,604 | 2,335,744 |
| Events in quadrant D | 22,290,270 | 2,237,865 |
| Mode M9 | |||
|---|---|---|---|
| Quadrant | BADHDUFLAG | Total packets | Discarded packets |
| A | 0 | 69 | 0 |
| B | 0 | 69 | 0 |
| C | 0 | 69 | 0 |
| D | 0 | 69 | 0 |
| Mode SS | |||
|---|---|---|---|
| Quadrant | BADHDUFLAG | Total packets | Discarded packets |
| A | 0 | 632 | 0 |
| B | 0 | 632 | 0 |
| C | 0 | 632 | 0 |
| D | 0 | 632 | 0 |
| Mode M0 | |||
|---|---|---|---|
| Quadrant | BADHDUFLAG | Total packets | Discarded packets |
| A | 0 | 66016 | 7 |
| B | 0 | 69941 | 6 |
| C | 0 | 65715 | 6 |
| D | 0 | 86010 | 6 |
| Quadrant | Total seconds | Saturated seconds | Saturation percentage |
|---|---|---|---|
| A | 31006 | 504 | 1.625492% |
| B | 31006 | 801 | 2.583371% |
| C | 31006 | 372 | 1.199768% |
| D | 31006 | 1629 | 5.253822% |
Noise dominated data is calculated using 1-second bins in cleaned event files. If a bin has >2000 counts, and if more than 50% of those come from <1% of pixels, then it is considered to be noise-dominated and hence unusable.
| Quadrant | # 1 sec bins | Bins with >0 counts | Bins with >2000 counts | High rate bins dominated by noise | Noise dominated (total time) | Noise dominated (detector-on time) | Marked lightcurve |
|---|---|---|---|---|---|---|---|
| A | 37802 | 31011 | 12 | 12 | 0.03% | 0.04% | 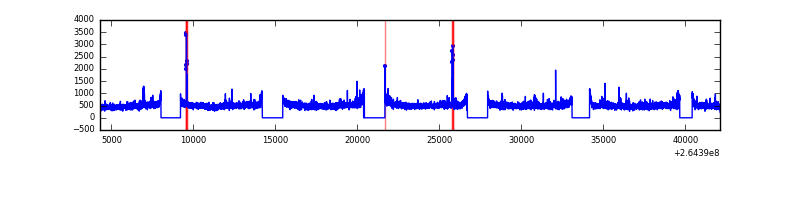 |
| B | 37802 | 31012 | 170 | 170 | 0.45% | 0.55% | 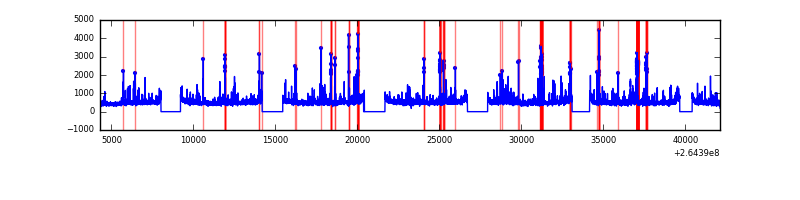 |
| C | 37802 | 31013 | 3 | 3 | 0.01% | 0.01% | 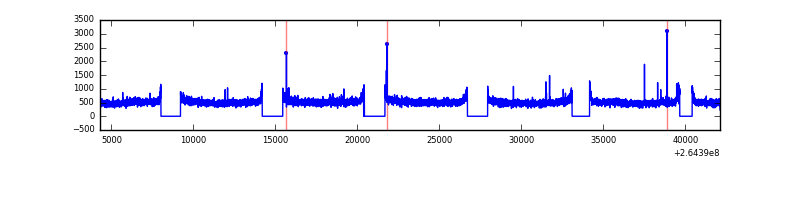 |
| D | 37802 | 31013 | 956 | 956 | 2.53% | 3.08% | 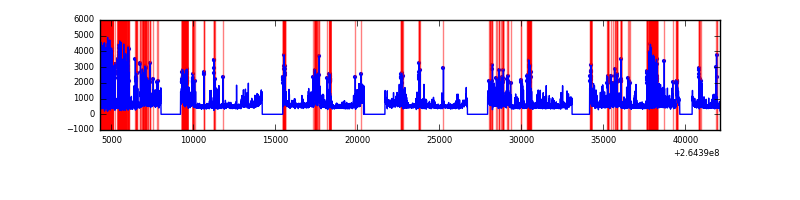 |
Top three noisy pixels from each quadrant. If the there are fewer than three noisy pixels in the level2.evt file, extra rows are filled as -1
| Pixel properties | Quadrant properties | ||||||
|---|---|---|---|---|---|---|---|
| Quadrant | DetID | PixID | Counts | Sigma | Mean | Median | Sigma |
| A | 12 | 189 | 450832 | 564.3 | 3991 | 3909 | 792.0 |
| A | 8 | 15 | 45906 | 53.03 | 3991 | 3909 | 792.0 |
| A | 9 | 143 | 40990 | 46.82 | 3991 | 3909 | 792.0 |
| B | 0 | 229 | 1119170 | 1521.2 | 3917 | 3822 | 733.2 |
| B | 10 | 245 | 254792 | 342.29 | 3917 | 3822 | 733.2 |
| B | 3 | 209 | 186419 | 249.04 | 3917 | 3822 | 733.2 |
| C | 3 | 233 | 1318932 | 1509.7 | 3821 | 3847 | 871.1 |
| C | 13 | 61 | 27152 | 26.75 | 3821 | 3847 | 871.1 |
| C | 14 | 234 | 18764 | 17.12 | 3821 | 3847 | 871.1 |
| D | 5 | 222 | 3757060 | 4197.93 | 3806 | 3719 | 894.1 |
| D | 12 | 110 | 1274642 | 1421.47 | 3806 | 3719 | 894.1 |
| D | 8 | 195 | 1034833 | 1153.25 | 3806 | 3719 | 894.1 |
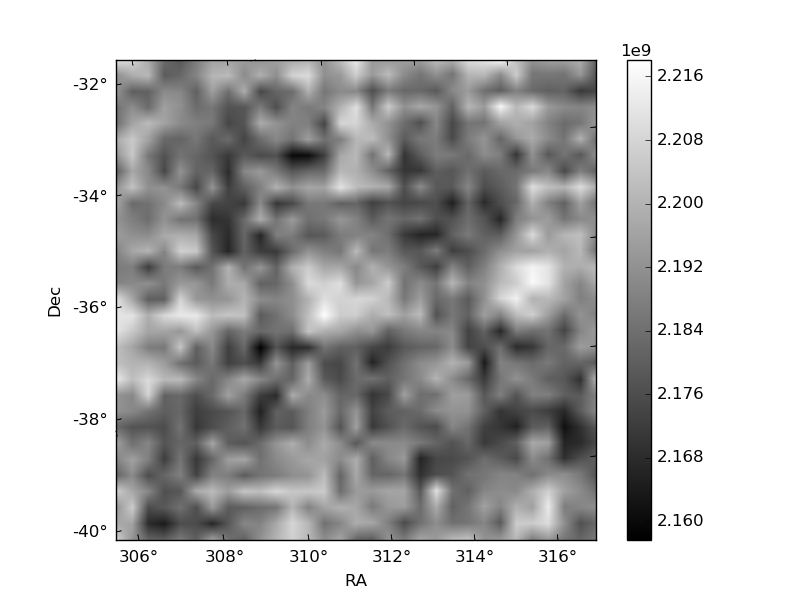
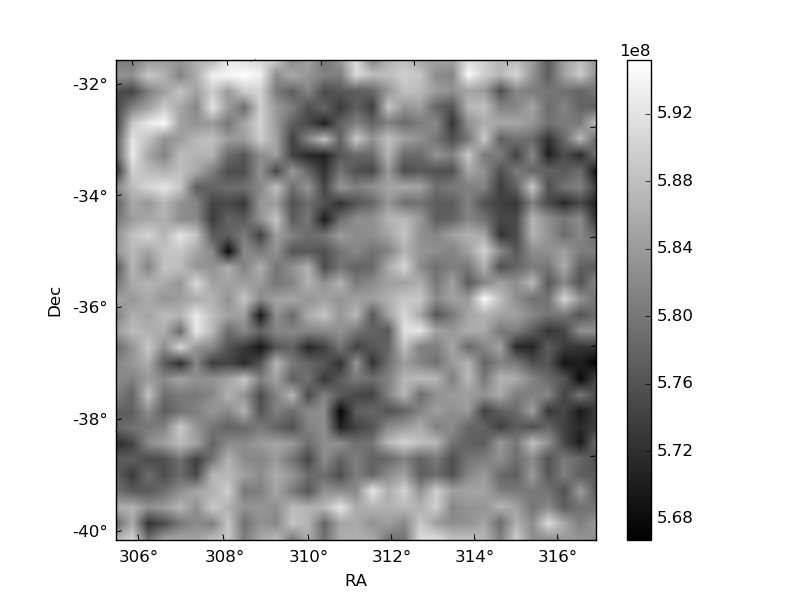
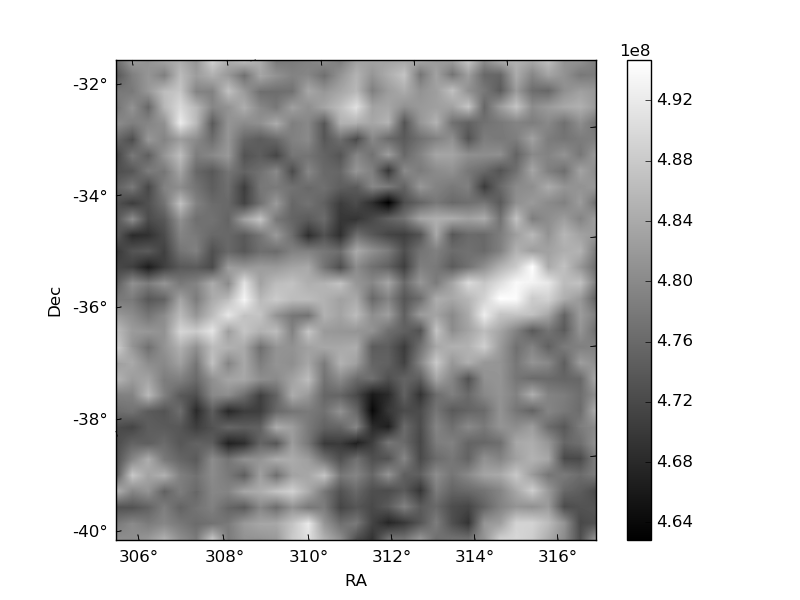
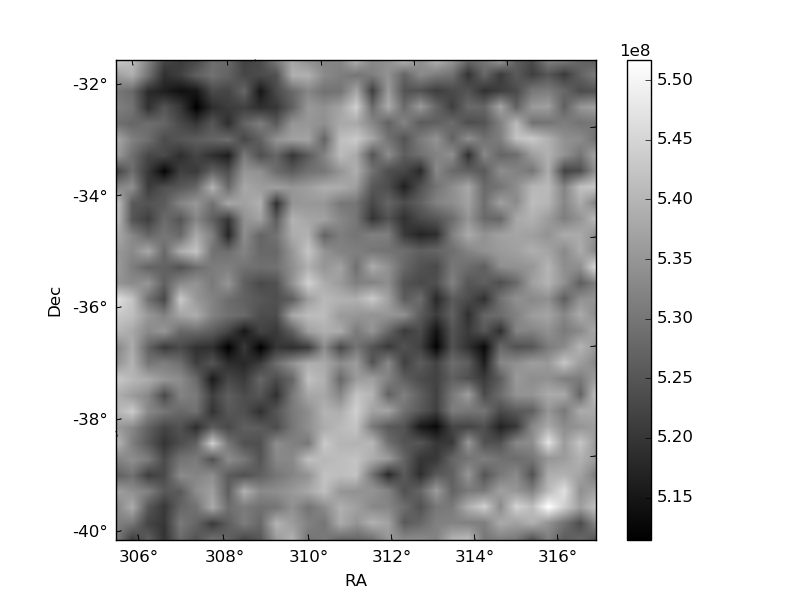
Histogram calculated using DETX and DETY for each event in the final _common_clean file
| Quadrant A | 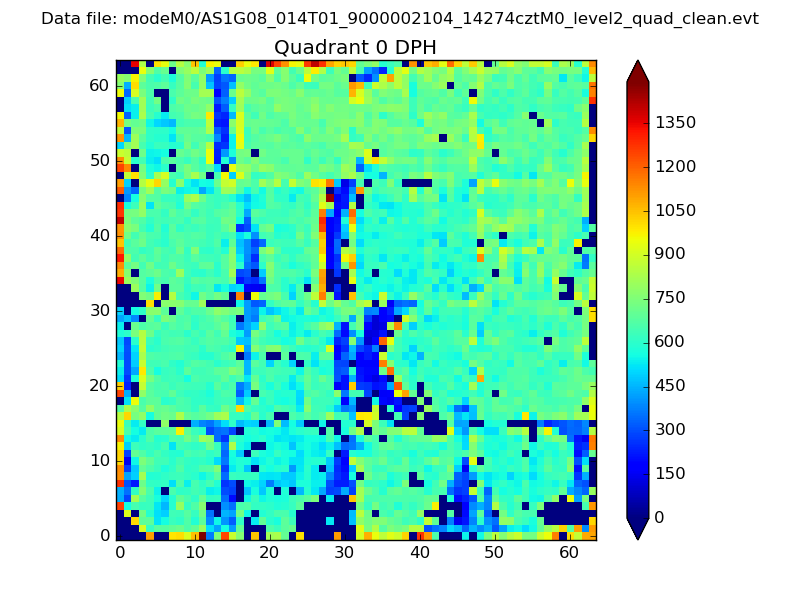 |
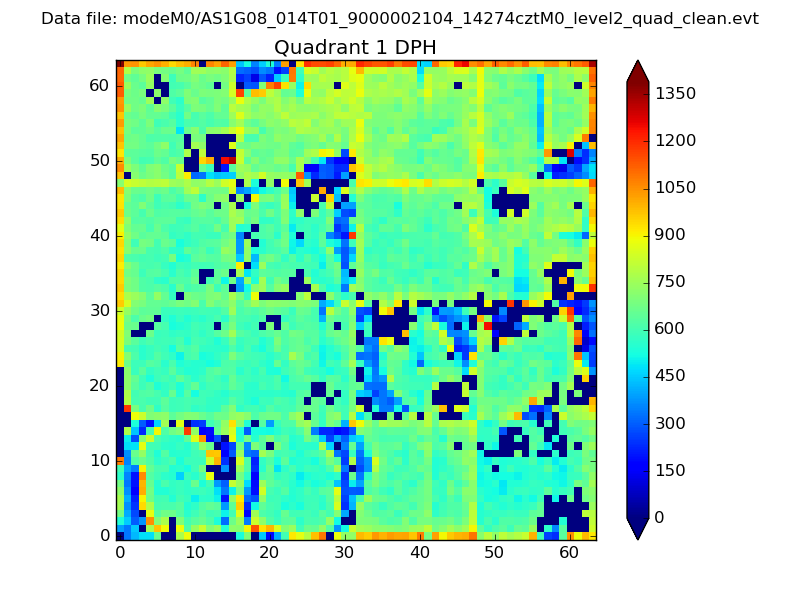 |
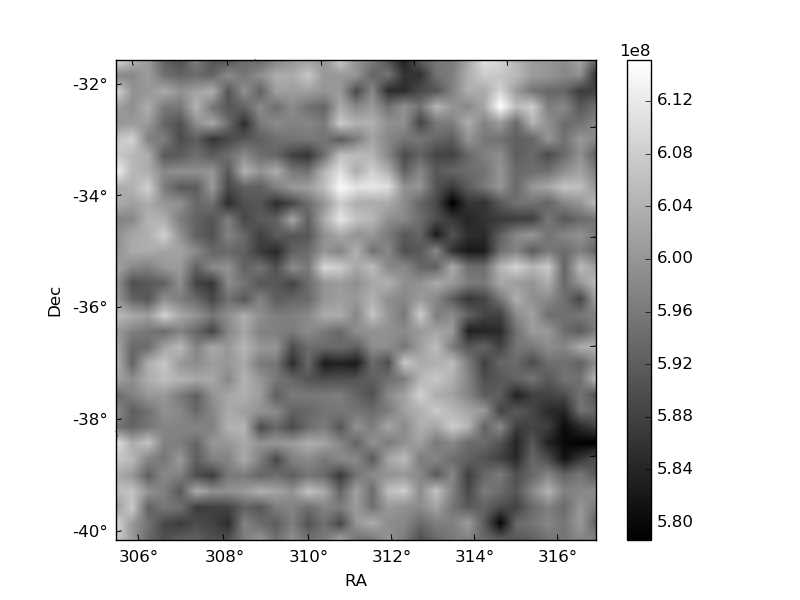
Quadrant B |
|---|---|---|---|
| Quadrant D | 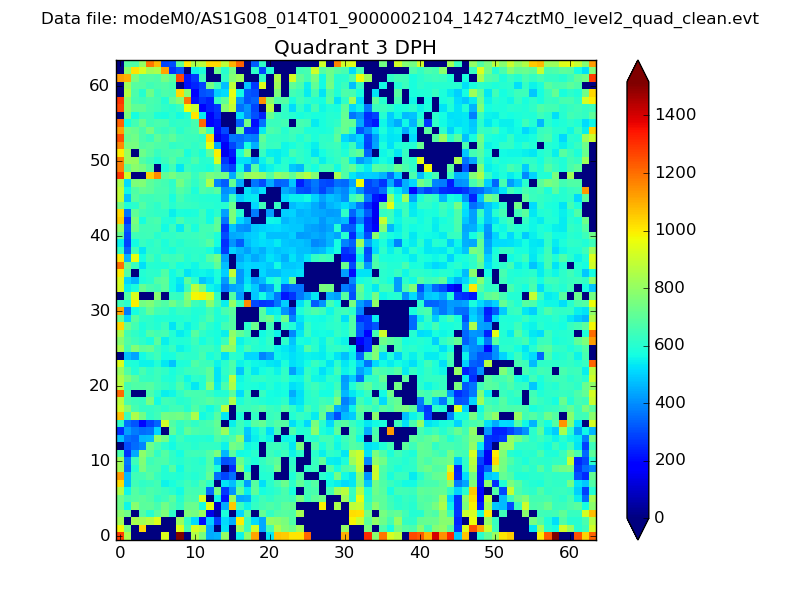 |
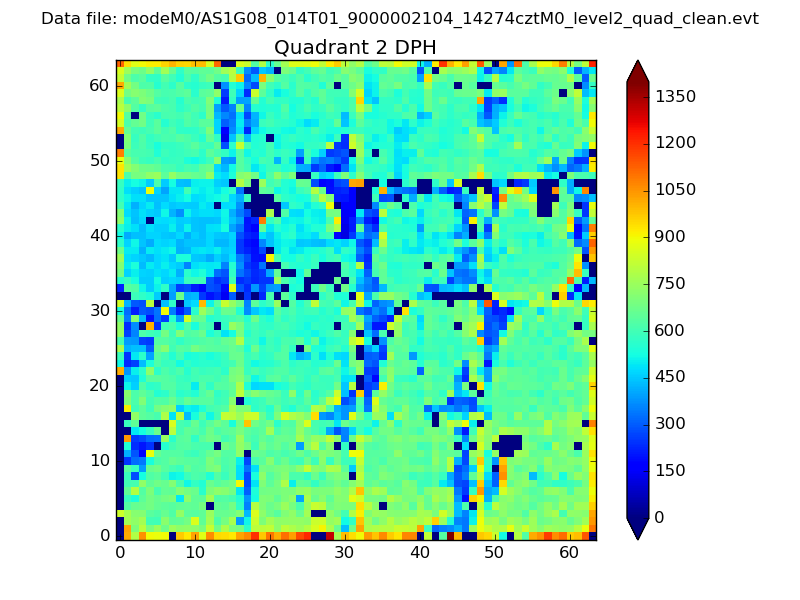 |
Quadrant C |
| Plot type | Count rate plots | Images |
|---|---|---|
| Comparison with Poisson distribution Blue bars denote a histogram of data divided into 1 sec bins. Red curve is a Poisson curve with rate = median count rate of data. |
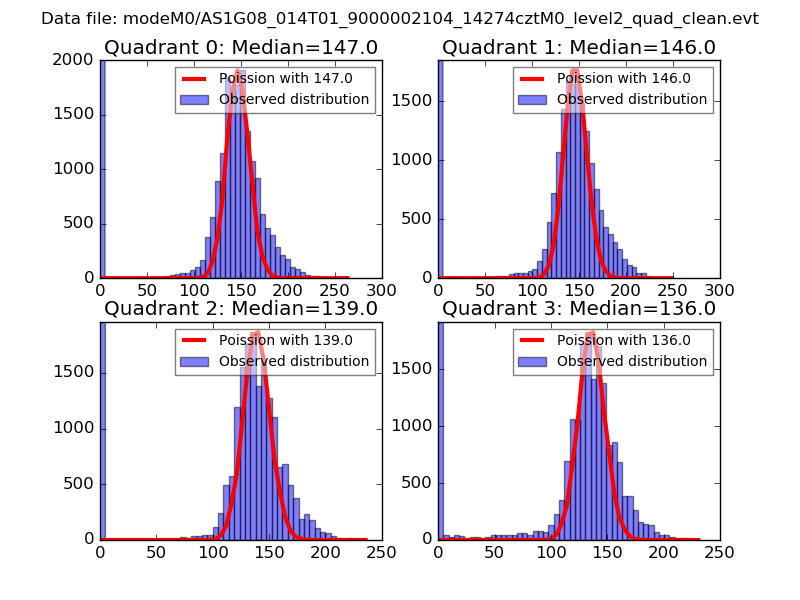 |
 |
| Quadrant-wise count rates Data is divided into 100 sec bins |
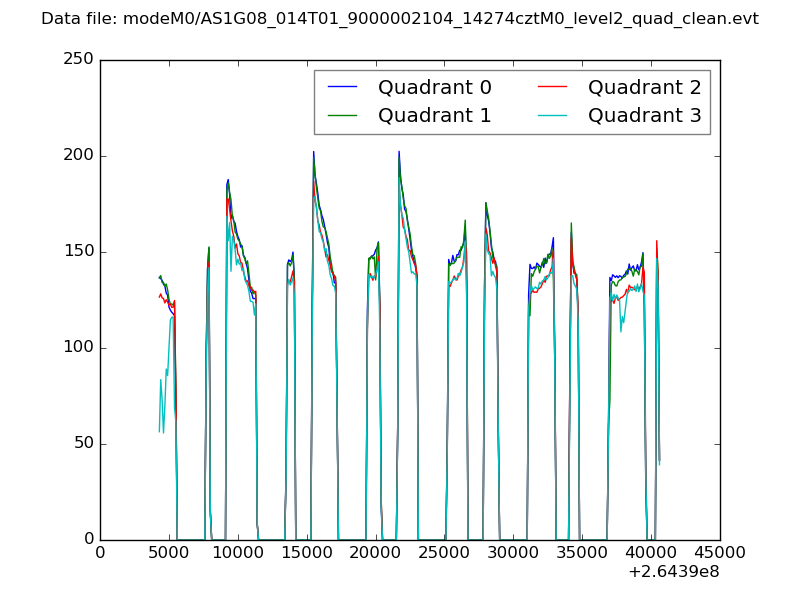 |
|
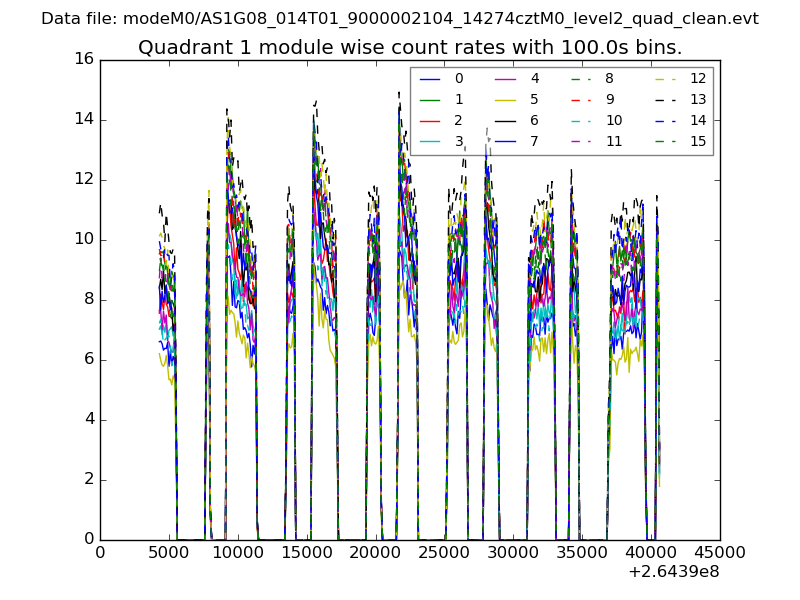
| Module-wise count rates for Quadrant A Data is divided into 100 sec bins |
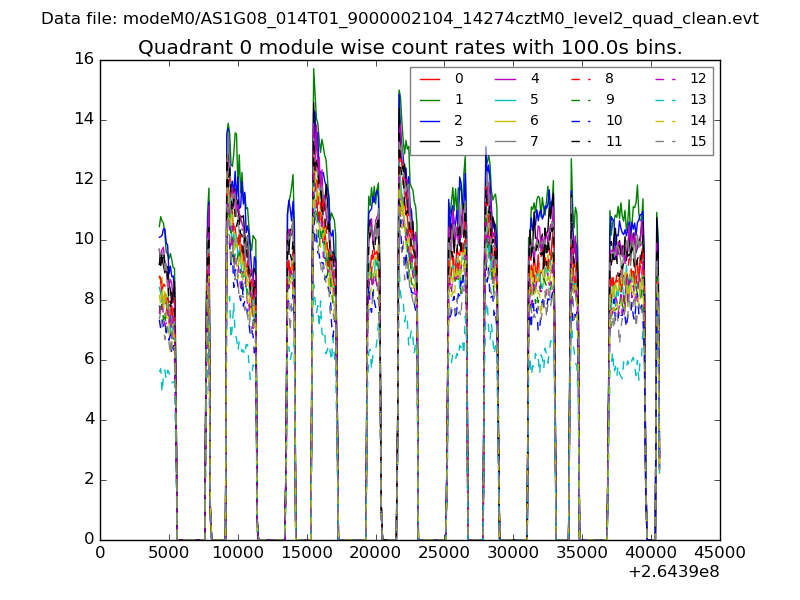 |
 |
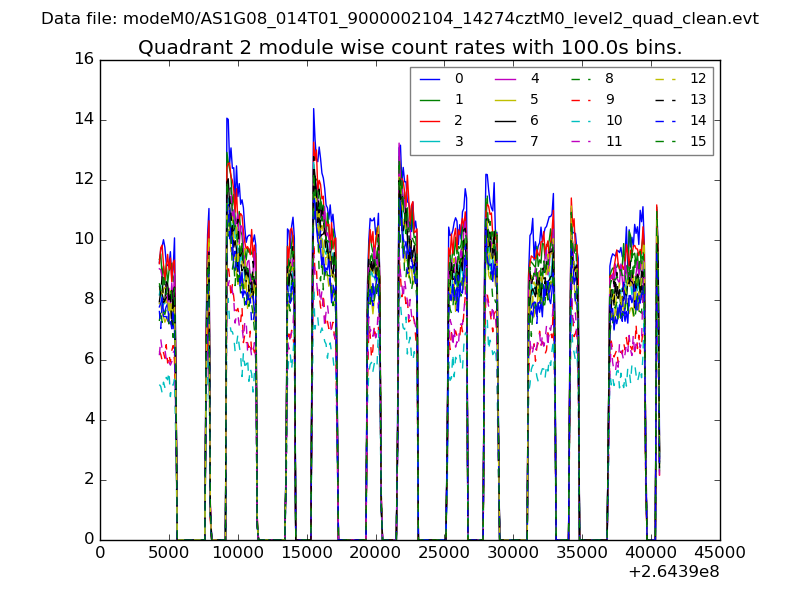
| Module-wise count rates for Quadrant B Data is divided into 100 sec bins |
 |
 |
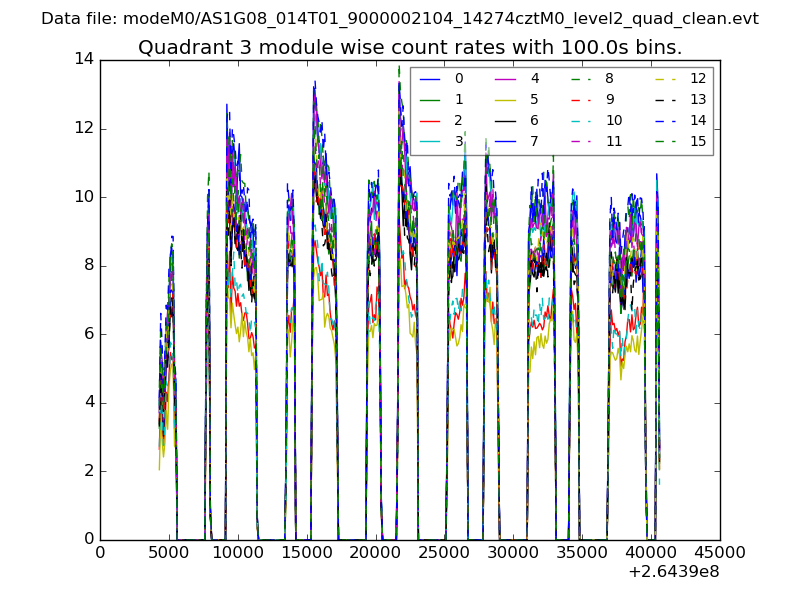
| Module-wise count rates for Quadrant C Data is divided into 100 sec bins |
 |
 |
| Module-wise count rates for Quadrant D Data is divided into 100 sec bins |
 |
 |
| Parameter | Plot |
|---|---|
| CZT HV Monitor | 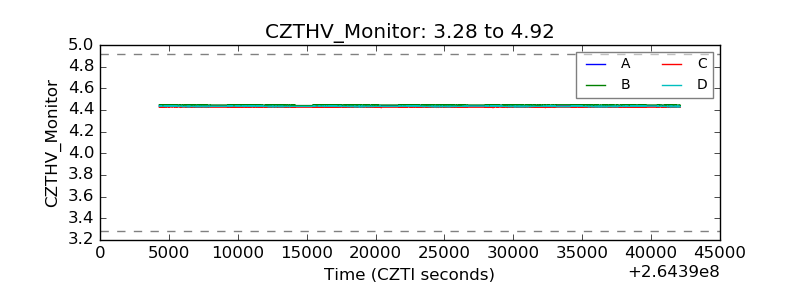 |
| D_VDD | 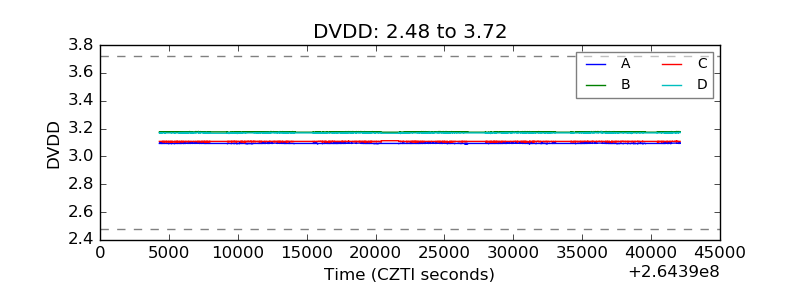 |
| Temperature 1 | 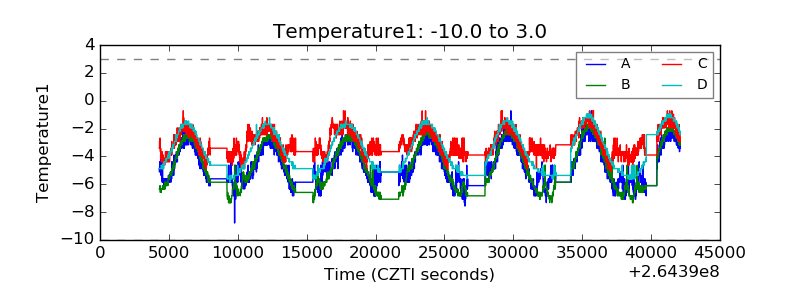 |
| Veto HV Monitor | 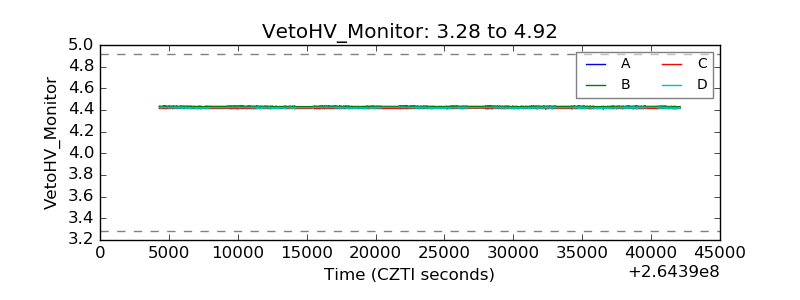 |
| Veto LLD | 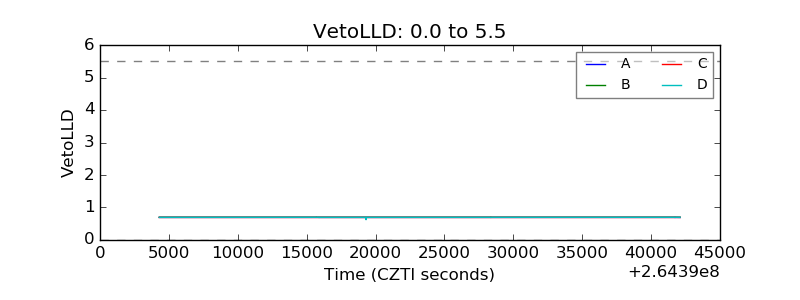 |
| Alpha Counter | 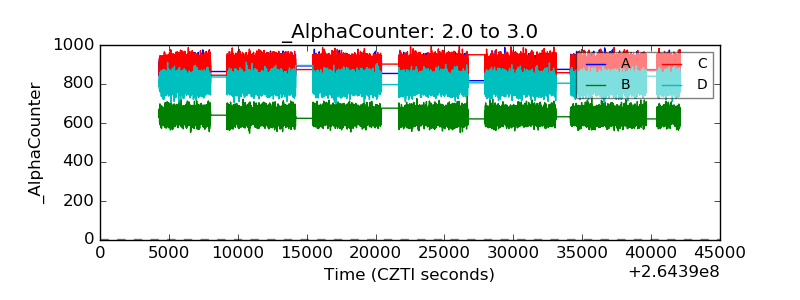 |
| _CPM_Rate | 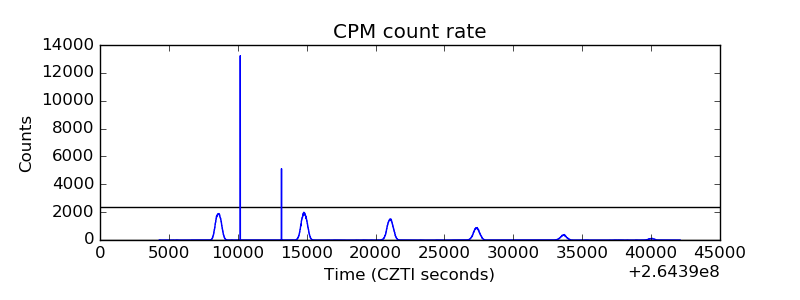 |
| CZT Counter | 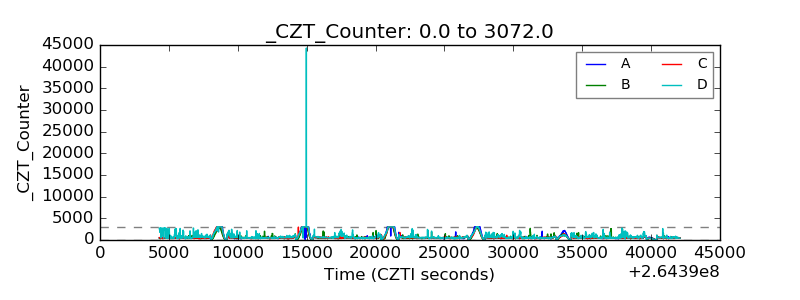 |
| +2.5 Volts monitor | 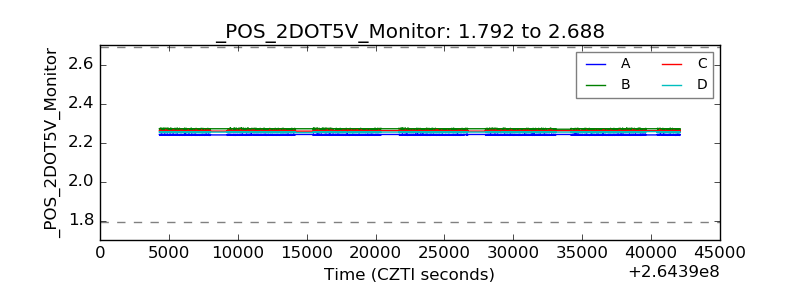 |
| +5 Volts monitor |  |
| _ROLL_ROT | 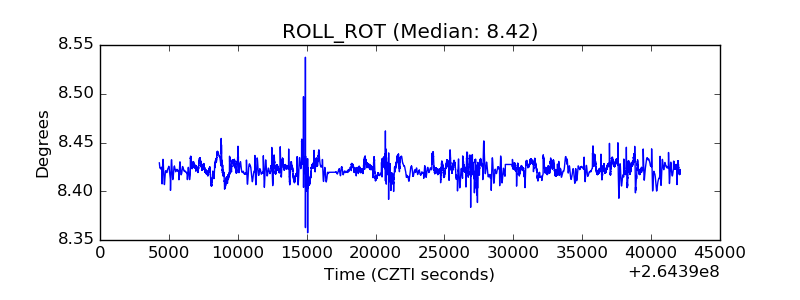 |
| _Roll_DEC | 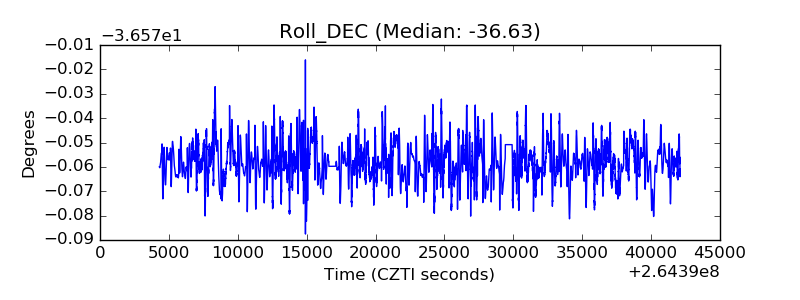 |
| _Roll_RA | 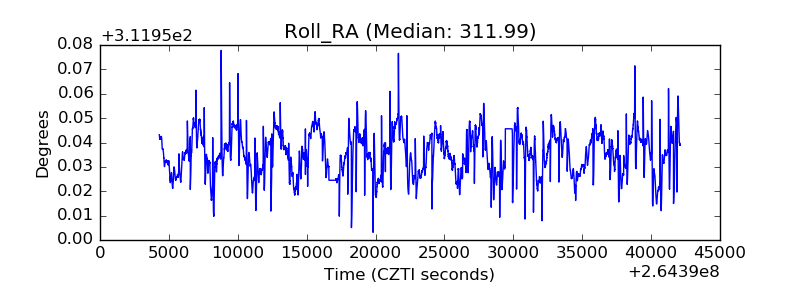 |
| Veto Counter |  |