| Param | Original file | Final file |
|---|---|---|
| Filename | modeM0/AS1G08_014T01_9000002104_14275cztM0_level2.evt | modeM0/AS1G08_014T01_9000002104_14275cztM0_level2_quad_clean.evt |
| Size (bytes) | 539,187,840 | 77,618,880 |
| Size | 514.2 MB | 74.0 MB |
| Events in quadrant A | 3,682,149 | 476,361 |
| Events in quadrant B | 4,183,547 | 469,702 |
| Events in quadrant C | 3,862,129 | 446,732 |
| Events in quadrant D | 4,106,239 | 449,330 |
| Mode M9 | |||
|---|---|---|---|
| Quadrant | BADHDUFLAG | Total packets | Discarded packets |
| A | 0 | 4 | 0 |
| B | 0 | 4 | 0 |
| C | 0 | 4 | 0 |
| D | 0 | 4 | 0 |
| Mode SS | |||
|---|---|---|---|
| Quadrant | BADHDUFLAG | Total packets | Discarded packets |
| A | 0 | 148 | 0 |
| B | 0 | 148 | 0 |
| C | 0 | 148 | 0 |
| D | 0 | 148 | 0 |
| Mode M0 | |||
|---|---|---|---|
| Quadrant | BADHDUFLAG | Total packets | Discarded packets |
| A | 0 | 15419 | 2 |
| B | 0 | 16953 | 1 |
| C | 0 | 15901 | 1 |
| D | 0 | 17169 | 1 |
| Quadrant | Total seconds | Saturated seconds | Saturation percentage |
|---|---|---|---|
| A | 7297 | 151 | 2.069344% |
| B | 7297 | 271 | 3.713855% |
| C | 7297 | 114 | 1.562286% |
| D | 7297 | 137 | 1.877484% |
Noise dominated data is calculated using 1-second bins in cleaned event files. If a bin has >2000 counts, and if more than 50% of those come from <1% of pixels, then it is considered to be noise-dominated and hence unusable.
| Quadrant | # 1 sec bins | Bins with >0 counts | Bins with >2000 counts | High rate bins dominated by noise | Noise dominated (total time) | Noise dominated (detector-on time) | Marked lightcurve |
|---|---|---|---|---|---|---|---|
| A | 7713 | 7299 | 0 | 0 | 0.00% | 0.00% | 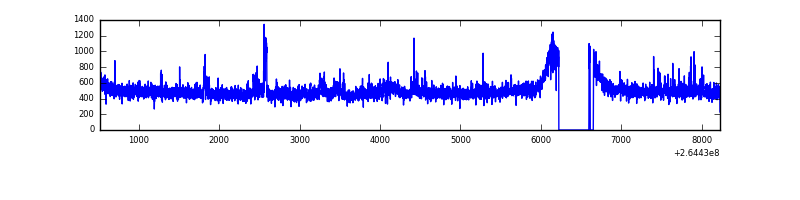 |
| B | 7713 | 7299 | 65 | 65 | 0.84% | 0.89% | 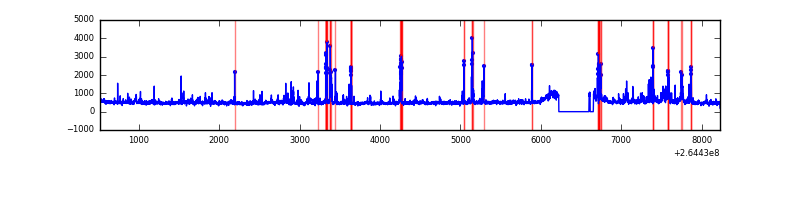 |
| C | 7713 | 7300 | 2 | 2 | 0.03% | 0.03% | 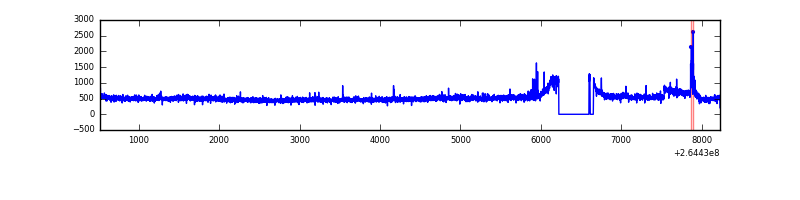 |
| D | 7713 | 7300 | 32 | 32 | 0.41% | 0.44% | 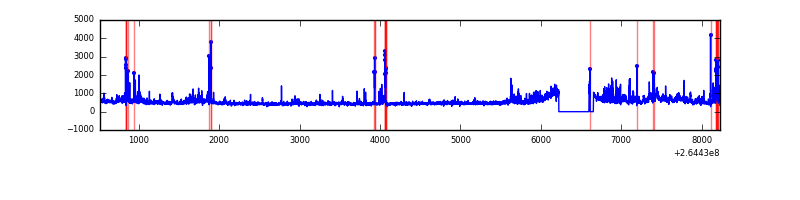 |
Top three noisy pixels from each quadrant. If the there are fewer than three noisy pixels in the level2.evt file, extra rows are filled as -1
| Pixel properties | Quadrant properties | ||||||
|---|---|---|---|---|---|---|---|
| Quadrant | DetID | PixID | Counts | Sigma | Mean | Median | Sigma |
| A | 12 | 189 | 160127 | 871.45 | 905 | 884 | 182.7 |
| A | 8 | 15 | 16692 | 86.51 | 905 | 884 | 182.7 |
| A | 9 | 143 | 15149 | 78.06 | 905 | 884 | 182.7 |
| B | 0 | 229 | 405916 | 2355.97 | 890 | 868 | 171.9 |
| B | 0 | 182 | 112746 | 650.74 | 890 | 868 | 171.9 |
| B | 10 | 244 | 63843 | 366.29 | 890 | 868 | 171.9 |
| C | 3 | 233 | 418247 | 2067.75 | 867 | 870 | 201.9 |
| C | 6 | 96 | 62116 | 303.42 | 867 | 870 | 201.9 |
| C | 13 | 61 | 6229 | 26.55 | 867 | 870 | 201.9 |
| D | 5 | 222 | 358181 | 1719.45 | 872 | 851 | 207.8 |
| D | 10 | 199 | 137004 | 655.16 | 872 | 851 | 207.8 |
| D | 10 | 172 | 111351 | 531.72 | 872 | 851 | 207.8 |
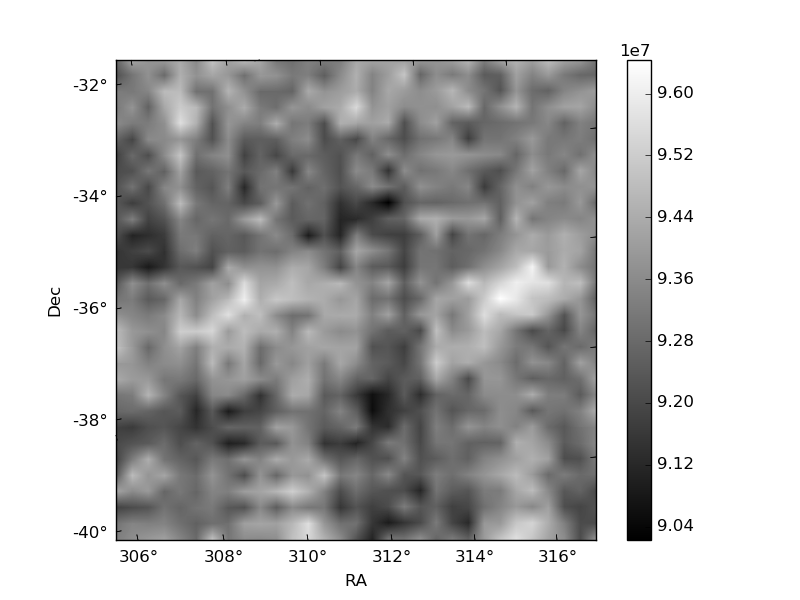
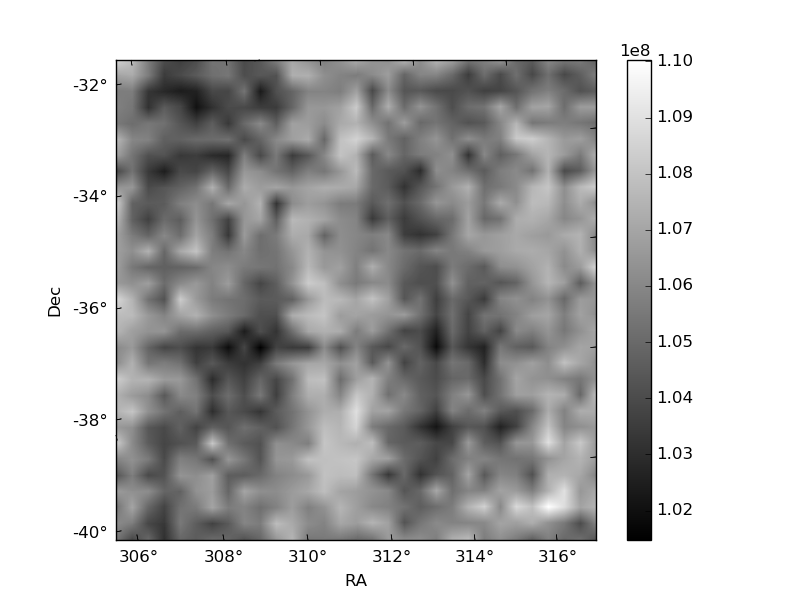
Histogram calculated using DETX and DETY for each event in the final _common_clean file
| Quadrant A | 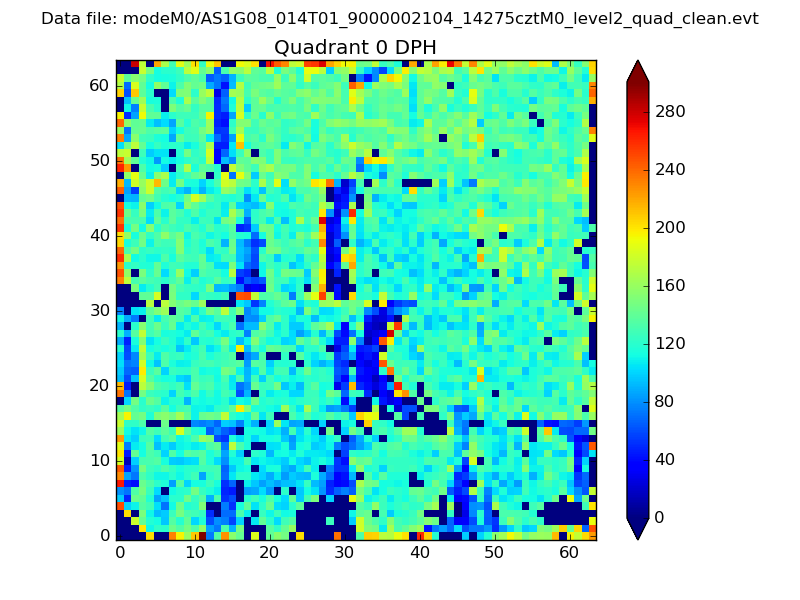 |
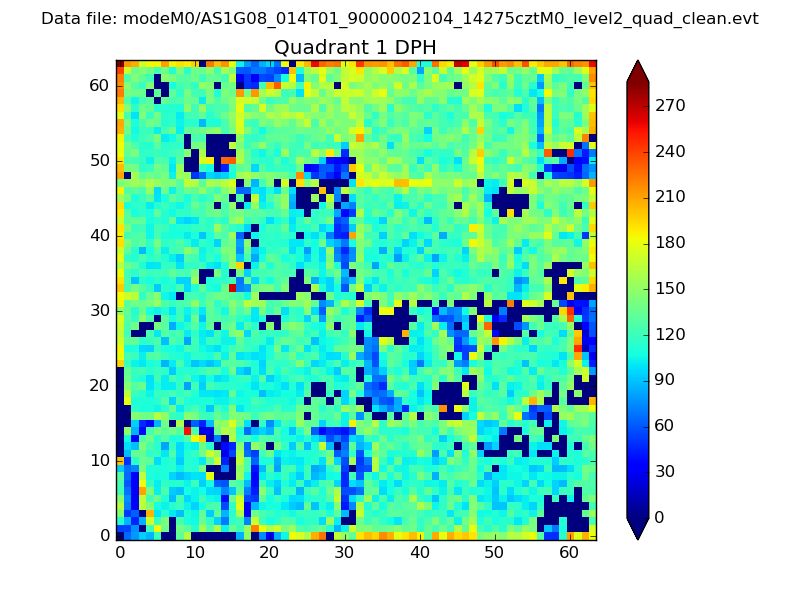 |
Quadrant B |
|---|---|---|---|
| Quadrant D | 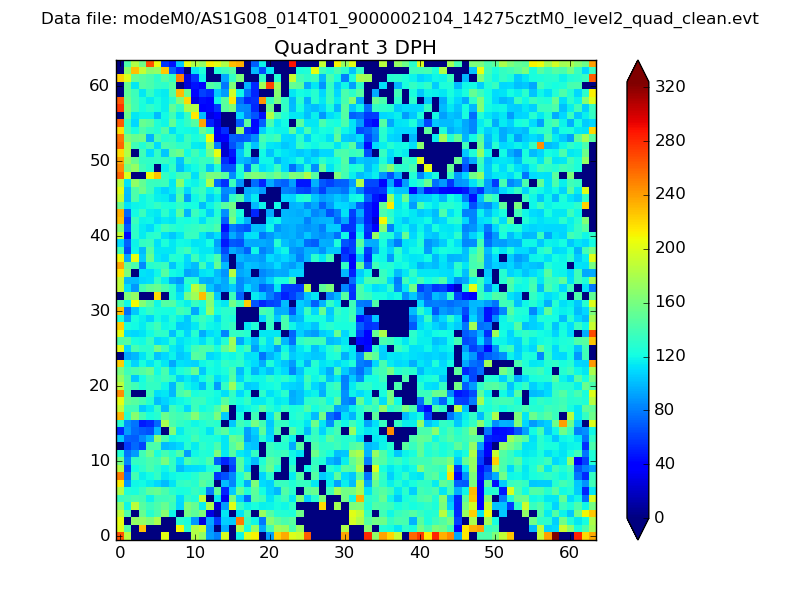 |
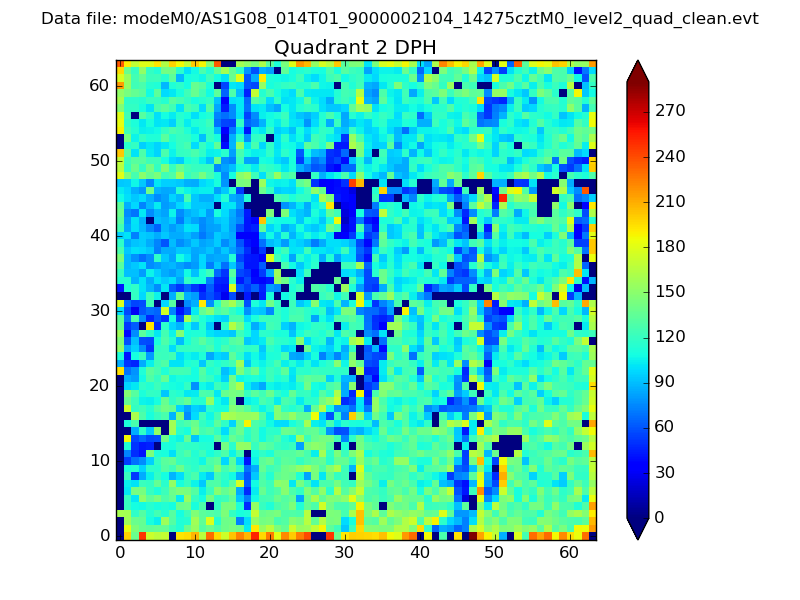 |
Quadrant C |
| Plot type | Count rate plots | Images |
|---|---|---|
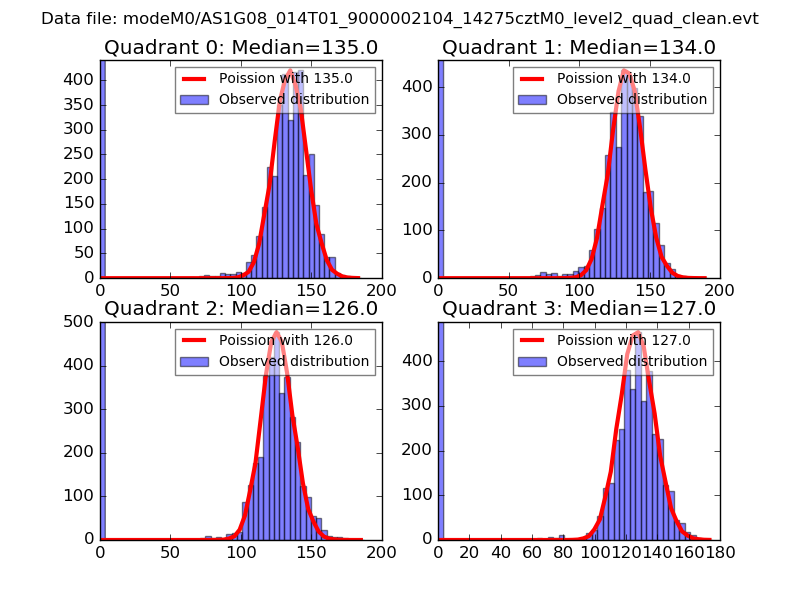
| Comparison with Poisson distribution Blue bars denote a histogram of data divided into 1 sec bins. Red curve is a Poisson curve with rate = median count rate of data. |
 |
 |
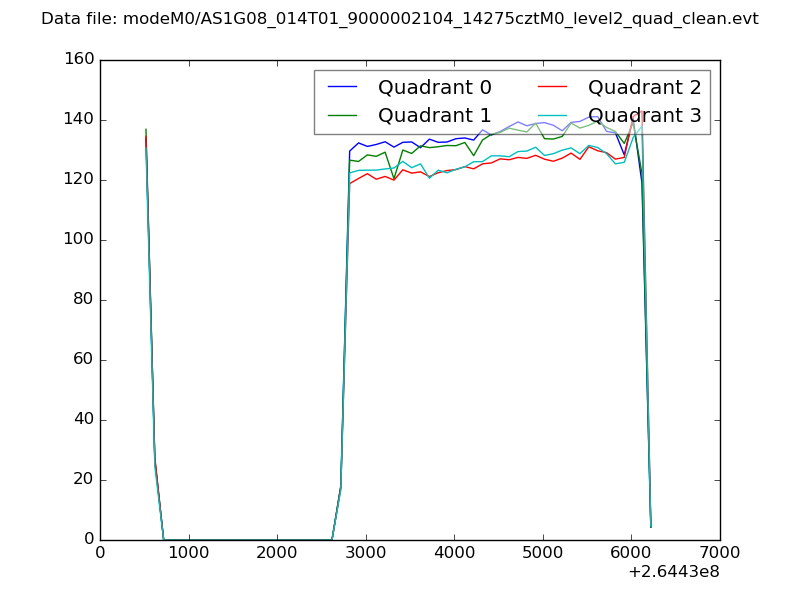
| Quadrant-wise count rates Data is divided into 100 sec bins |
 |
|
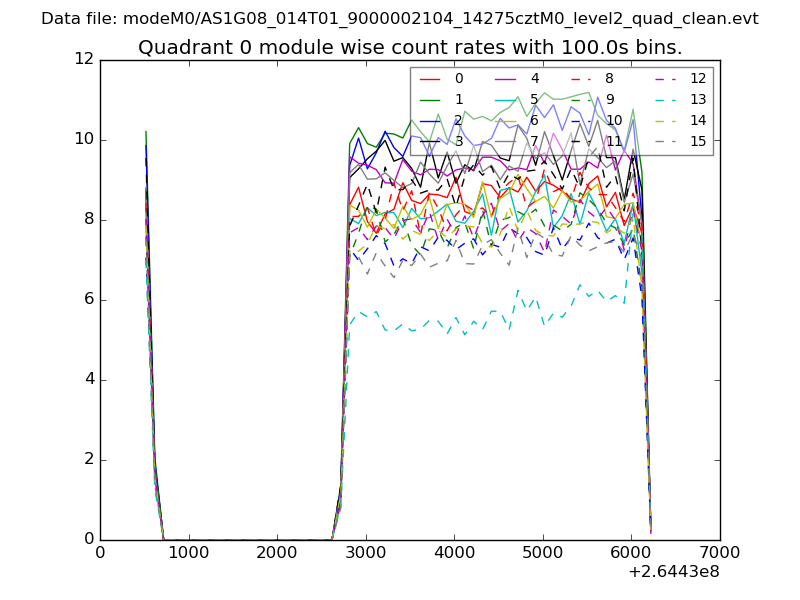
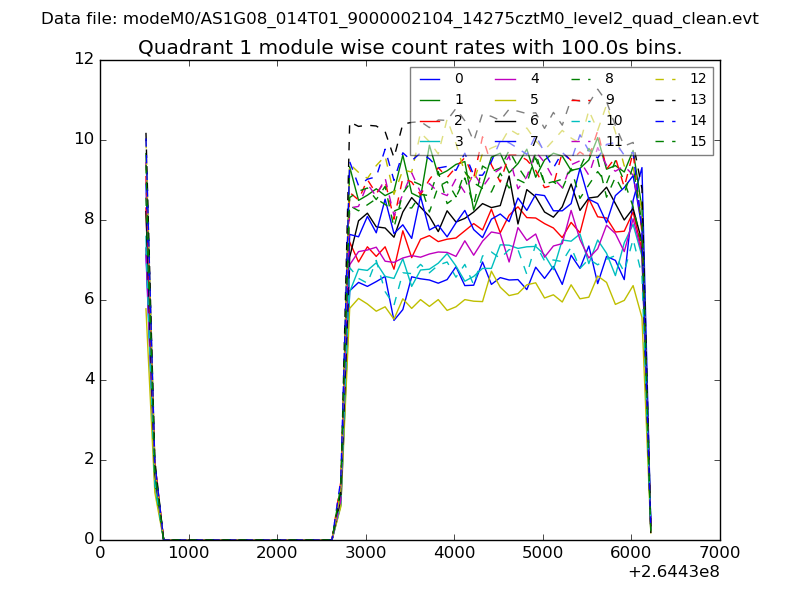
| Module-wise count rates for Quadrant A Data is divided into 100 sec bins |
 |
 |
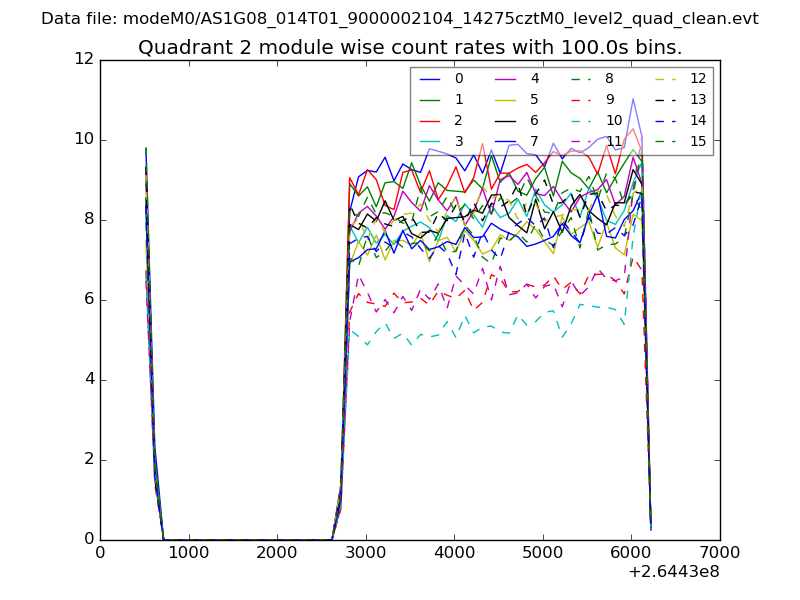
| Module-wise count rates for Quadrant B Data is divided into 100 sec bins |
 |
 |
| Module-wise count rates for Quadrant C Data is divided into 100 sec bins |
 |
 |
| Module-wise count rates for Quadrant D Data is divided into 100 sec bins |
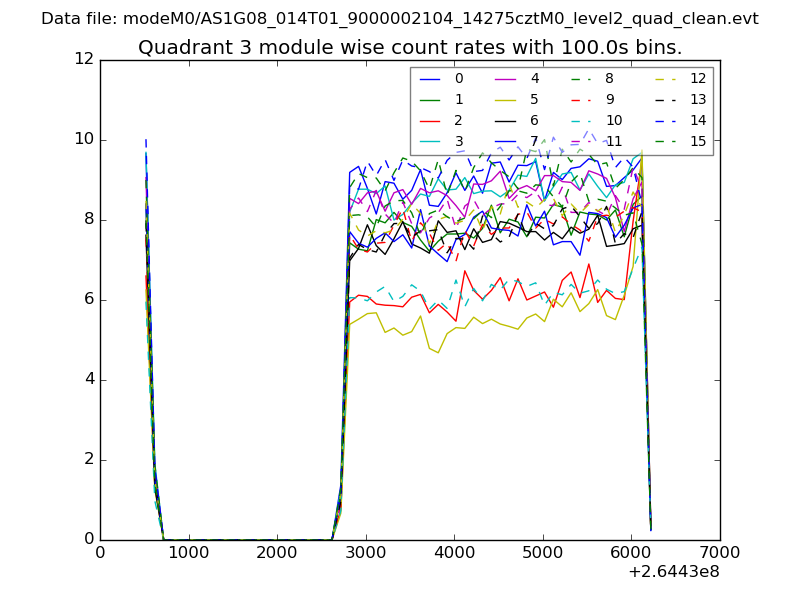 |
 |
| Parameter | Plot |
|---|---|
| CZT HV Monitor | 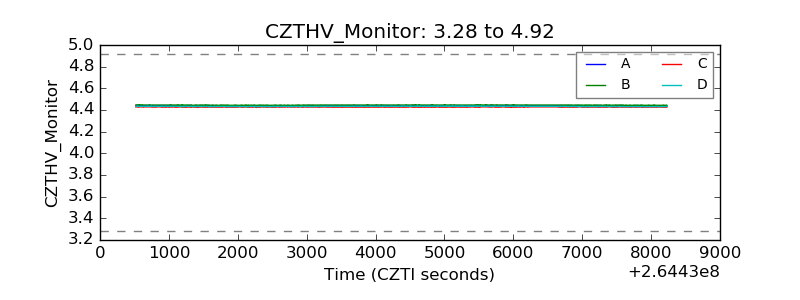 |
| D_VDD | 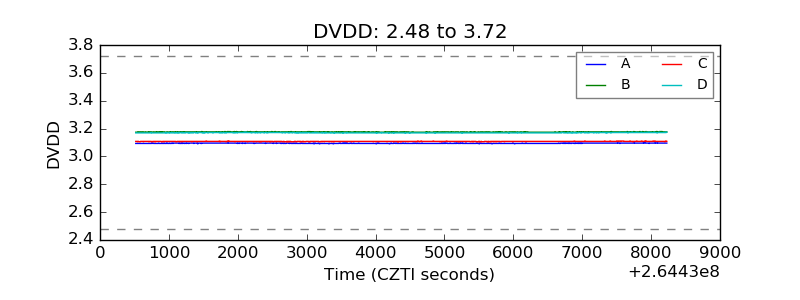 |
| Temperature 1 | 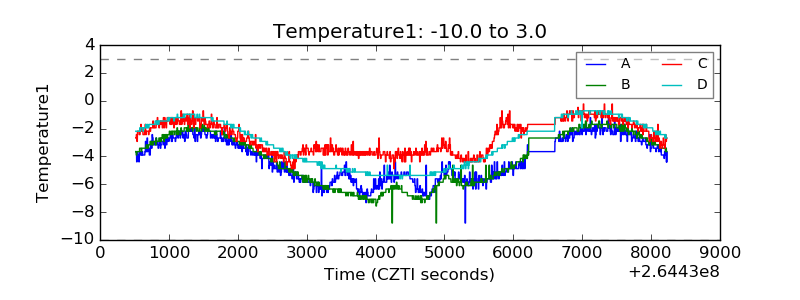 |
| Veto HV Monitor | 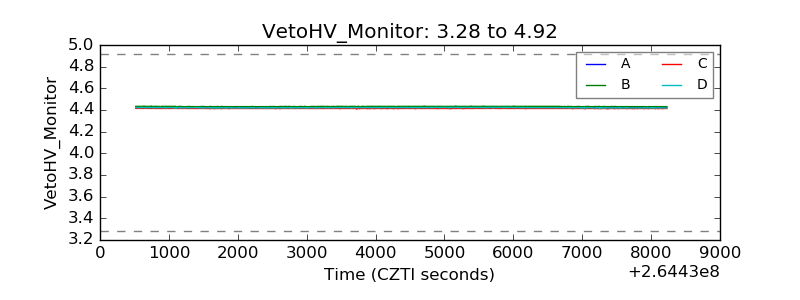 |
| Veto LLD | 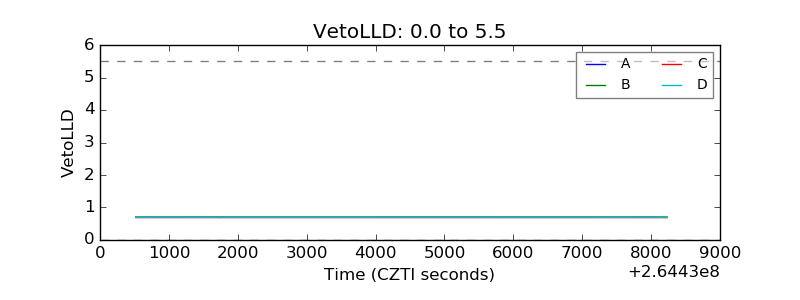 |
| Alpha Counter | 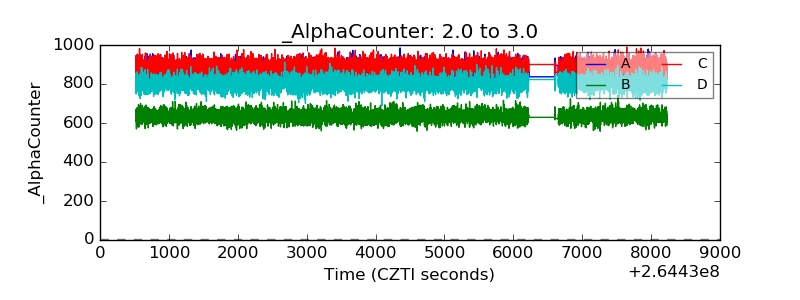 |
| _CPM_Rate | 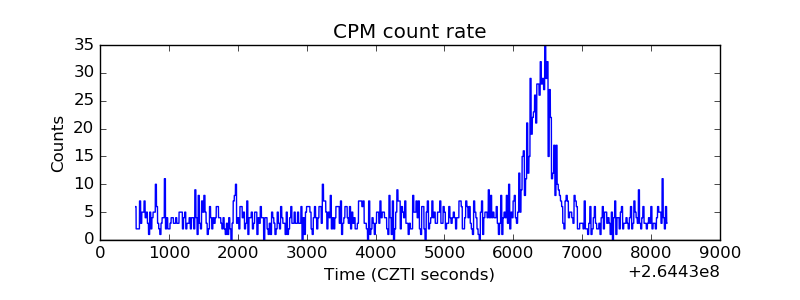 |
| CZT Counter | 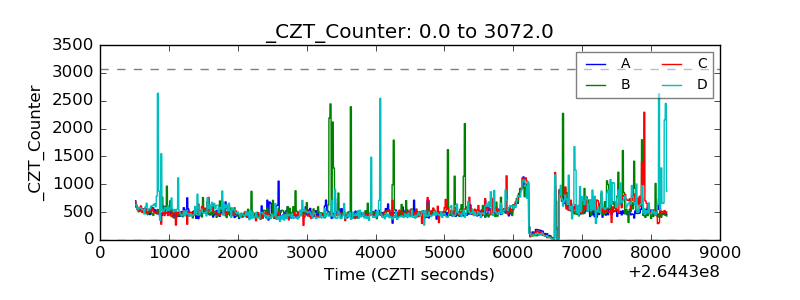 |
| +2.5 Volts monitor |  |
| +5 Volts monitor |  |
| _ROLL_ROT | 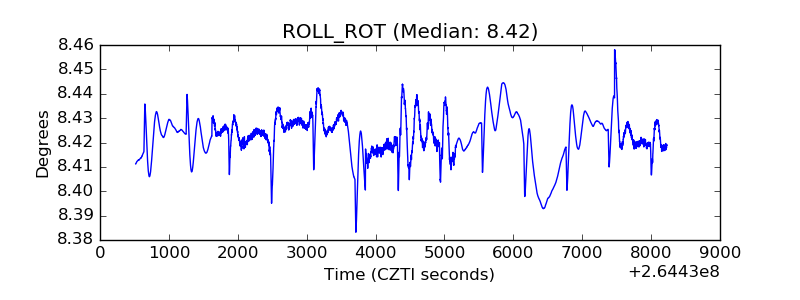 |
| _Roll_DEC | 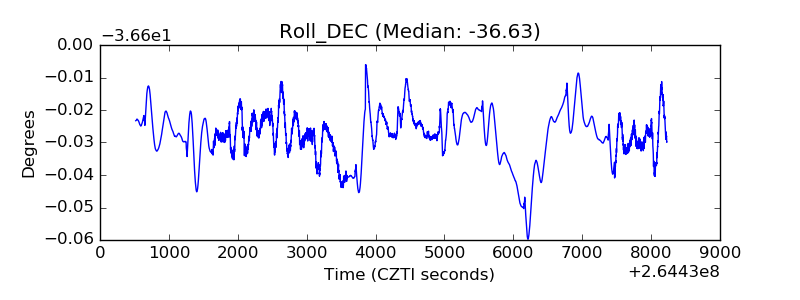 |
| _Roll_RA | 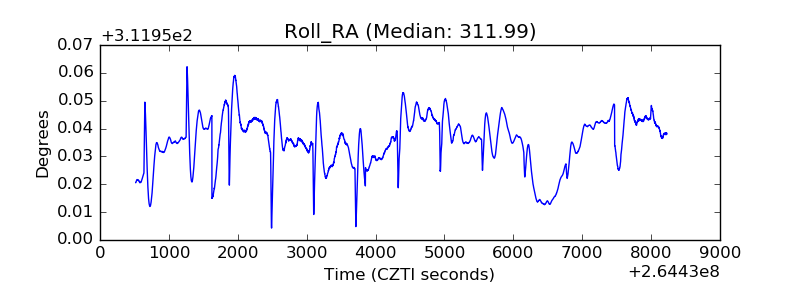 |
| Veto Counter | 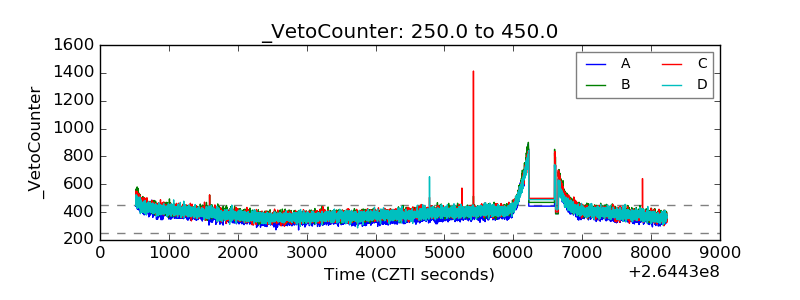 |