| Param | Original file | Final file |
|---|---|---|
| Filename | modeM0/AS1G08_014T01_9000002104_14277cztM0_level2.evt | modeM0/AS1G08_014T01_9000002104_14277cztM0_level2_quad_clean.evt |
| Size (bytes) | 647,375,040 | 87,698,880 |
| Size | 617.4 MB | 83.6 MB |
| Events in quadrant A | 4,107,818 | 547,304 |
| Events in quadrant B | 5,154,179 | 542,179 |
| Events in quadrant C | 4,197,553 | 512,972 |
| Events in quadrant D | 5,607,291 | 500,065 |
| Mode M9 | |||
|---|---|---|---|
| Quadrant | BADHDUFLAG | Total packets | Discarded packets |
| A | 0 | 7 | 0 |
| B | 0 | 7 | 0 |
| C | 0 | 7 | 0 |
| D | 0 | 7 | 0 |
| Mode SS | |||
|---|---|---|---|
| Quadrant | BADHDUFLAG | Total packets | Discarded packets |
| A | 0 | 162 | 0 |
| B | 0 | 162 | 0 |
| C | 0 | 162 | 0 |
| D | 0 | 162 | 0 |
| Mode M0 | |||
|---|---|---|---|
| Quadrant | BADHDUFLAG | Total packets | Discarded packets |
| A | 0 | 17217 | 2 |
| B | 0 | 20453 | 1 |
| C | 0 | 17137 | 1 |
| D | 0 | 21821 | 1 |
| Quadrant | Total seconds | Saturated seconds | Saturation percentage |
|---|---|---|---|
| A | 7967 | 189 | 2.372286% |
| B | 7967 | 665 | 8.346931% |
| C | 7967 | 89 | 1.117108% |
| D | 7967 | 399 | 5.008159% |
Noise dominated data is calculated using 1-second bins in cleaned event files. If a bin has >2000 counts, and if more than 50% of those come from <1% of pixels, then it is considered to be noise-dominated and hence unusable.
| Quadrant | # 1 sec bins | Bins with >0 counts | Bins with >2000 counts | High rate bins dominated by noise | Noise dominated (total time) | Noise dominated (detector-on time) | Marked lightcurve |
|---|---|---|---|---|---|---|---|
| A | 8583 | 7972 | 0 | 0 | 0.00% | 0.00% | 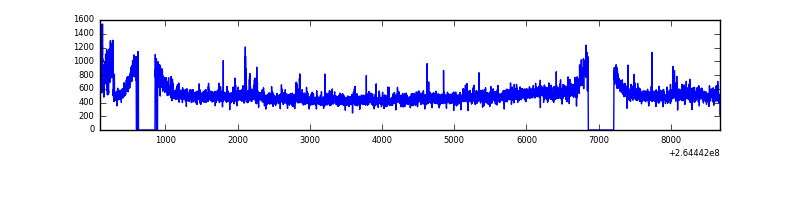 |
| B | 8583 | 7972 | 314 | 314 | 3.66% | 3.94% | 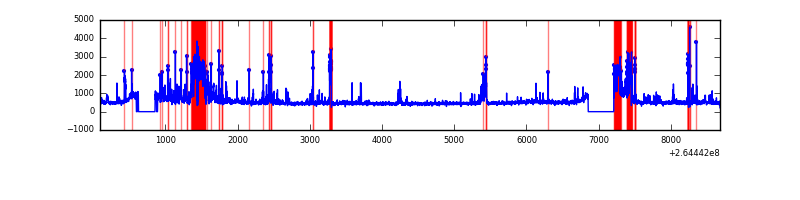 |
| C | 8583 | 7972 | 0 | 0 | 0.00% | 0.00% | 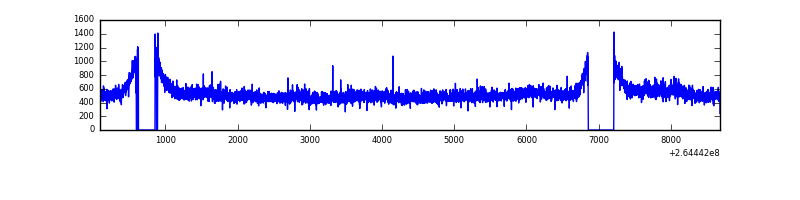 |
| D | 8583 | 7972 | 266 | 266 | 3.10% | 3.34% | 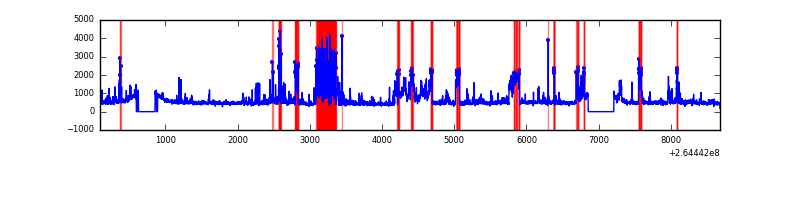 |
Top three noisy pixels from each quadrant. If the there are fewer than three noisy pixels in the level2.evt file, extra rows are filled as -1
| Pixel properties | Quadrant properties | ||||||
|---|---|---|---|---|---|---|---|
| Quadrant | DetID | PixID | Counts | Sigma | Mean | Median | Sigma |
| A | 8 | 15 | 195934 | 964.16 | 993 | 969 | 202.2 |
| A | 12 | 189 | 74475 | 363.51 | 993 | 969 | 202.2 |
| A | 9 | 143 | 11804 | 53.58 | 993 | 969 | 202.2 |
| B | 0 | 182 | 852231 | 4629.14 | 953 | 928 | 183.9 |
| B | 0 | 229 | 429580 | 2330.89 | 953 | 928 | 183.9 |
| B | 3 | 209 | 53028 | 283.31 | 953 | 928 | 183.9 |
| C | 3 | 233 | 505179 | 2277.63 | 947 | 950 | 221.4 |
| C | 13 | 61 | 6769 | 26.28 | 947 | 950 | 221.4 |
| C | 14 | 234 | 3328 | 10.74 | 947 | 950 | 221.4 |
| D | 12 | 110 | 989427 | 4379.12 | 945 | 921 | 225.7 |
| D | 5 | 222 | 774898 | 3428.75 | 945 | 921 | 225.7 |
| D | 10 | 199 | 102503 | 450.01 | 945 | 921 | 225.7 |
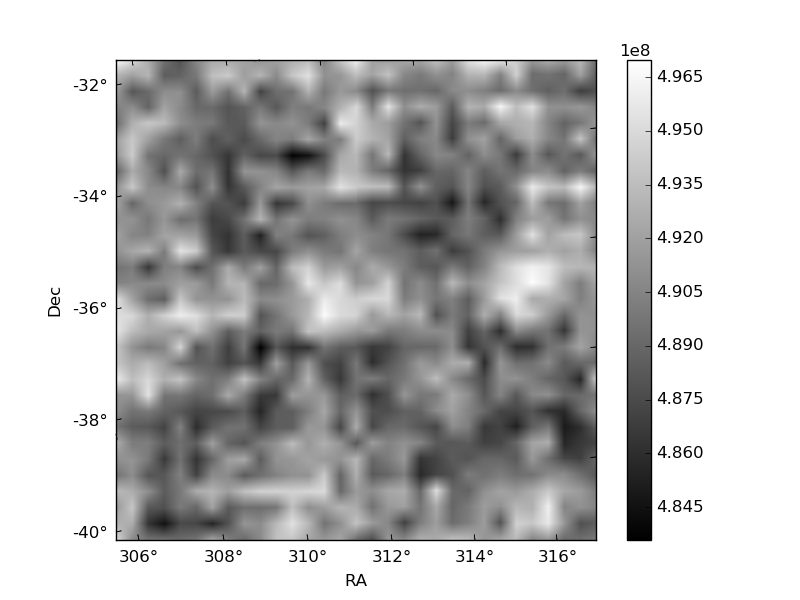
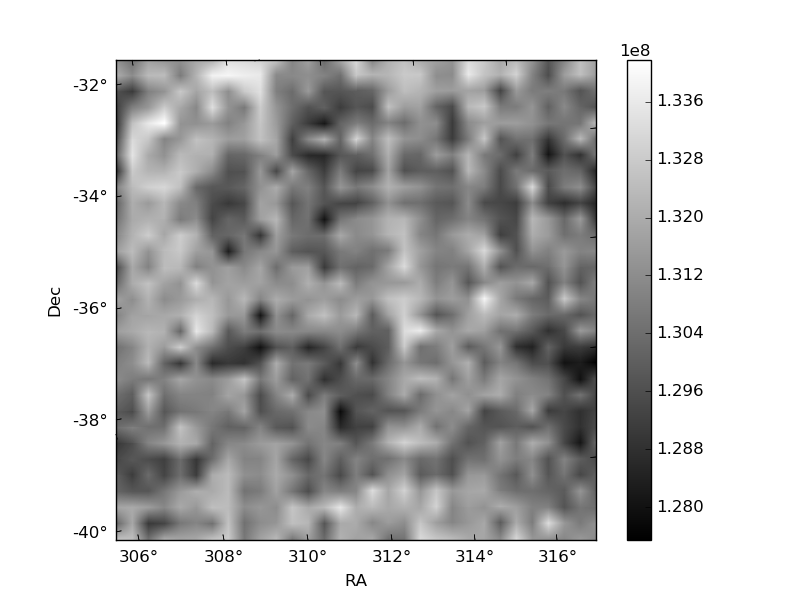
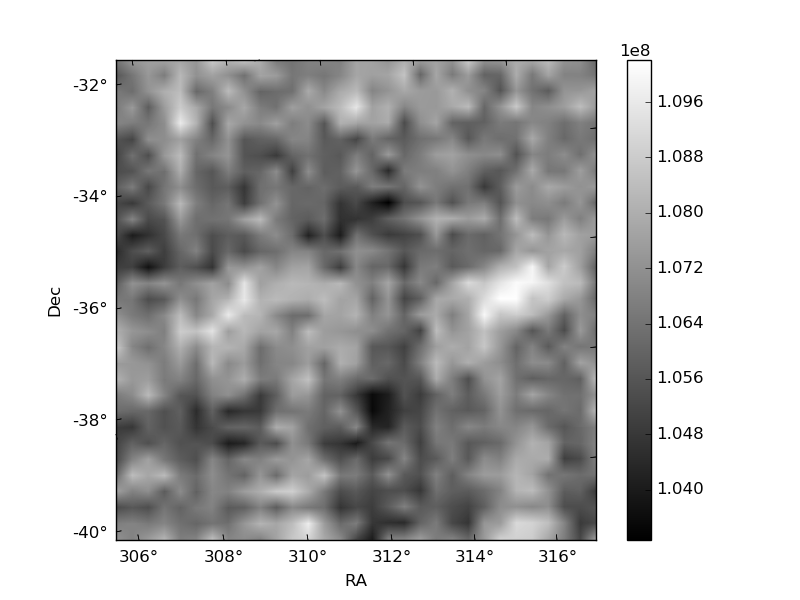
Histogram calculated using DETX and DETY for each event in the final _common_clean file
| Quadrant A | 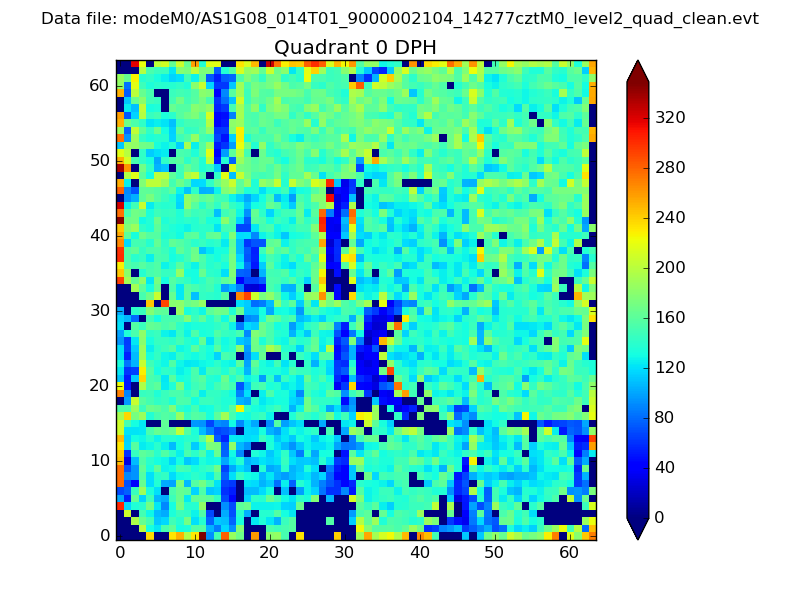 |
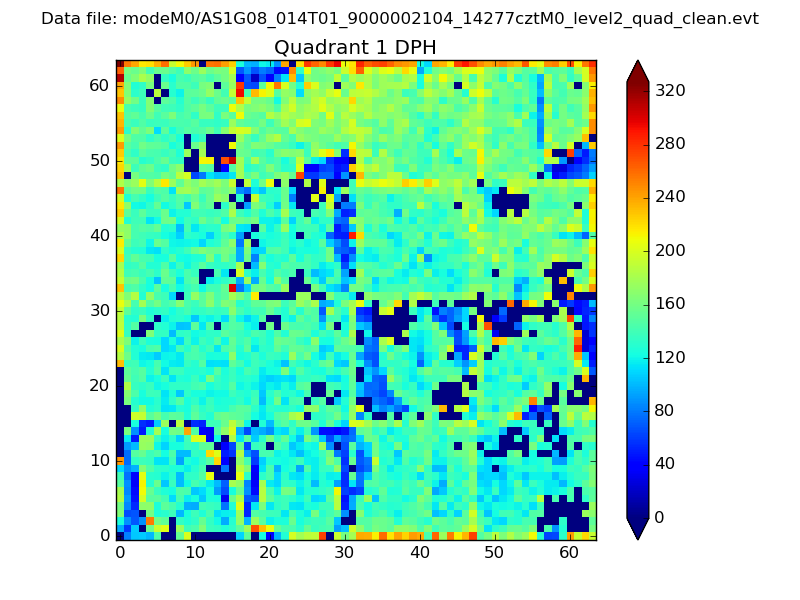 |
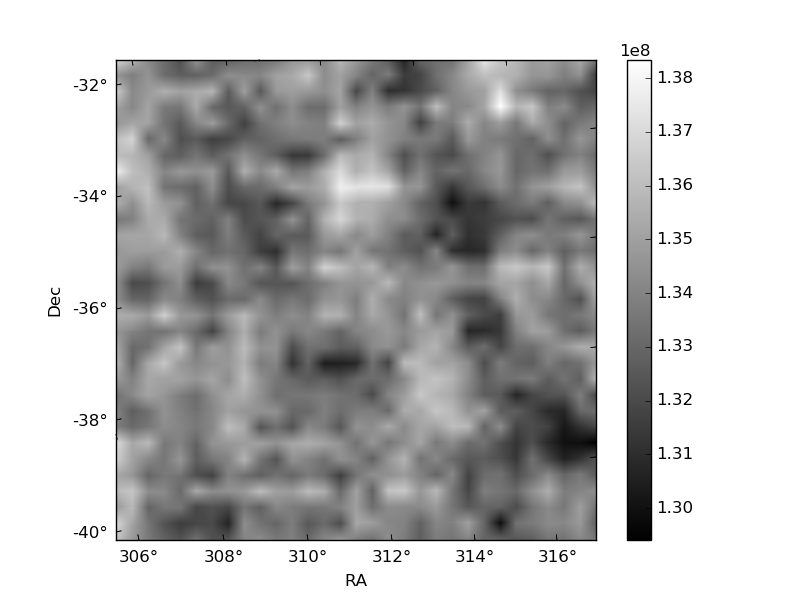
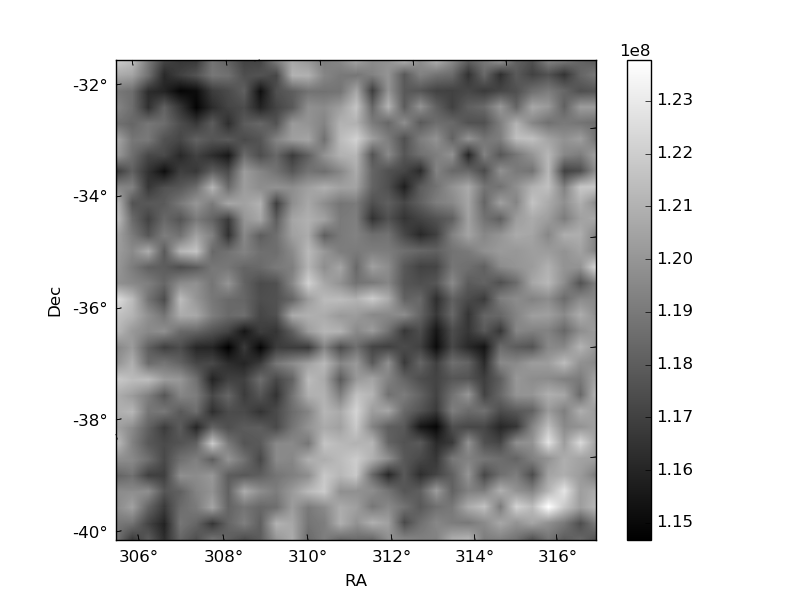
Quadrant B |
|---|---|---|---|
| Quadrant D | 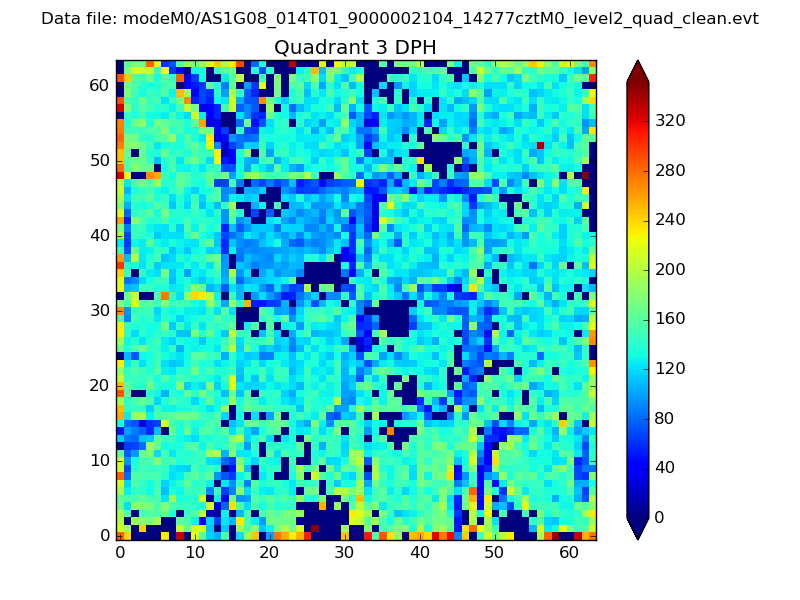 |
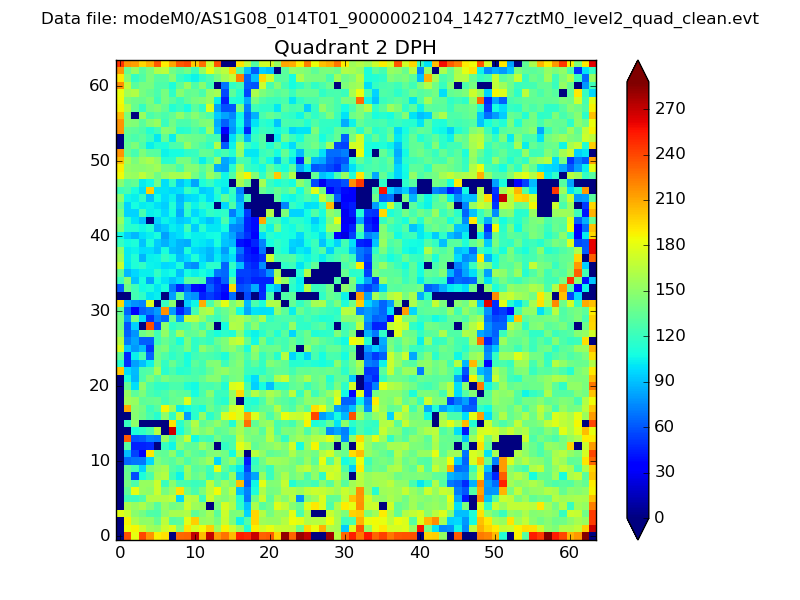 |
Quadrant C |
| Plot type | Count rate plots | Images |
|---|---|---|
| Comparison with Poisson distribution Blue bars denote a histogram of data divided into 1 sec bins. Red curve is a Poisson curve with rate = median count rate of data. |
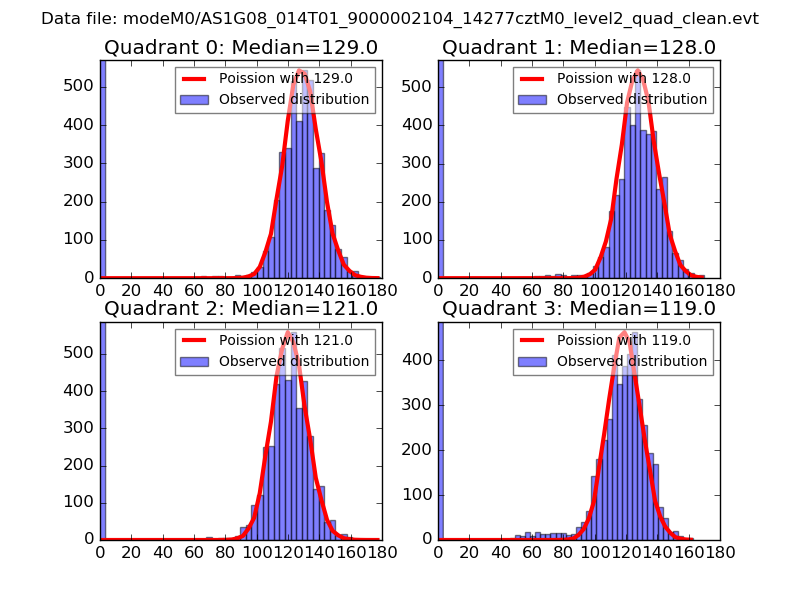 |
 |
| Quadrant-wise count rates Data is divided into 100 sec bins |
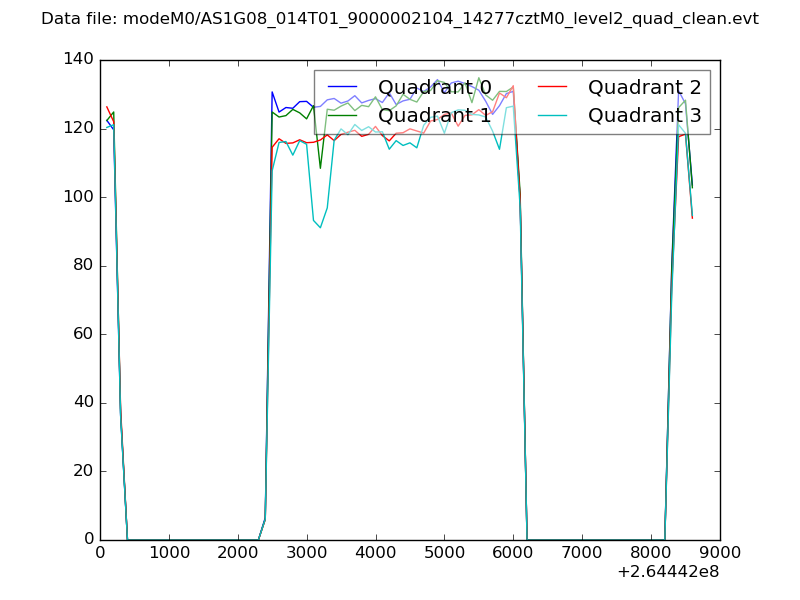 |
|
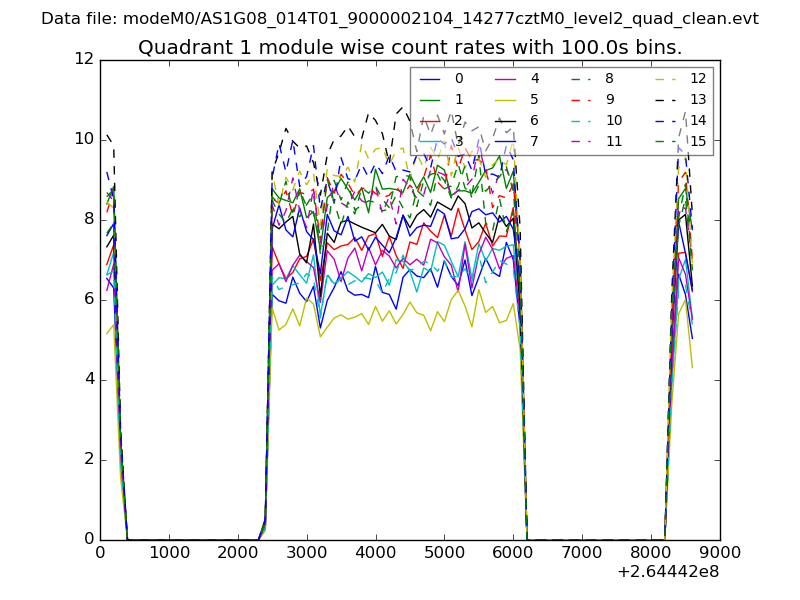
| Module-wise count rates for Quadrant A Data is divided into 100 sec bins |
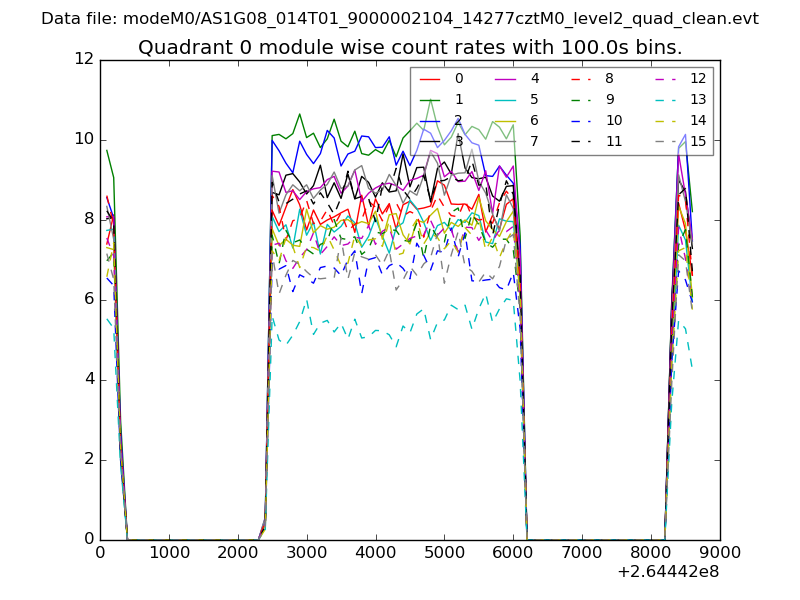 |
 |
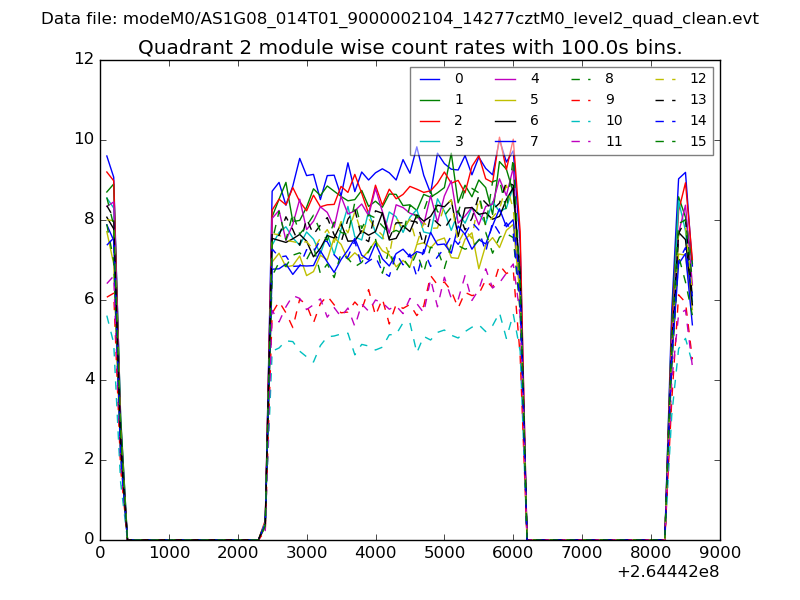
| Module-wise count rates for Quadrant B Data is divided into 100 sec bins |
 |
 |
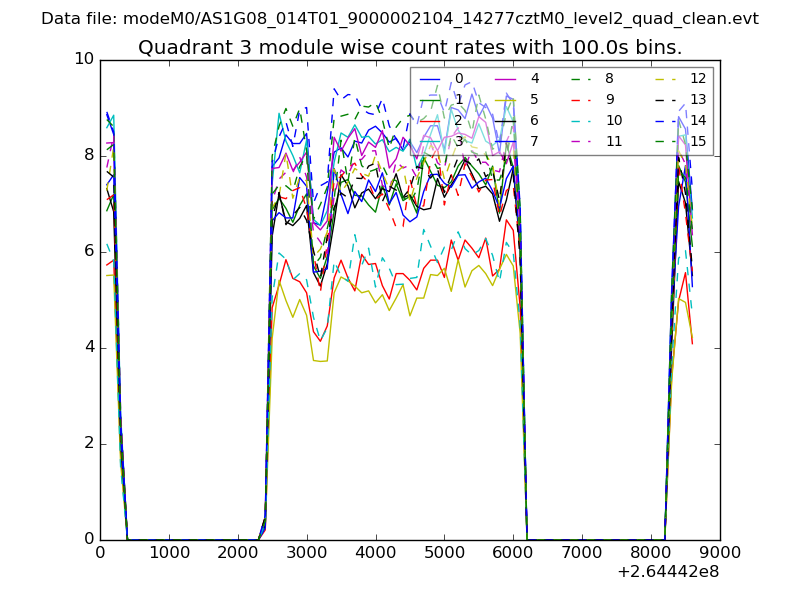
| Module-wise count rates for Quadrant C Data is divided into 100 sec bins |
 |
 |
| Module-wise count rates for Quadrant D Data is divided into 100 sec bins |
 |
 |
| Parameter | Plot |
|---|---|
| CZT HV Monitor | 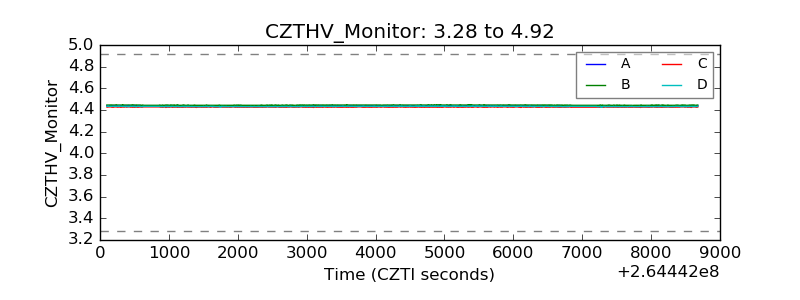 |
| D_VDD | 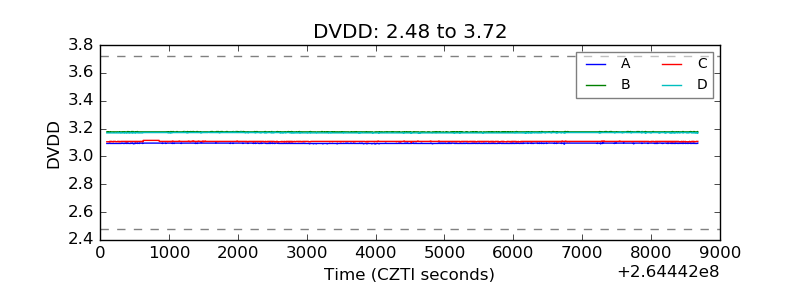 |
| Temperature 1 | 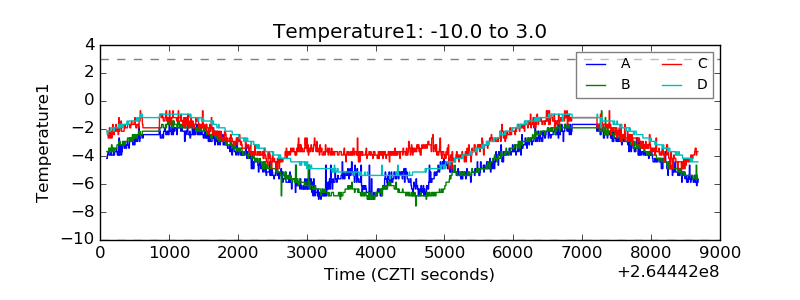 |
| Veto HV Monitor | 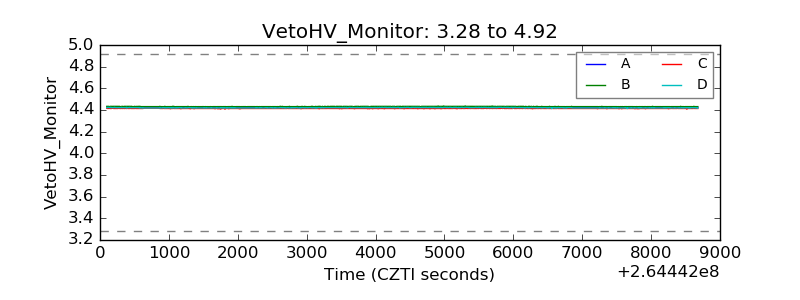 |
| Veto LLD | 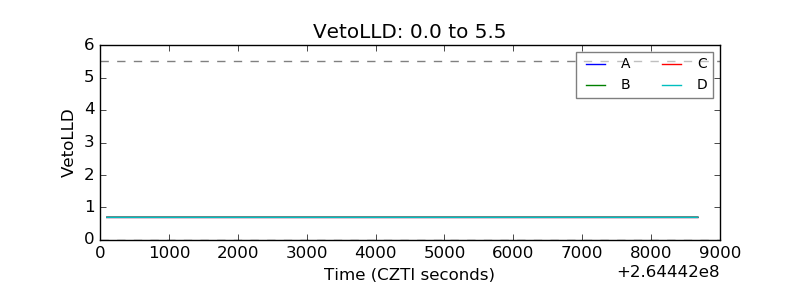 |
| Alpha Counter | 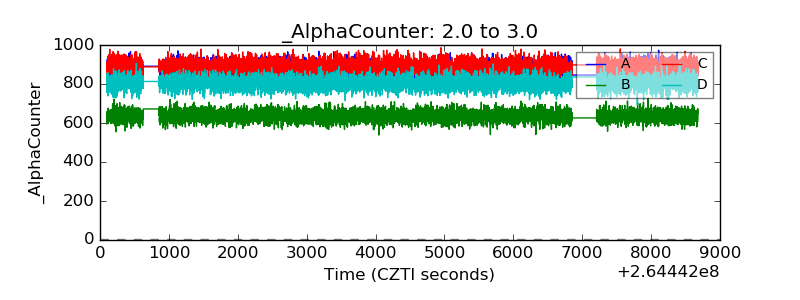 |
| _CPM_Rate | 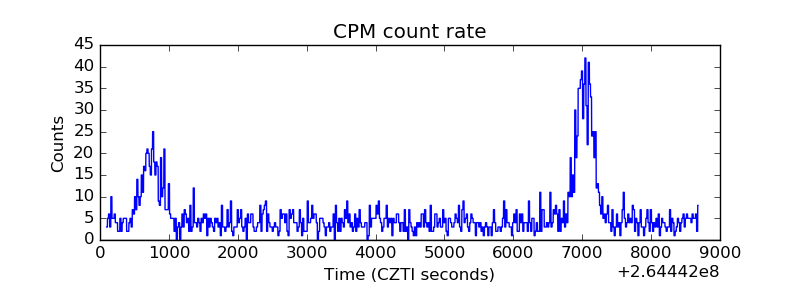 |
| CZT Counter | 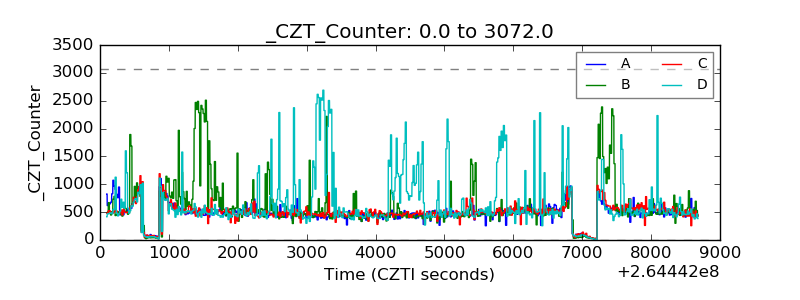 |
| +2.5 Volts monitor |  |
| +5 Volts monitor |  |
| _ROLL_ROT |  |
| _Roll_DEC | 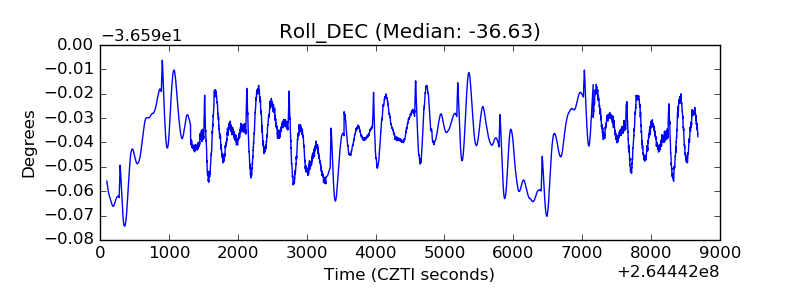 |
| _Roll_RA | 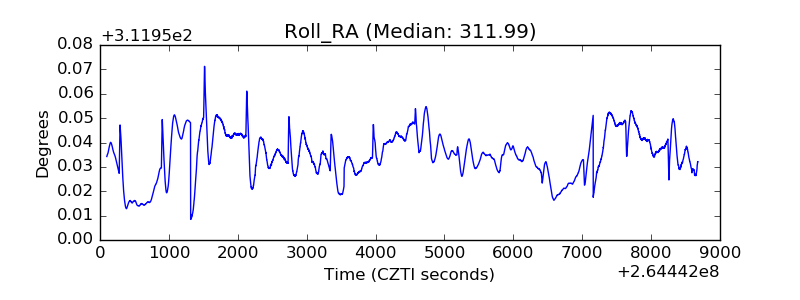 |
| Veto Counter |  |