| Param | Original file | Final file |
|---|---|---|
| Filename | modeM0/AS1G08_014T01_9000002104_14280cztM0_level2.evt | modeM0/AS1G08_014T01_9000002104_14280cztM0_level2_quad_clean.evt |
| Size (bytes) | 1,500,298,560 | 244,152,000 |
| Size | 1.4 GB | 232.8 MB |
| Events in quadrant A | 9,442,387 | 1,584,775 |
| Events in quadrant B | 11,189,311 | 1,574,372 |
| Events in quadrant C | 10,106,182 | 1,488,292 |
| Events in quadrant D | 13,428,439 | 1,450,146 |
| Mode M9 | |||
|---|---|---|---|
| Quadrant | BADHDUFLAG | Total packets | Discarded packets |
| A | 0 | 25 | 0 |
| B | 0 | 25 | 0 |
| C | 0 | 25 | 0 |
| D | 0 | 25 | 0 |
| Mode SS | |||
|---|---|---|---|
| Quadrant | BADHDUFLAG | Total packets | Discarded packets |
| A | 0 | 384 | 0 |
| B | 0 | 384 | 0 |
| C | 0 | 384 | 0 |
| D | 0 | 384 | 0 |
| Mode M0 | |||
|---|---|---|---|
| Quadrant | BADHDUFLAG | Total packets | Discarded packets |
| A | 0 | 39788 | 5 |
| B | 0 | 45448 | 4 |
| C | 0 | 41266 | 4 |
| D | 0 | 52206 | 4 |
| Quadrant | Total seconds | Saturated seconds | Saturation percentage |
|---|---|---|---|
| A | 18829 | 159 | 0.844442% |
| B | 18829 | 987 | 5.241914% |
| C | 18829 | 138 | 0.732912% |
| D | 18829 | 752 | 3.993839% |
Noise dominated data is calculated using 1-second bins in cleaned event files. If a bin has >2000 counts, and if more than 50% of those come from <1% of pixels, then it is considered to be noise-dominated and hence unusable.
| Quadrant | # 1 sec bins | Bins with >0 counts | Bins with >2000 counts | High rate bins dominated by noise | Noise dominated (total time) | Noise dominated (detector-on time) | Marked lightcurve |
|---|---|---|---|---|---|---|---|
| A | 21335 | 18834 | 0 | 0 | 0.00% | 0.00% | 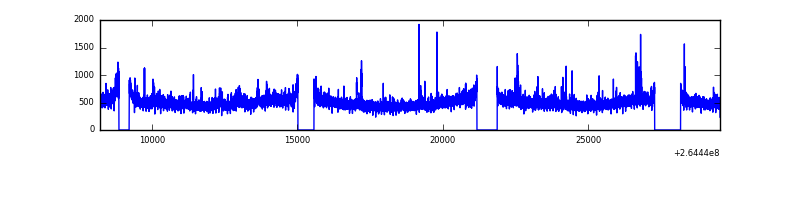 |
| B | 21335 | 18833 | 509 | 509 | 2.39% | 2.70% | 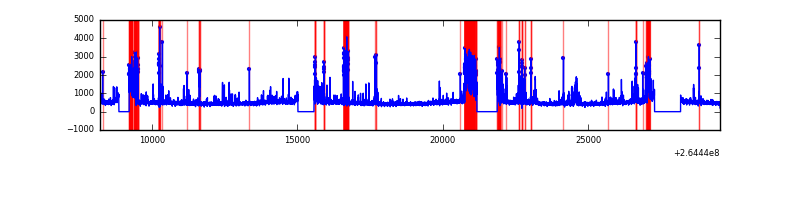 |
| C | 21335 | 18834 | 6 | 6 | 0.03% | 0.03% | 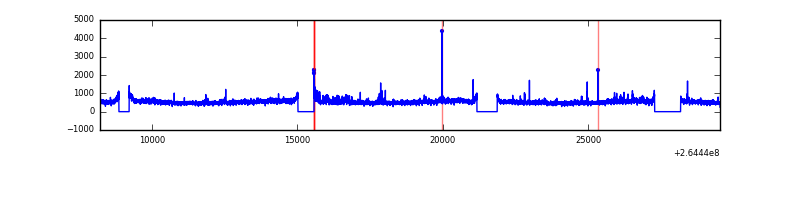 |
| D | 21335 | 18834 | 639 | 639 | 3.00% | 3.39% | 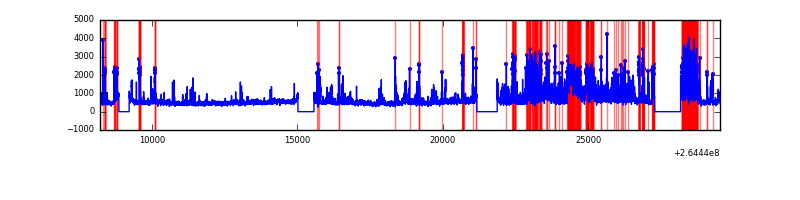 |
Top three noisy pixels from each quadrant. If the there are fewer than three noisy pixels in the level2.evt file, extra rows are filled as -1
| Pixel properties | Quadrant properties | ||||||
|---|---|---|---|---|---|---|---|
| Quadrant | DetID | PixID | Counts | Sigma | Mean | Median | Sigma |
| A | 8 | 15 | 318671 | 684.71 | 2274 | 2224 | 462.2 |
| A | 12 | 189 | 316849 | 680.76 | 2274 | 2224 | 462.2 |
| A | 9 | 143 | 61183 | 127.57 | 2274 | 2224 | 462.2 |
| B | 0 | 182 | 1462062 | 3456.85 | 2216 | 2157 | 422.3 |
| B | 0 | 229 | 766840 | 1810.66 | 2216 | 2157 | 422.3 |
| B | 3 | 209 | 91040 | 210.46 | 2216 | 2157 | 422.3 |
| C | 3 | 233 | 1585931 | 3126.64 | 2182 | 2193 | 506.5 |
| C | 13 | 61 | 15526 | 26.32 | 2182 | 2193 | 506.5 |
| C | 14 | 234 | 11628 | 18.63 | 2182 | 2193 | 506.5 |
| D | 5 | 222 | 2661792 | 5192.77 | 2165 | 2116 | 512.2 |
| D | 12 | 110 | 1452512 | 2831.76 | 2165 | 2116 | 512.2 |
| D | 8 | 195 | 382065 | 741.81 | 2165 | 2116 | 512.2 |
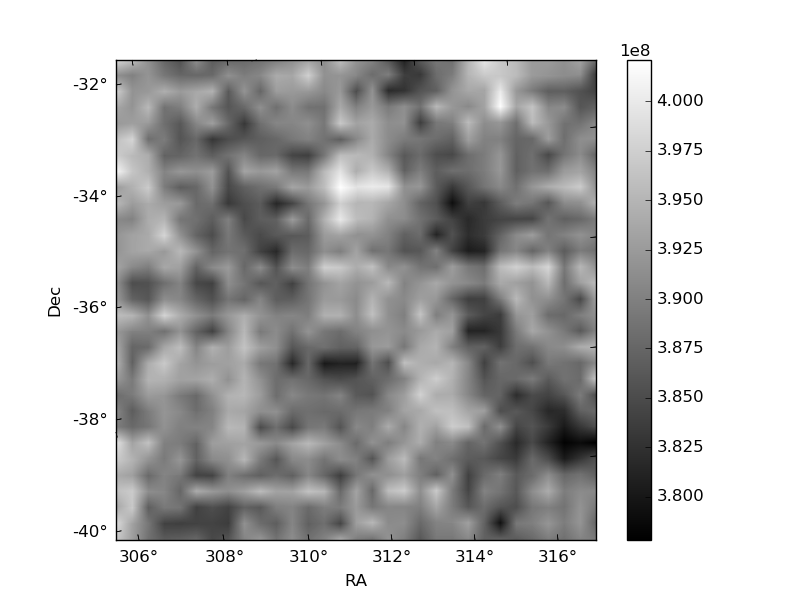
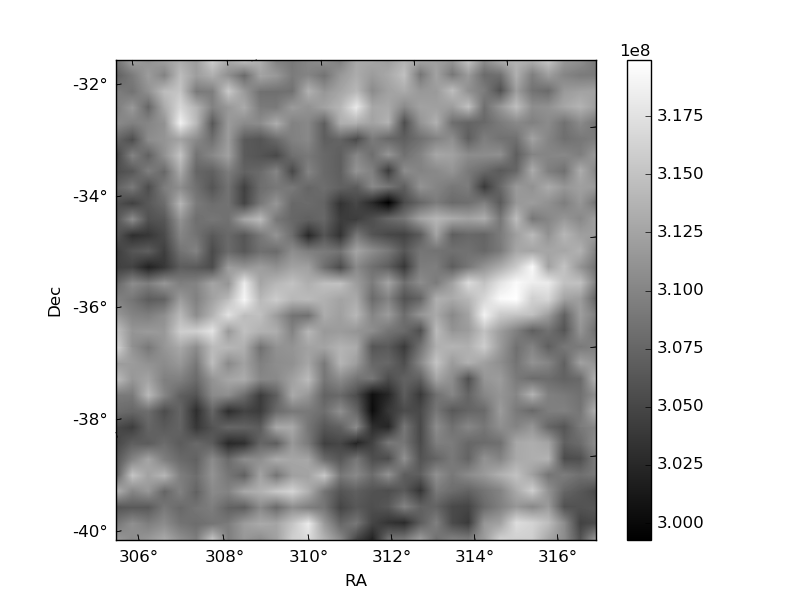
Histogram calculated using DETX and DETY for each event in the final _common_clean file
| Quadrant A | 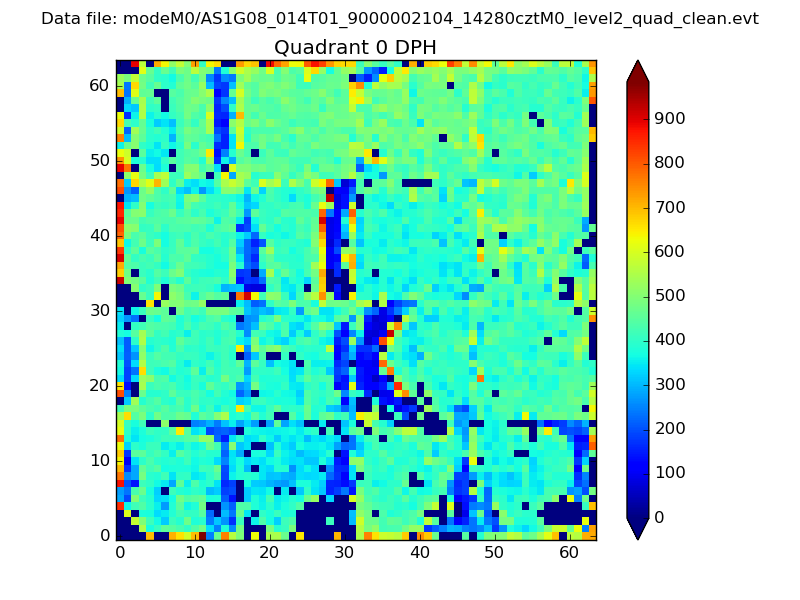 |
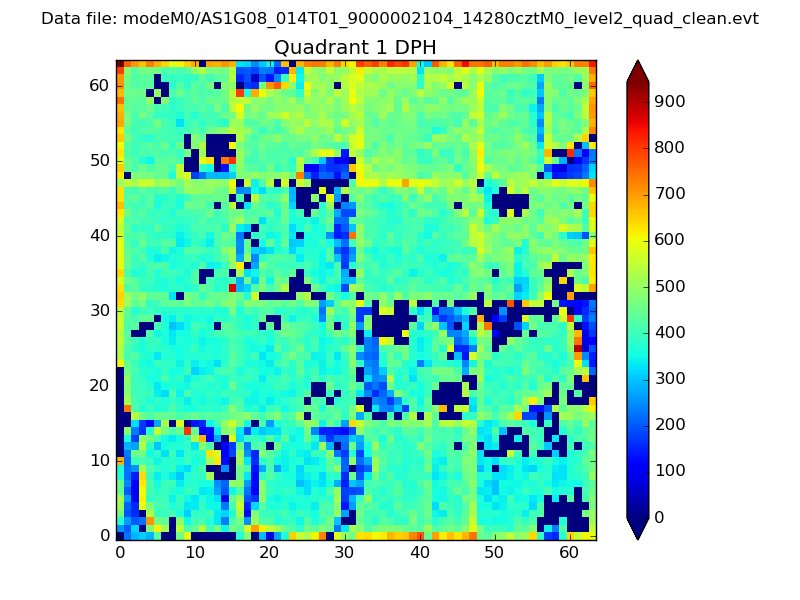 |
Quadrant B |
|---|---|---|---|
| Quadrant D |  |
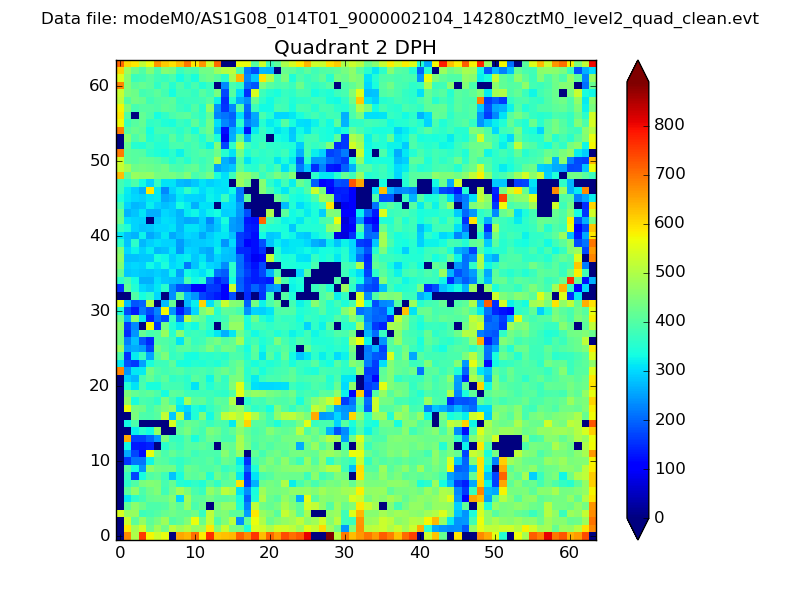 |
Quadrant C |
| Plot type | Count rate plots | Images |
|---|---|---|
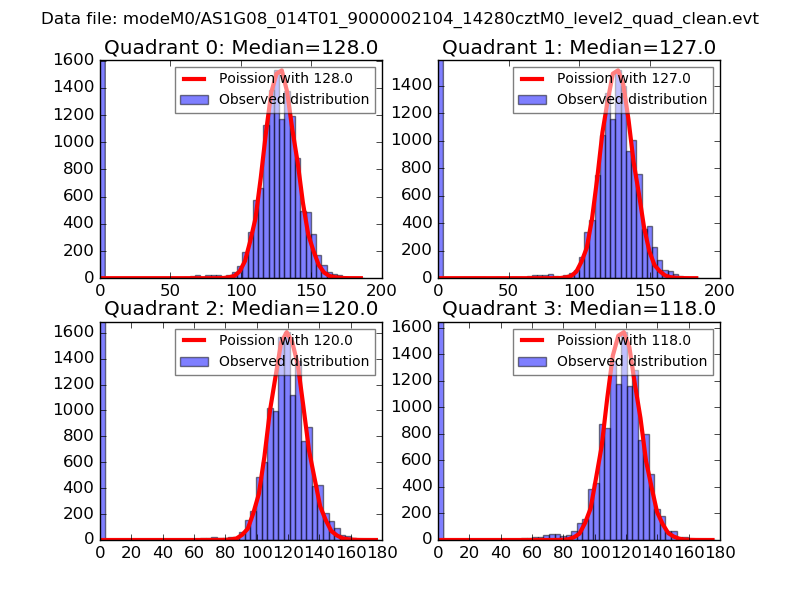
| Comparison with Poisson distribution Blue bars denote a histogram of data divided into 1 sec bins. Red curve is a Poisson curve with rate = median count rate of data. |
 |
 |
| Quadrant-wise count rates Data is divided into 100 sec bins |
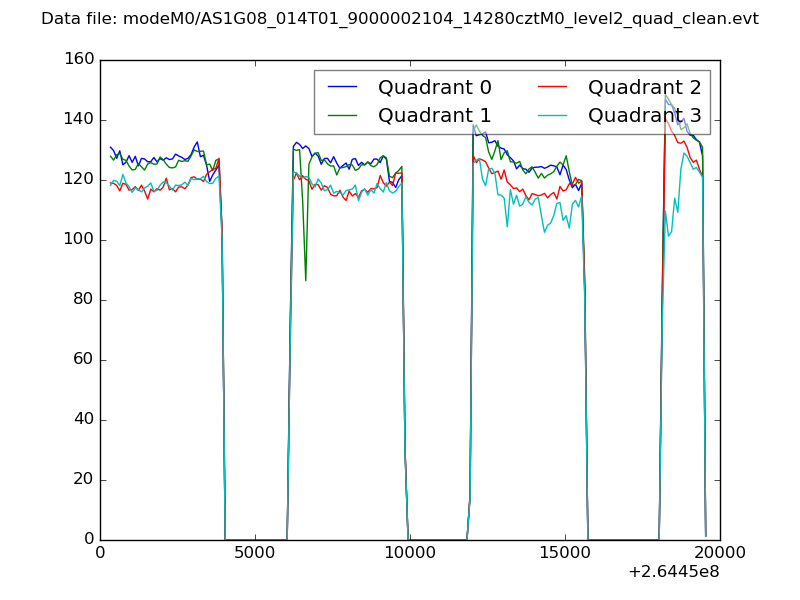 |
|
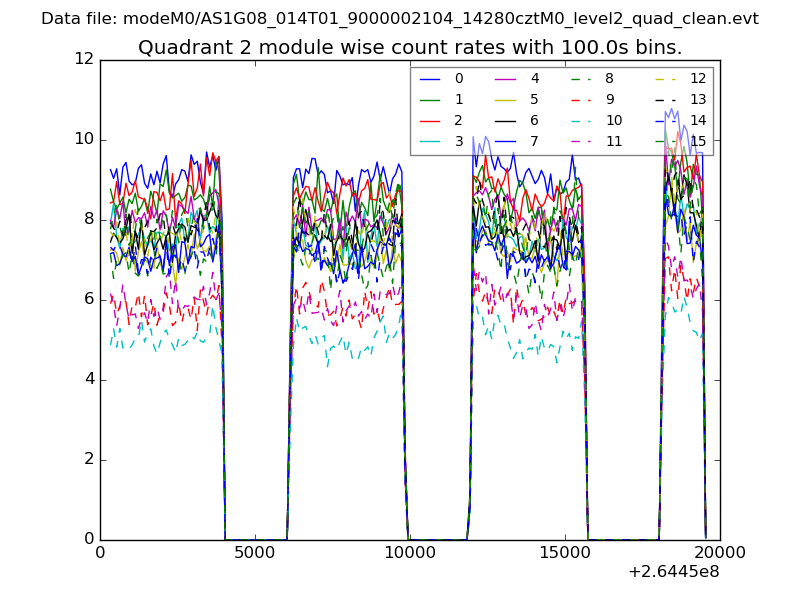
| Module-wise count rates for Quadrant A Data is divided into 100 sec bins |
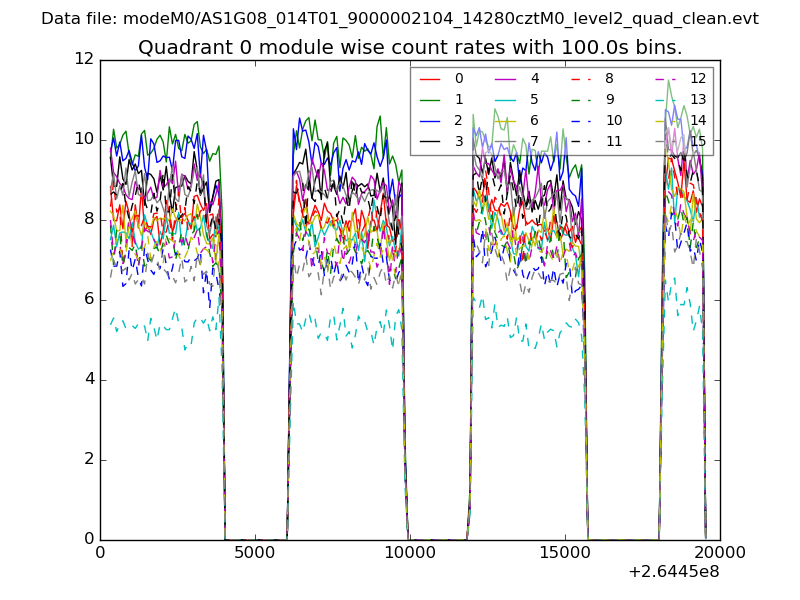 |
 |
| Module-wise count rates for Quadrant B Data is divided into 100 sec bins |
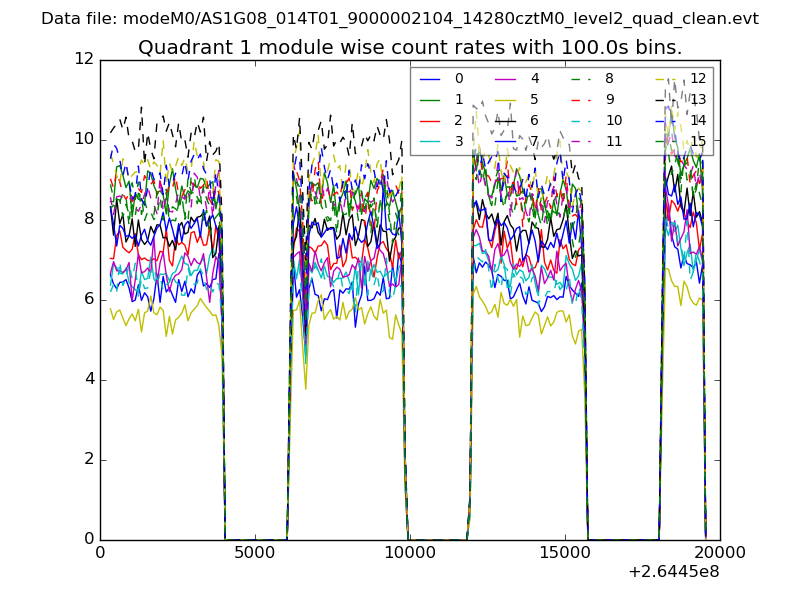 |
 |
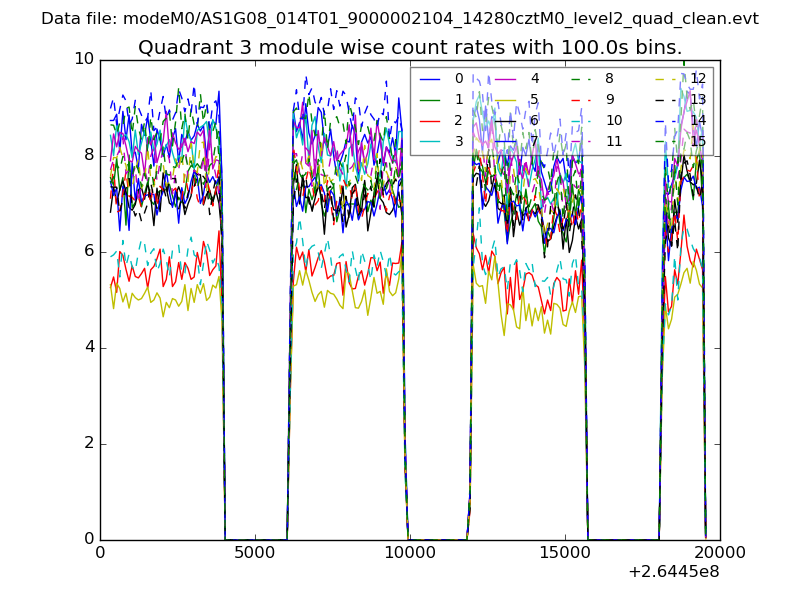
| Module-wise count rates for Quadrant C Data is divided into 100 sec bins |
 |
 |
| Module-wise count rates for Quadrant D Data is divided into 100 sec bins |
 |
 |
| Parameter | Plot |
|---|---|
| CZT HV Monitor | 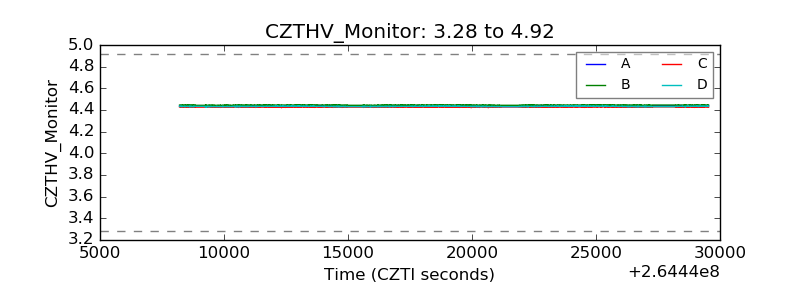 |
| D_VDD | 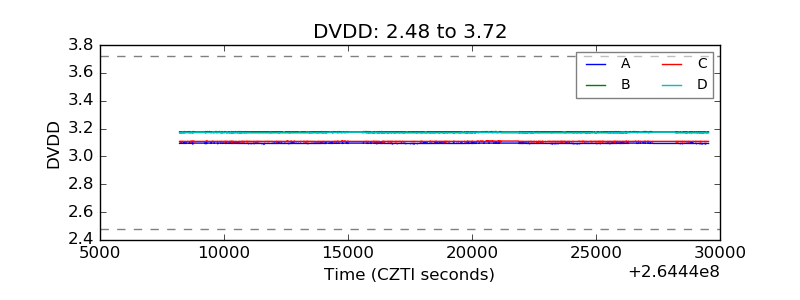 |
| Temperature 1 | 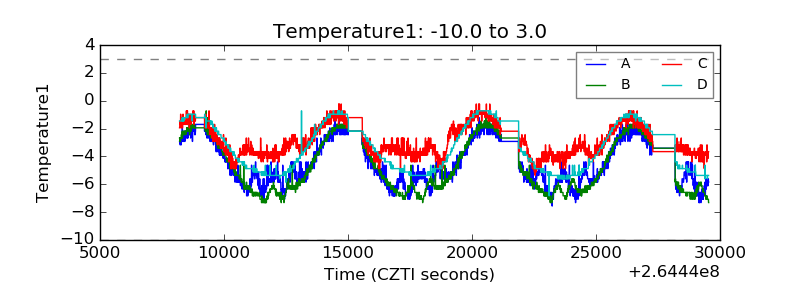 |
| Veto HV Monitor |  |
| Veto LLD | 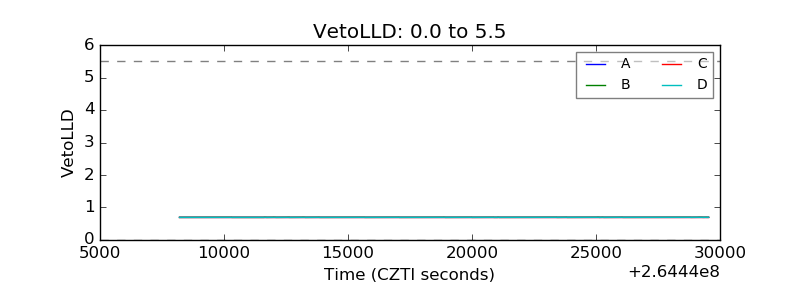 |
| Alpha Counter | 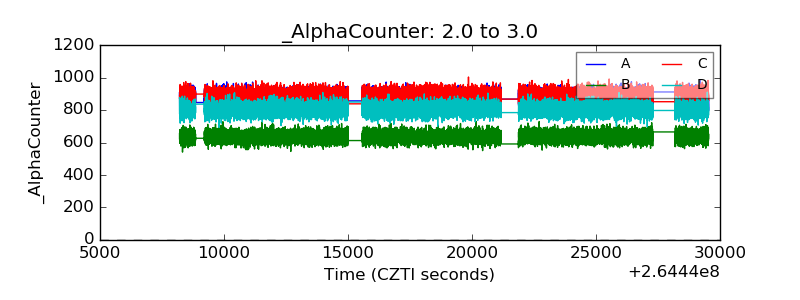 |
| _CPM_Rate |  |
| CZT Counter | 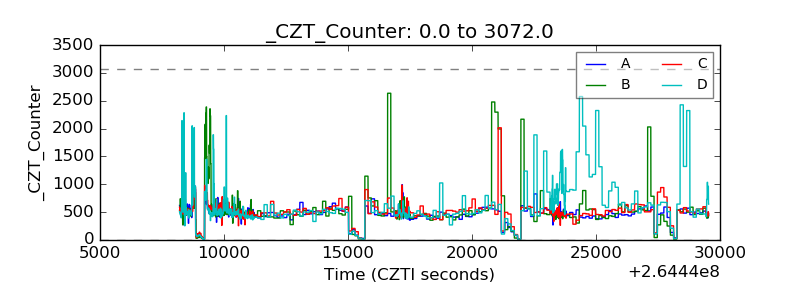 |
| +2.5 Volts monitor |  |
| +5 Volts monitor |  |
| _ROLL_ROT | 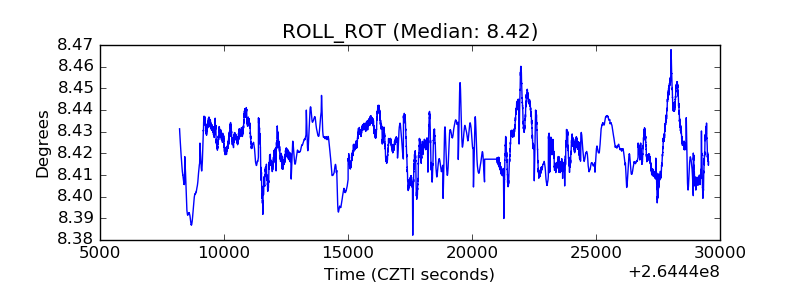 |
| _Roll_DEC | 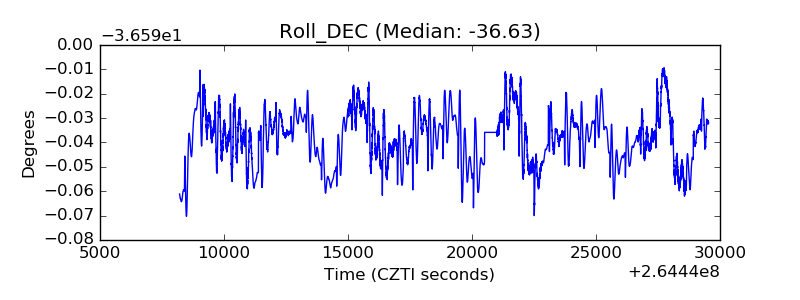 |
| _Roll_RA | 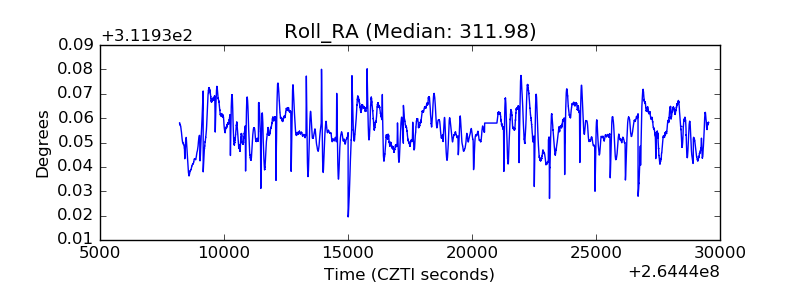 |
| Veto Counter | 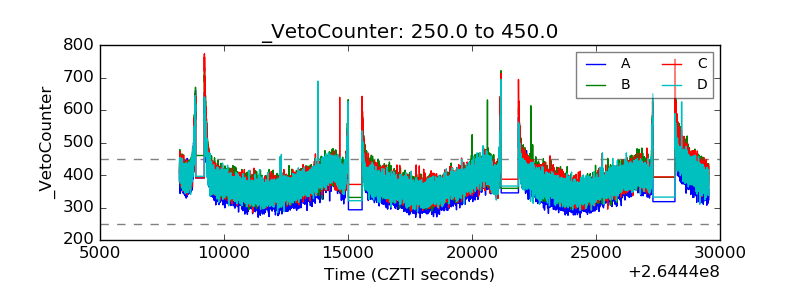 |