| Param | Original file | Final file |
|---|---|---|
| Filename | modeM0/AS1G08_014T01_9000002104_14281cztM0_level2.evt | modeM0/AS1G08_014T01_9000002104_14281cztM0_level2_quad_clean.evt |
| Size (bytes) | 518,477,760 | 95,978,880 |
| Size | 494.5 MB | 91.5 MB |
| Events in quadrant A | 3,259,831 | 630,573 |
| Events in quadrant B | 3,581,401 | 633,644 |
| Events in quadrant C | 3,380,452 | 603,923 |
| Events in quadrant D | 5,030,202 | 575,623 |
| Mode M9 | |||
|---|---|---|---|
| Quadrant | BADHDUFLAG | Total packets | Discarded packets |
| A | 0 | 19 | 0 |
| B | 0 | 19 | 0 |
| C | 0 | 19 | 0 |
| D | 0 | 19 | 0 |
| Mode SS | |||
|---|---|---|---|
| Quadrant | BADHDUFLAG | Total packets | Discarded packets |
| A | 0 | 136 | 0 |
| B | 0 | 136 | 0 |
| C | 0 | 136 | 0 |
| D | 0 | 136 | 0 |
| Mode M0 | |||
|---|---|---|---|
| Quadrant | BADHDUFLAG | Total packets | Discarded packets |
| A | 0 | 13913 | 3 |
| B | 0 | 14891 | 2 |
| C | 0 | 14067 | 2 |
| D | 0 | 19271 | 2 |
| Quadrant | Total seconds | Saturated seconds | Saturation percentage |
|---|---|---|---|
| A | 6641 | 33 | 0.496913% |
| B | 6641 | 109 | 1.641319% |
| C | 6641 | 39 | 0.587261% |
| D | 6641 | 366 | 5.511218% |
Noise dominated data is calculated using 1-second bins in cleaned event files. If a bin has >2000 counts, and if more than 50% of those come from <1% of pixels, then it is considered to be noise-dominated and hence unusable.
| Quadrant | # 1 sec bins | Bins with >0 counts | Bins with >2000 counts | High rate bins dominated by noise | Noise dominated (total time) | Noise dominated (detector-on time) | Marked lightcurve |
|---|---|---|---|---|---|---|---|
| A | 8532 | 6644 | 0 | 0 | 0.00% | 0.00% | 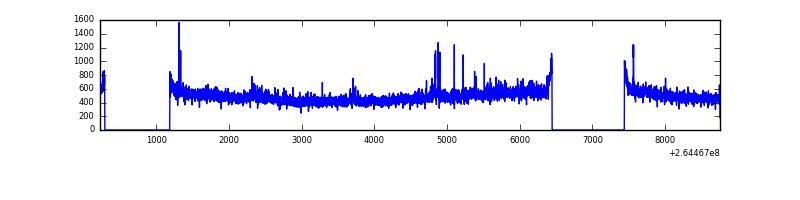 |
| B | 8532 | 6644 | 29 | 29 | 0.34% | 0.44% | 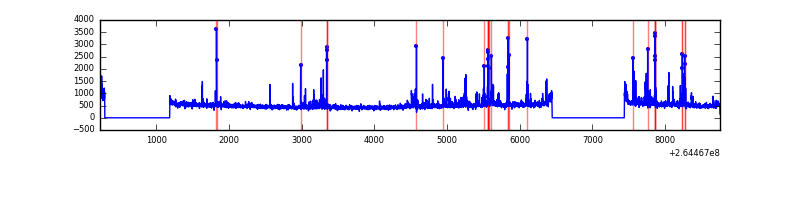 |
| C | 8532 | 6644 | 3 | 3 | 0.04% | 0.05% | 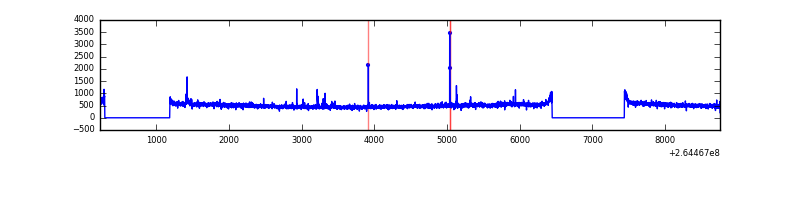 |
| D | 8532 | 6644 | 291 | 291 | 3.41% | 4.38% | 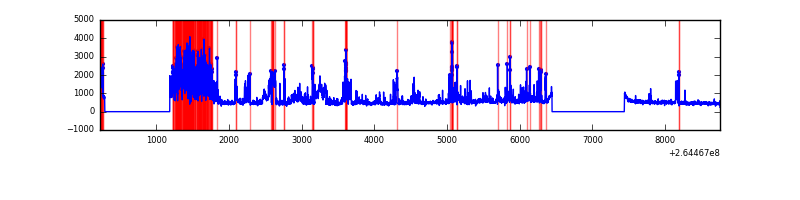 |
Top three noisy pixels from each quadrant. If the there are fewer than three noisy pixels in the level2.evt file, extra rows are filled as -1
| Pixel properties | Quadrant properties | ||||||
|---|---|---|---|---|---|---|---|
| Quadrant | DetID | PixID | Counts | Sigma | Mean | Median | Sigma |
| A | 12 | 189 | 84145 | 504.93 | 812 | 793 | 165.1 |
| A | 8 | 15 | 31562 | 186.39 | 812 | 793 | 165.1 |
| A | 9 | 143 | 14511 | 83.1 | 812 | 793 | 165.1 |
| B | 0 | 229 | 202820 | 1298.18 | 812 | 793 | 155.6 |
| B | 10 | 245 | 109353 | 697.58 | 812 | 793 | 155.6 |
| B | 4 | 48 | 40050 | 252.26 | 812 | 793 | 155.6 |
| C | 3 | 233 | 280695 | 1522.49 | 791 | 796 | 183.8 |
| C | 14 | 234 | 18916 | 98.56 | 791 | 796 | 183.8 |
| C | 13 | 61 | 5603 | 26.15 | 791 | 796 | 183.8 |
| D | 5 | 222 | 1290375 | 7024.5 | 776 | 758 | 183.6 |
| D | 12 | 110 | 507276 | 2758.99 | 776 | 758 | 183.6 |
| D | 8 | 195 | 138861 | 752.24 | 776 | 758 | 183.6 |
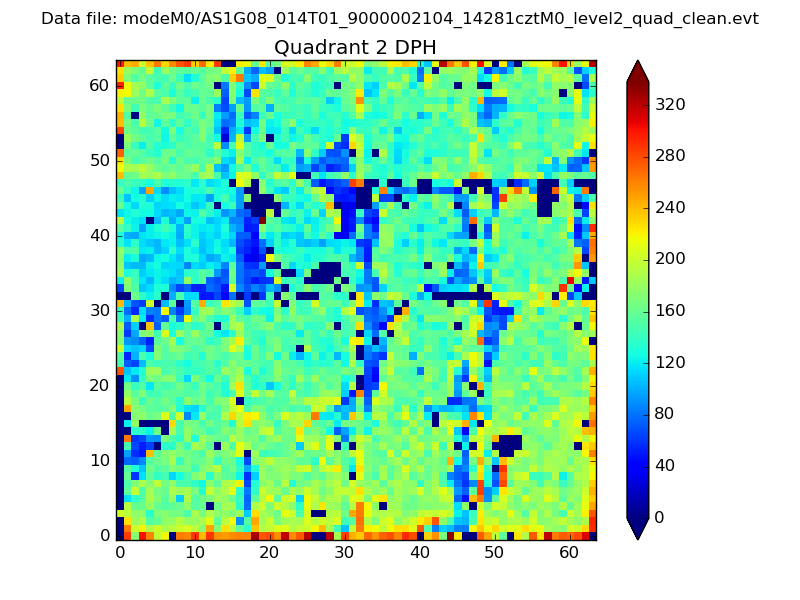
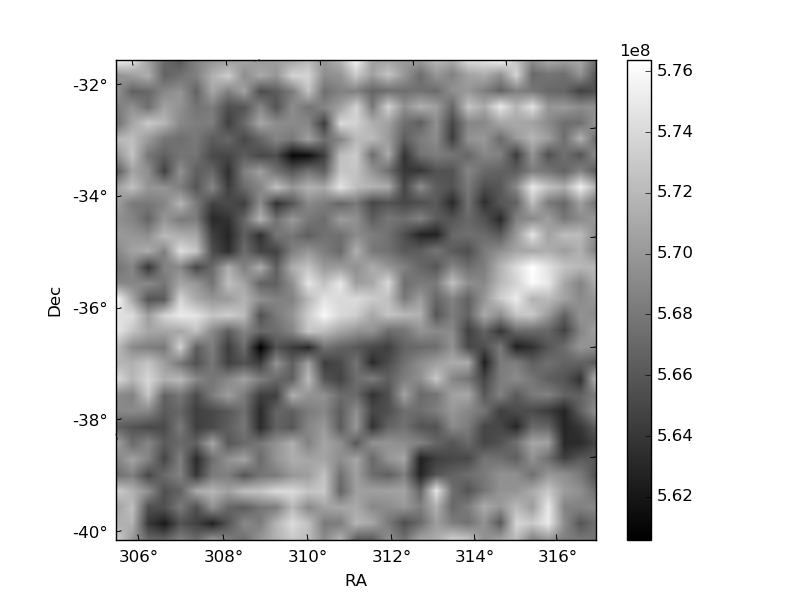
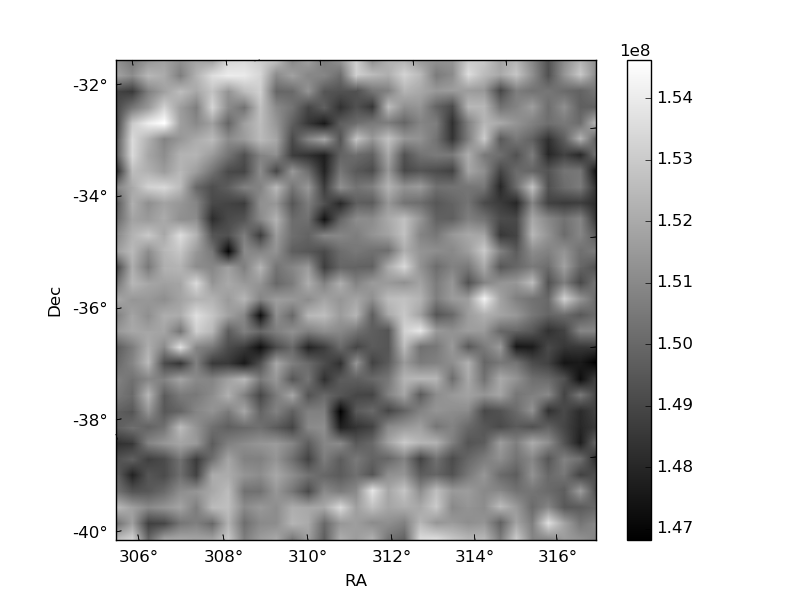
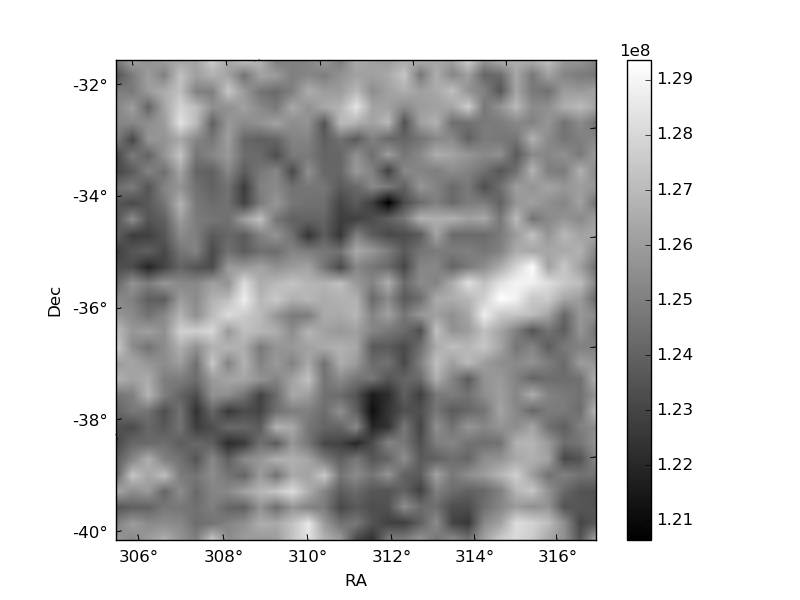
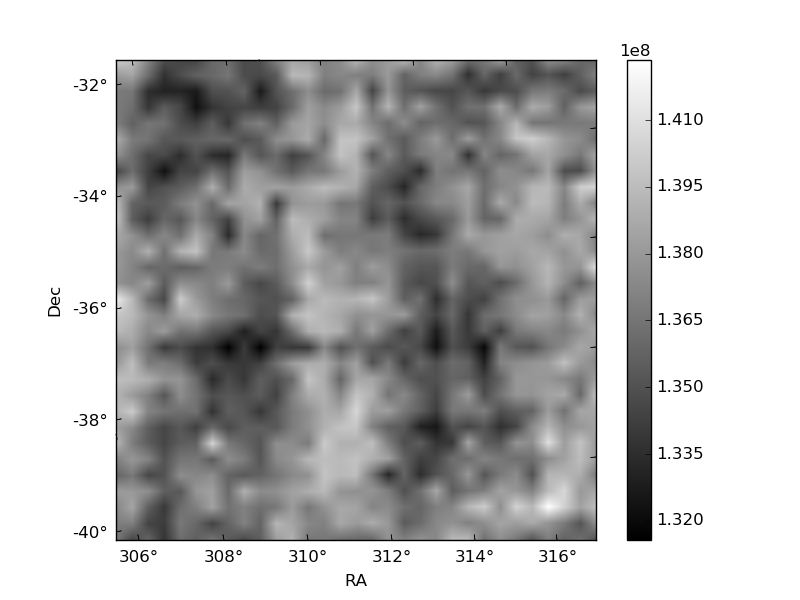
Histogram calculated using DETX and DETY for each event in the final _common_clean file
| Quadrant A | 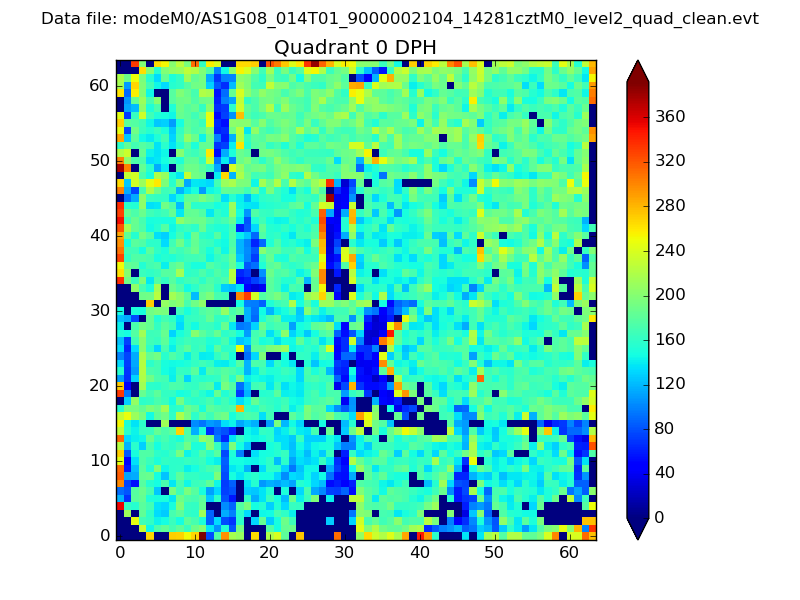 |
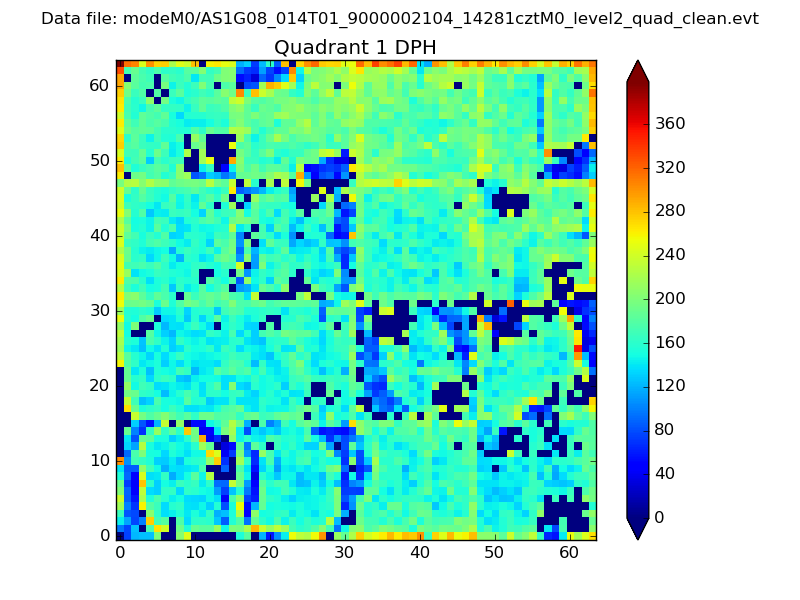 |
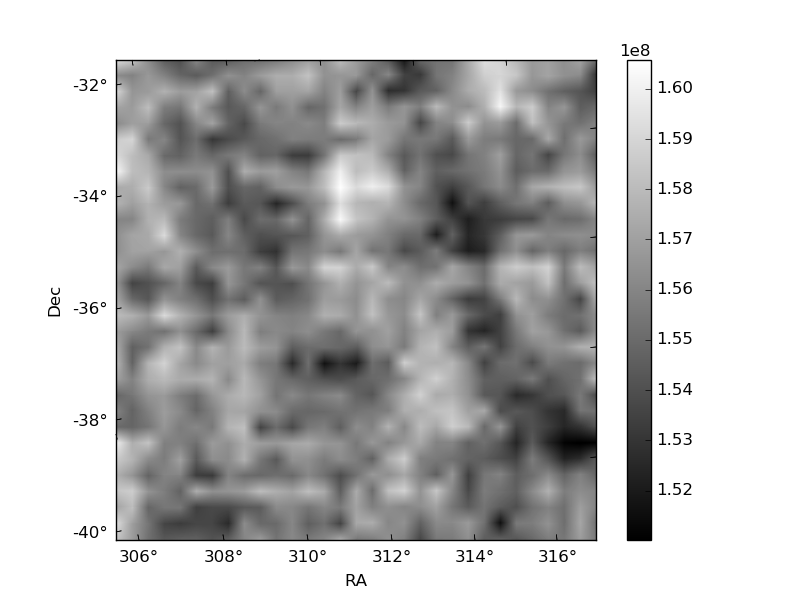
Quadrant B |
|---|---|---|---|
| Quadrant D | 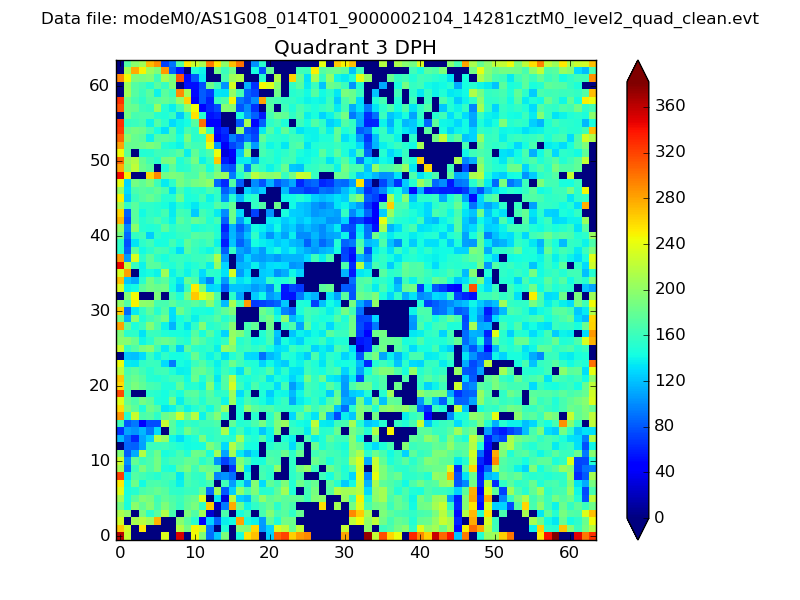 |
 |
Quadrant C |
| Plot type | Count rate plots | Images |
|---|---|---|
| Comparison with Poisson distribution Blue bars denote a histogram of data divided into 1 sec bins. Red curve is a Poisson curve with rate = median count rate of data. |
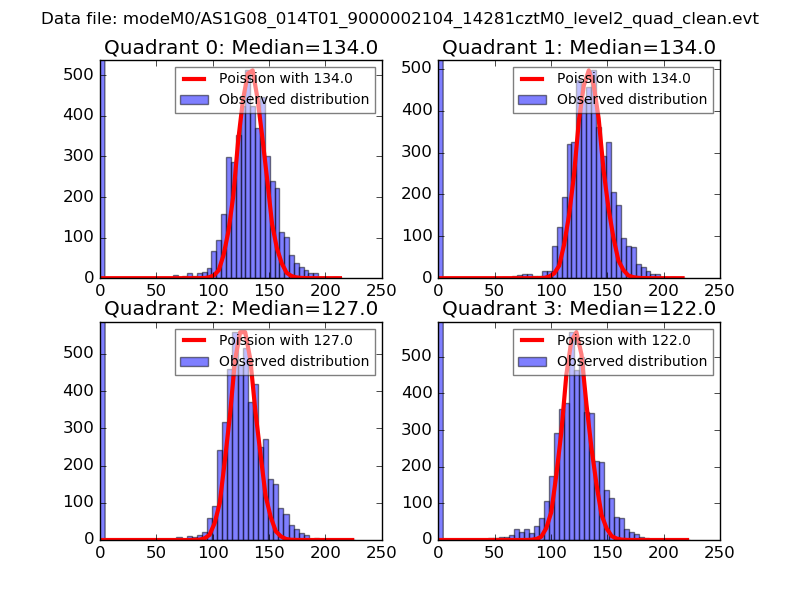 |
 |
| Quadrant-wise count rates Data is divided into 100 sec bins |
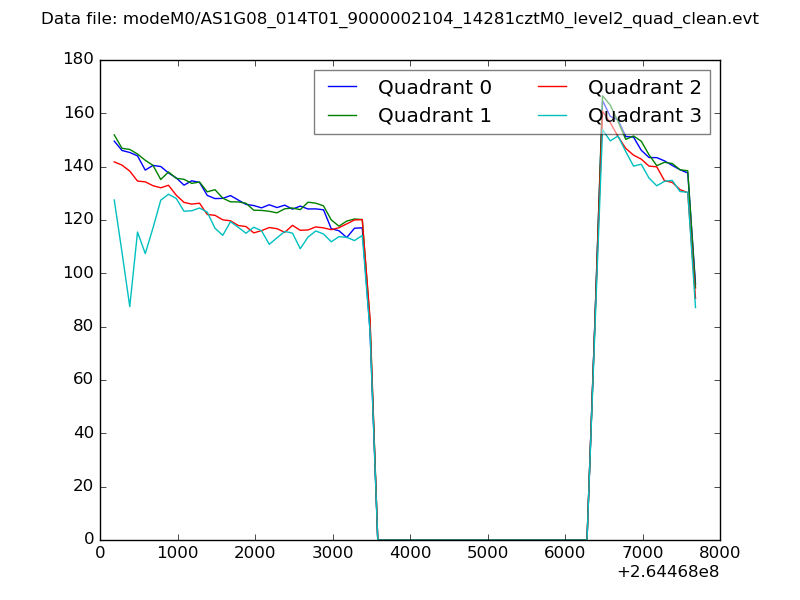 |
|
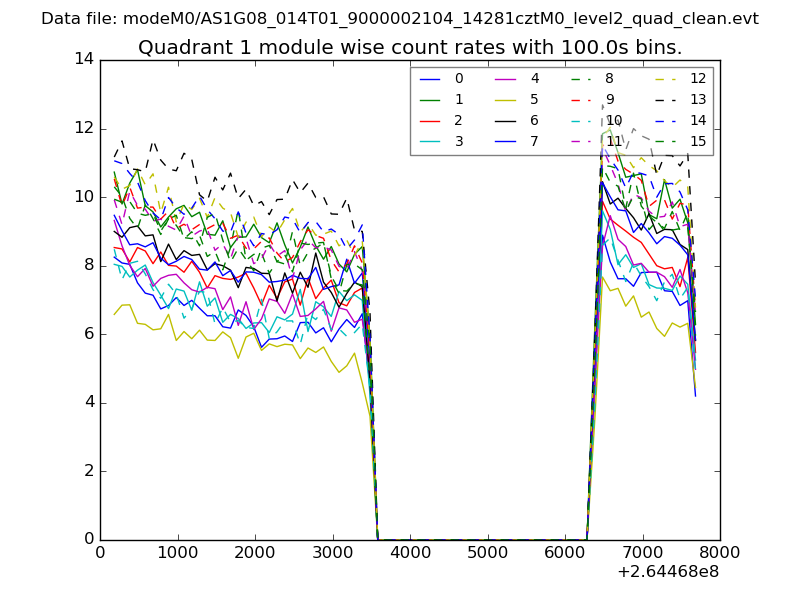
| Module-wise count rates for Quadrant A Data is divided into 100 sec bins |
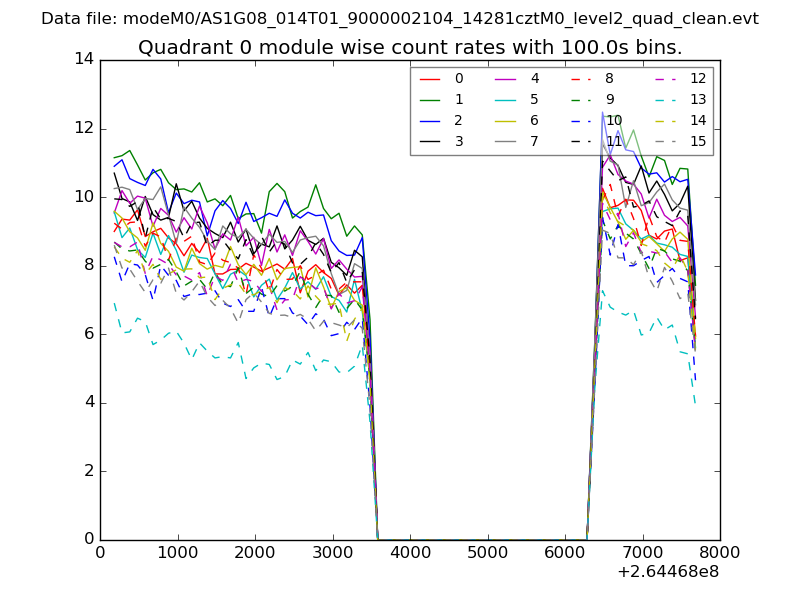 |
 |
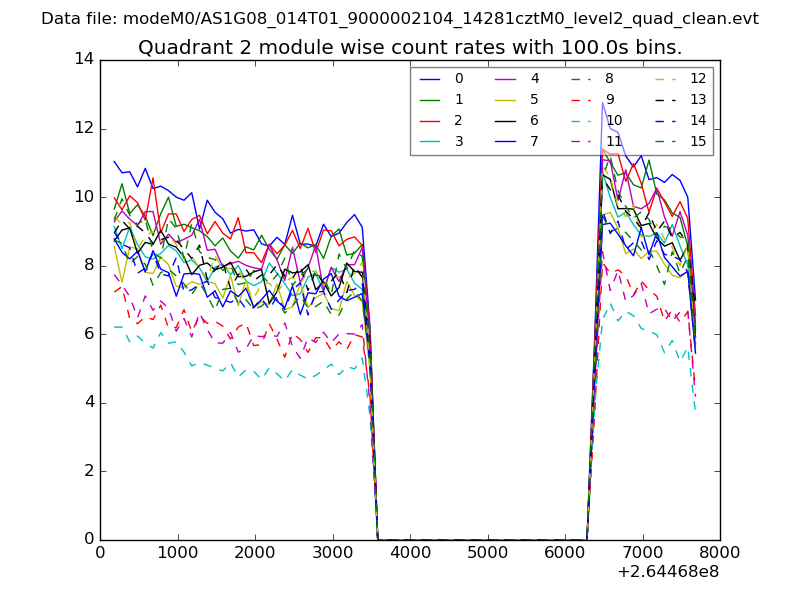
| Module-wise count rates for Quadrant B Data is divided into 100 sec bins |
 |
 |
| Module-wise count rates for Quadrant C Data is divided into 100 sec bins |
 |
 |
| Module-wise count rates for Quadrant D Data is divided into 100 sec bins |
 |
 |
| Parameter | Plot |
|---|---|
| CZT HV Monitor | 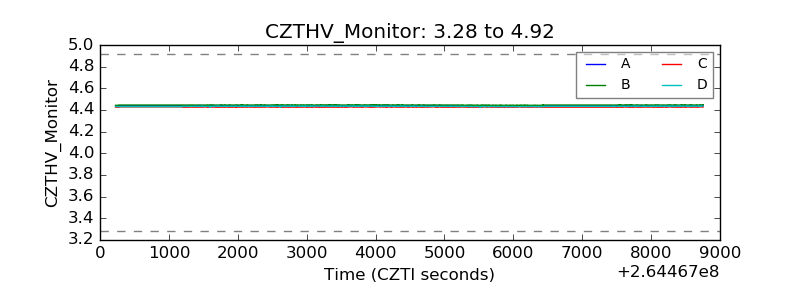 |
| D_VDD | 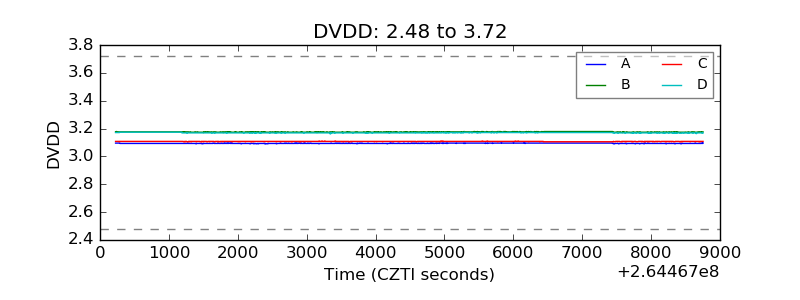 |
| Temperature 1 | 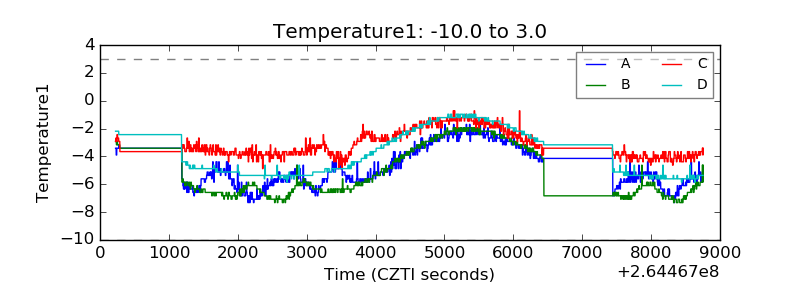 |
| Veto HV Monitor | 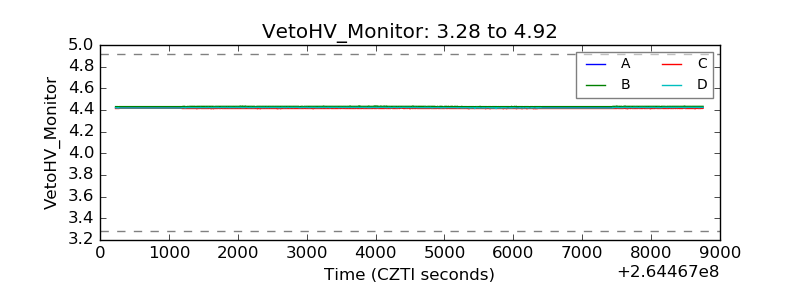 |
| Veto LLD | 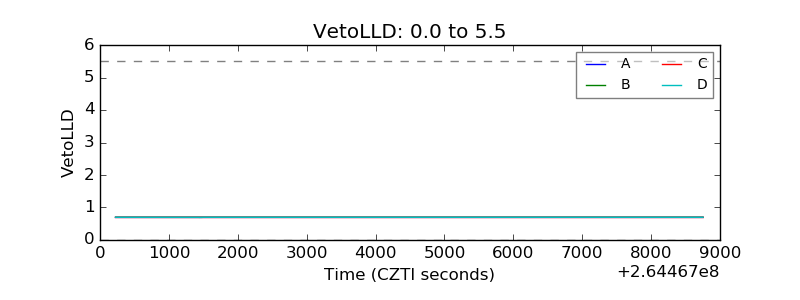 |
| Alpha Counter | 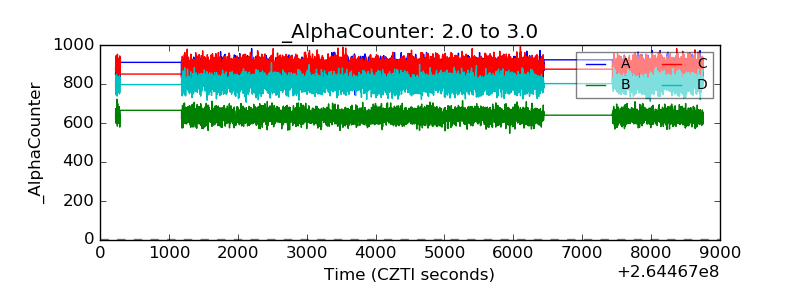 |
| _CPM_Rate | 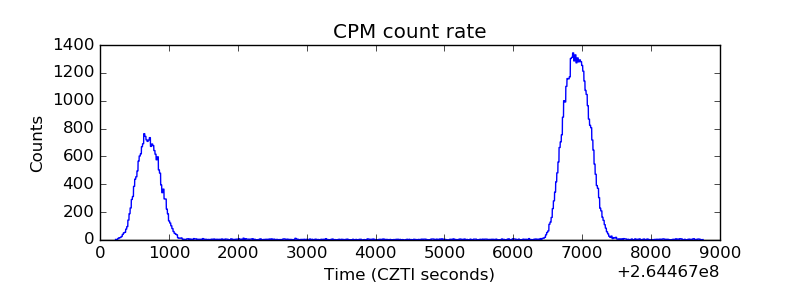 |
| CZT Counter | 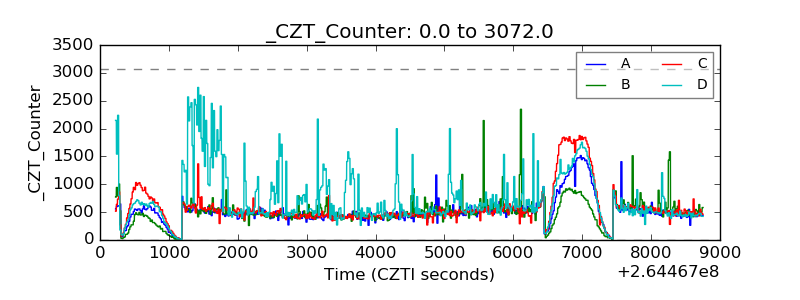 |
| +2.5 Volts monitor |  |
| +5 Volts monitor |  |
| _ROLL_ROT |  |
| _Roll_DEC | 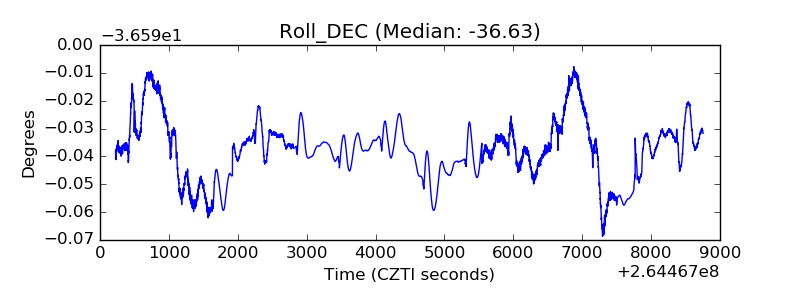 |
| _Roll_RA | 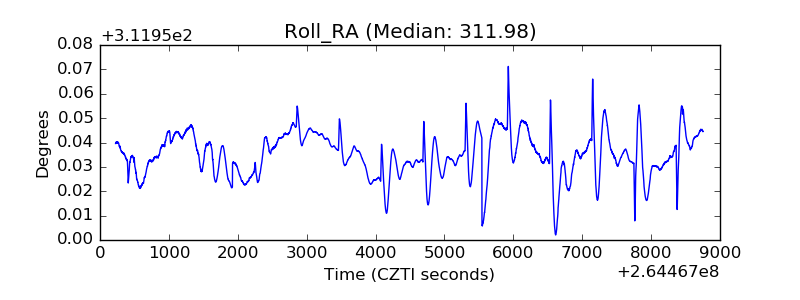 |
| Veto Counter |  |