| Param | Original file | Final file |
|---|---|---|
| Filename | modeM0/AS1G08_014T01_9000002104_14285cztM0_level2.evt | modeM0/AS1G08_014T01_9000002104_14285cztM0_level2_quad_clean.evt |
| Size (bytes) | 555,719,040 | 102,407,040 |
| Size | 530.0 MB | 97.7 MB |
| Events in quadrant A | 3,386,354 | 677,952 |
| Events in quadrant B | 3,946,339 | 678,028 |
| Events in quadrant C | 3,849,746 | 649,792 |
| Events in quadrant D | 5,201,850 | 636,402 |
| Mode M9 | |||
|---|---|---|---|
| Quadrant | BADHDUFLAG | Total packets | Discarded packets |
| A | 0 | 13 | 0 |
| B | 0 | 13 | 0 |
| C | 0 | 13 | 0 |
| D | 0 | 13 | 0 |
| Mode SS | |||
|---|---|---|---|
| Quadrant | BADHDUFLAG | Total packets | Discarded packets |
| A | 0 | 134 | 0 |
| B | 0 | 134 | 0 |
| C | 0 | 134 | 0 |
| D | 0 | 134 | 0 |
| Mode M0 | |||
|---|---|---|---|
| Quadrant | BADHDUFLAG | Total packets | Discarded packets |
| A | 0 | 13829 | 2 |
| B | 0 | 15707 | 1 |
| C | 0 | 15386 | 1 |
| D | 0 | 19780 | 1 |
| Quadrant | Total seconds | Saturated seconds | Saturation percentage |
|---|---|---|---|
| A | 6584 | 49 | 0.744228% |
| B | 6584 | 150 | 2.278250% |
| C | 6584 | 43 | 0.653098% |
| D | 6584 | 102 | 1.549210% |
Noise dominated data is calculated using 1-second bins in cleaned event files. If a bin has >2000 counts, and if more than 50% of those come from <1% of pixels, then it is considered to be noise-dominated and hence unusable.
| Quadrant | # 1 sec bins | Bins with >0 counts | Bins with >2000 counts | High rate bins dominated by noise | Noise dominated (total time) | Noise dominated (detector-on time) | Marked lightcurve |
|---|---|---|---|---|---|---|---|
| A | 7855 | 6586 | 0 | 0 | 0.00% | 0.00% |  |
| B | 7855 | 6586 | 57 | 57 | 0.73% | 0.87% | 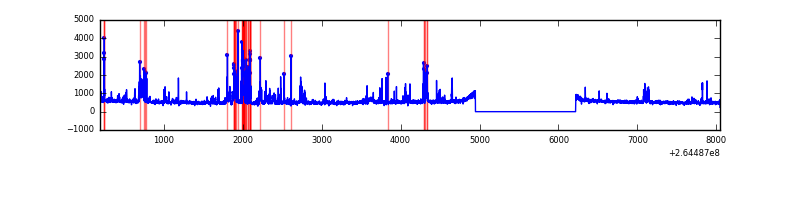 |
| C | 7855 | 6586 | 3 | 3 | 0.04% | 0.05% | 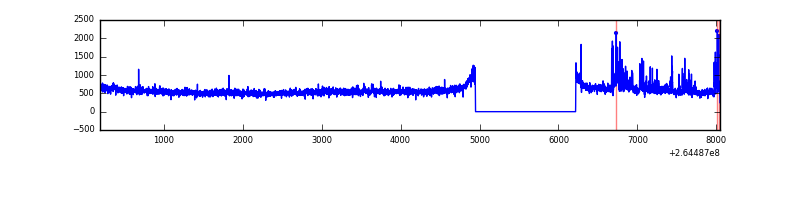 |
| D | 7855 | 6586 | 53 | 53 | 0.67% | 0.80% | 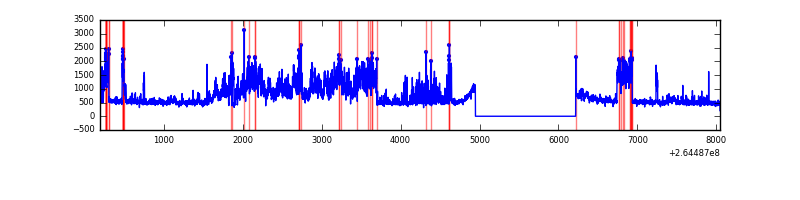 |
Top three noisy pixels from each quadrant. If the there are fewer than three noisy pixels in the level2.evt file, extra rows are filled as -1
| Pixel properties | Quadrant properties | ||||||
|---|---|---|---|---|---|---|---|
| Quadrant | DetID | PixID | Counts | Sigma | Mean | Median | Sigma |
| A | 12 | 189 | 33775 | 188.27 | 871 | 855 | 174.9 |
| A | 0 | 226 | 7742 | 39.39 | 871 | 855 | 174.9 |
| A | 12 | 194 | 6647 | 33.13 | 871 | 855 | 174.9 |
| B | 10 | 245 | 365716 | 2291.18 | 853 | 834 | 159.3 |
| B | 0 | 229 | 165623 | 1034.75 | 853 | 834 | 159.3 |
| B | 10 | 244 | 29410 | 179.44 | 853 | 834 | 159.3 |
| C | 3 | 233 | 578474 | 2996.13 | 838 | 847 | 192.8 |
| C | 13 | 61 | 5998 | 26.72 | 838 | 847 | 192.8 |
| C | 10 | 22 | 3524 | 13.89 | 838 | 847 | 192.8 |
| D | 12 | 110 | 1724246 | 8604.52 | 845 | 828 | 200.3 |
| D | 5 | 222 | 202094 | 1004.86 | 845 | 828 | 200.3 |
| D | 2 | 152 | 41416 | 202.64 | 845 | 828 | 200.3 |
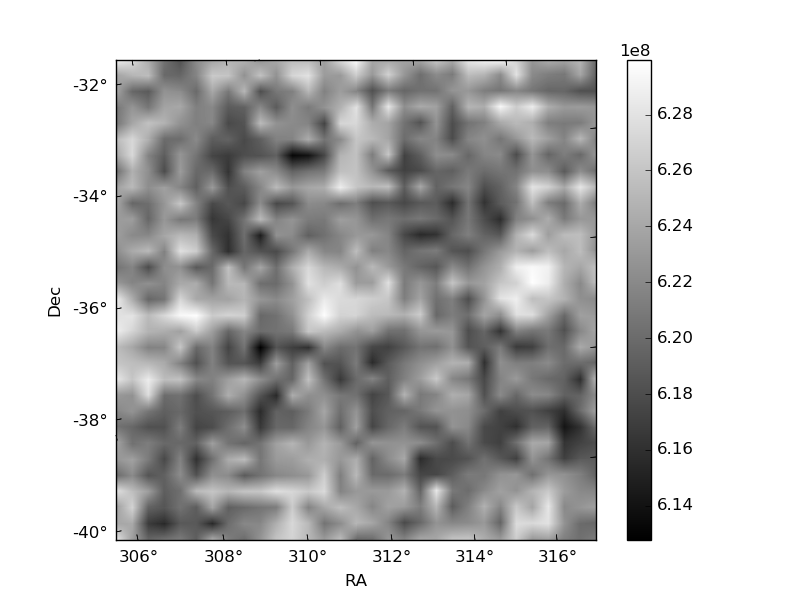
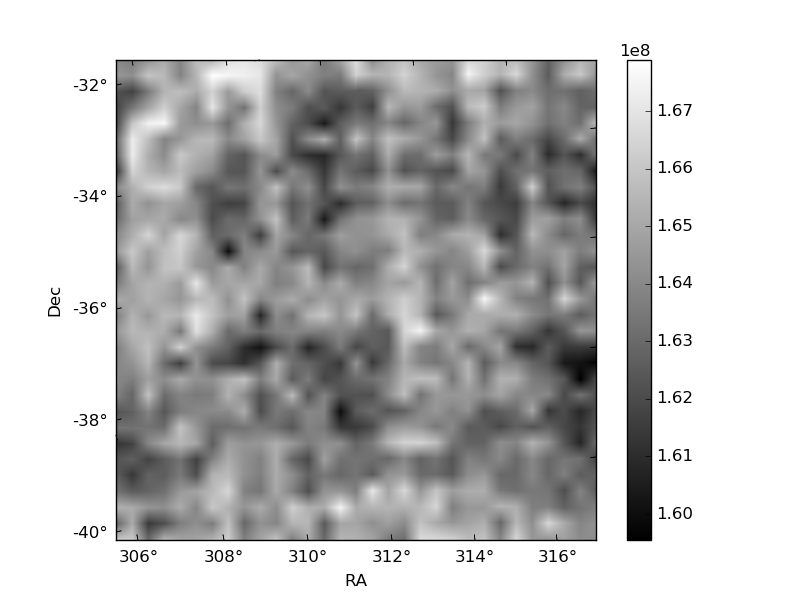
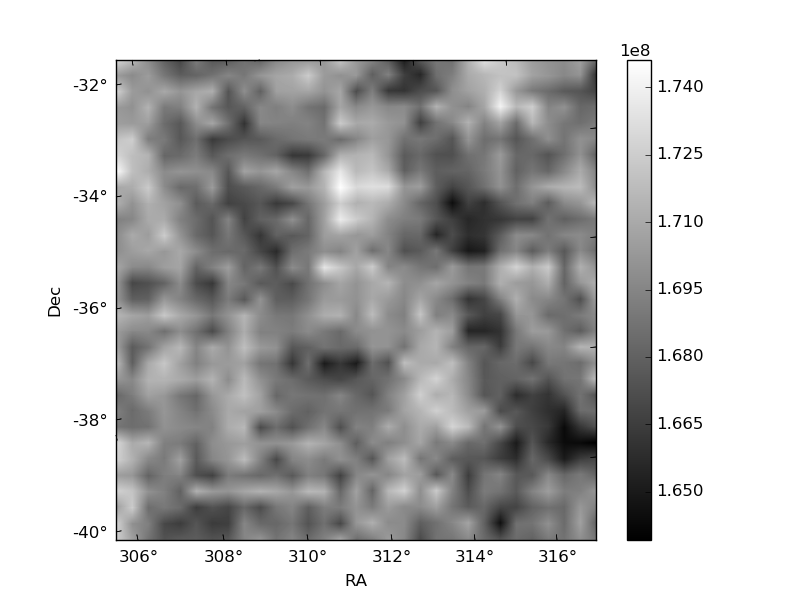
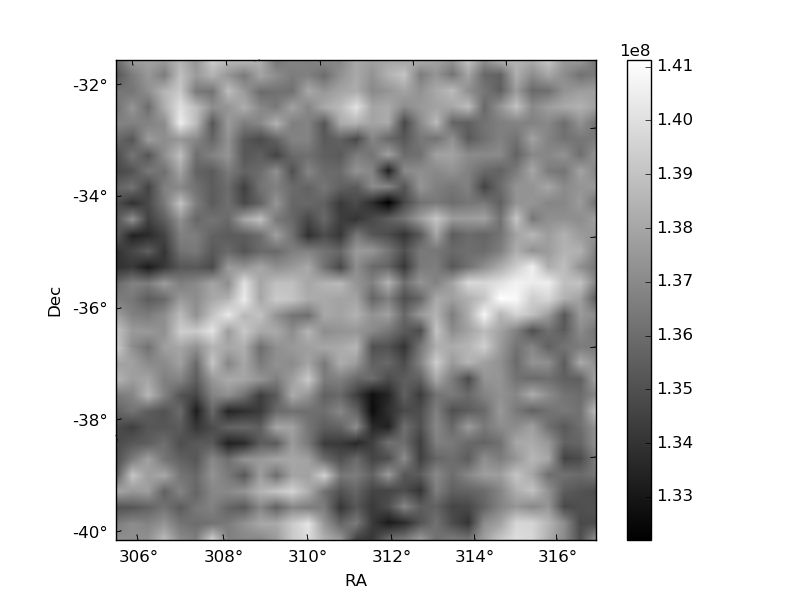
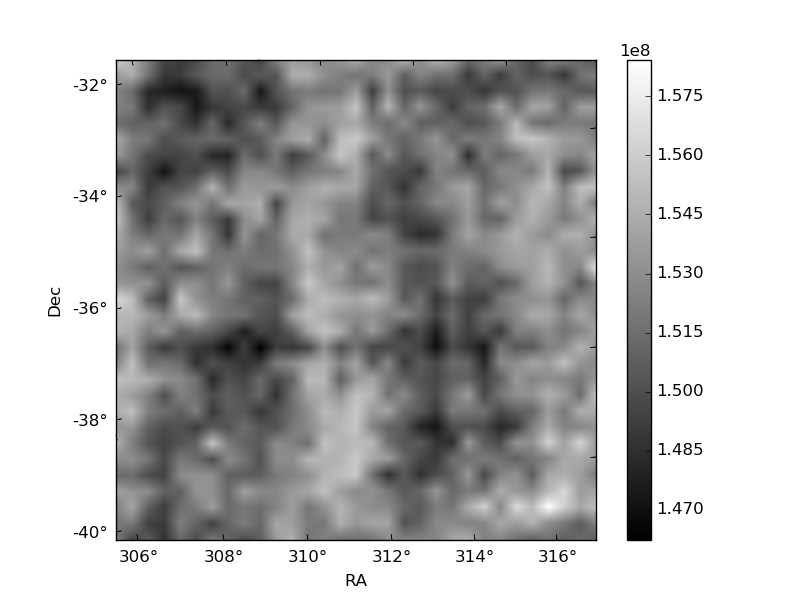
Histogram calculated using DETX and DETY for each event in the final _common_clean file
| Quadrant A | 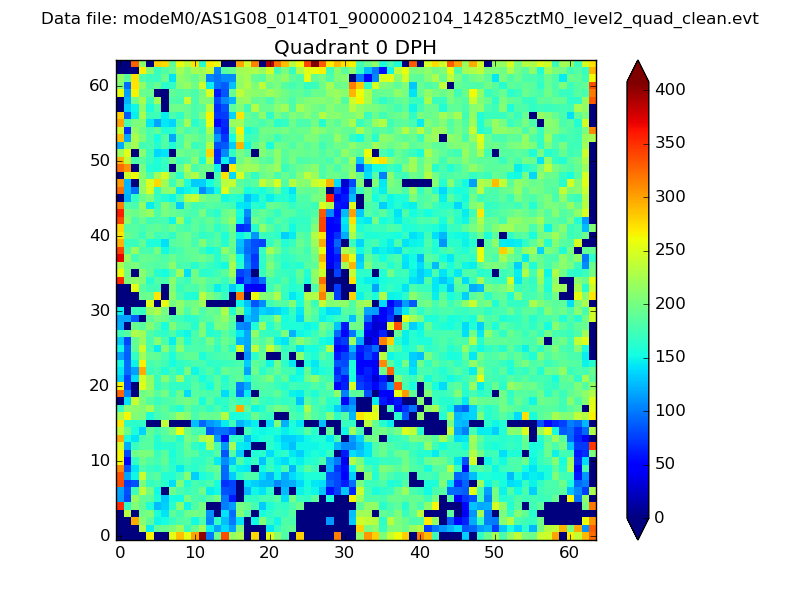 |
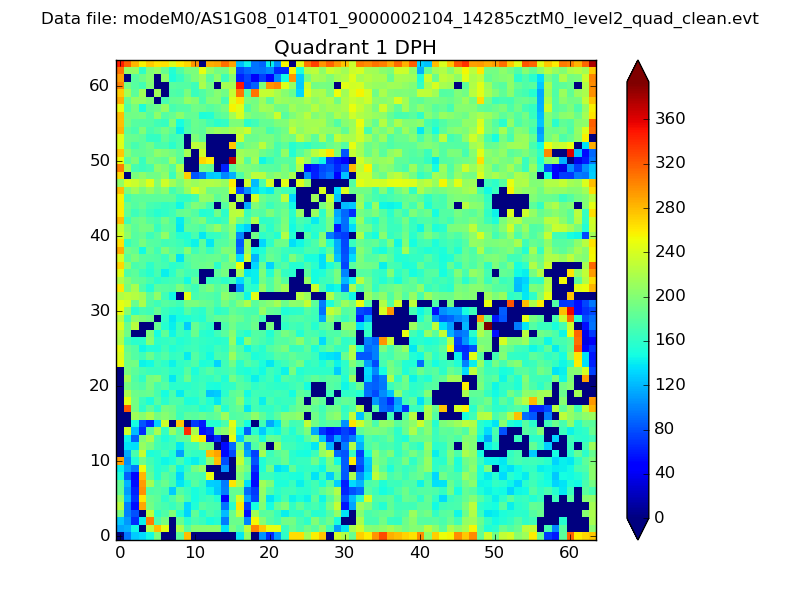 |
Quadrant B |
|---|---|---|---|
| Quadrant D | 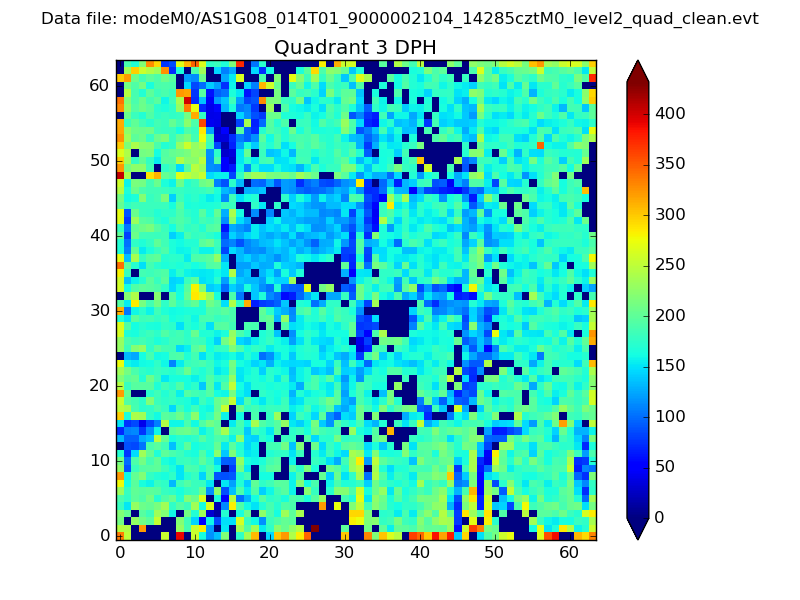 |
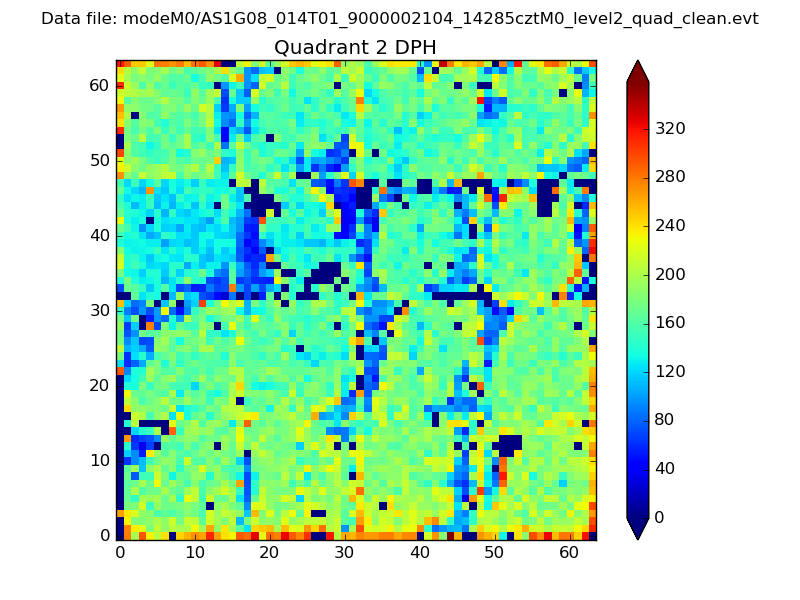 |
Quadrant C |
| Plot type | Count rate plots | Images |
|---|---|---|
| Comparison with Poisson distribution Blue bars denote a histogram of data divided into 1 sec bins. Red curve is a Poisson curve with rate = median count rate of data. |
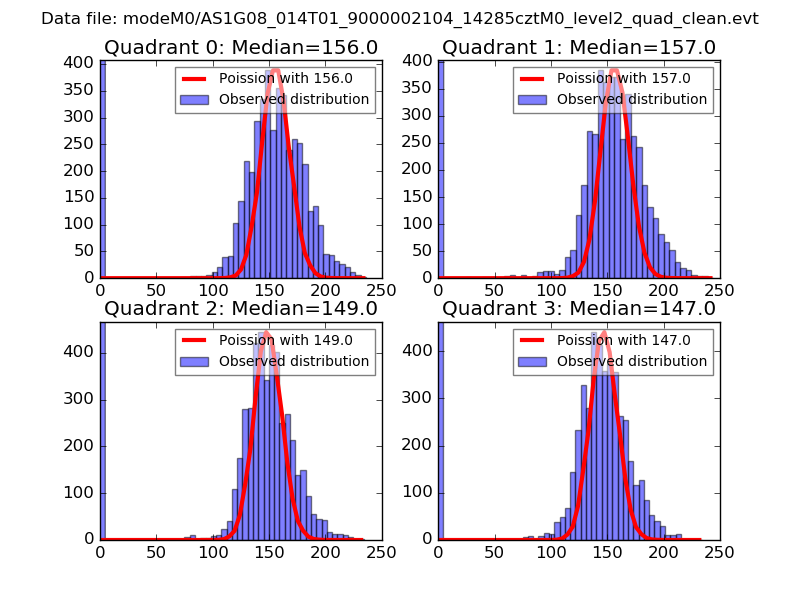 |
 |
| Quadrant-wise count rates Data is divided into 100 sec bins |
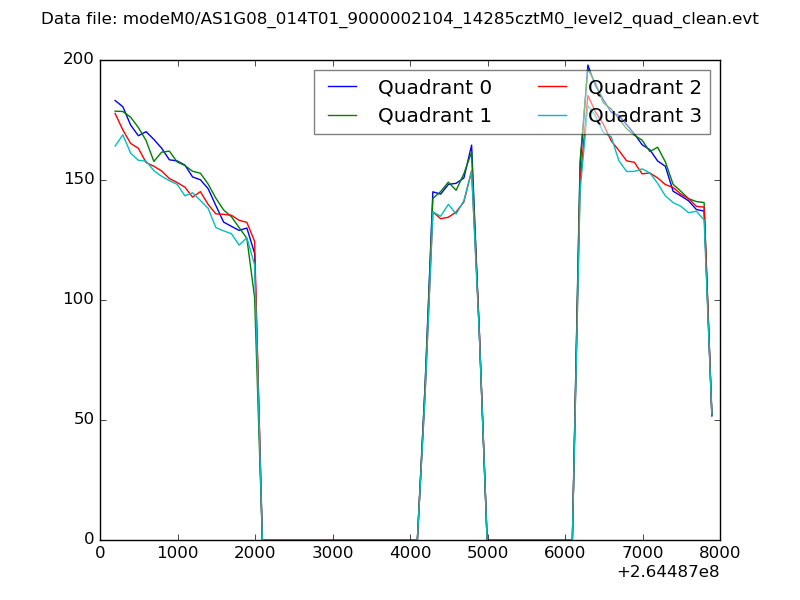 |
|
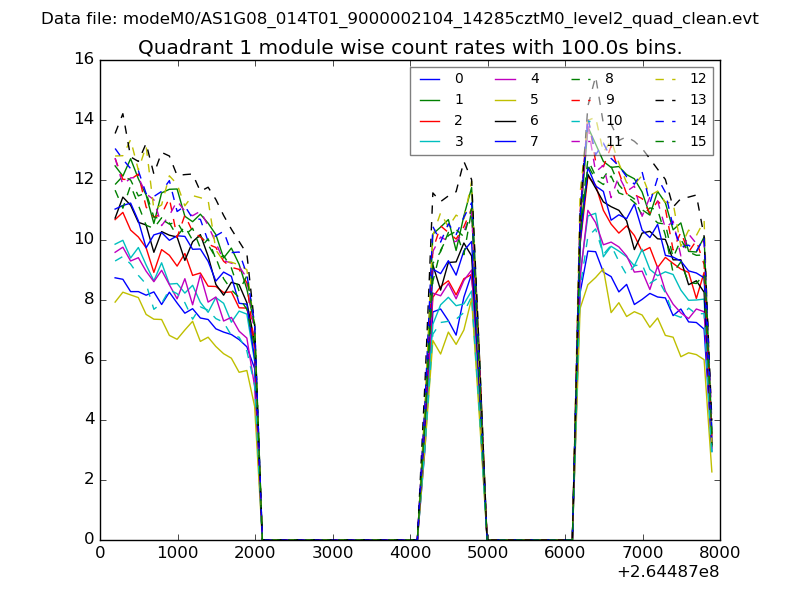
| Module-wise count rates for Quadrant A Data is divided into 100 sec bins |
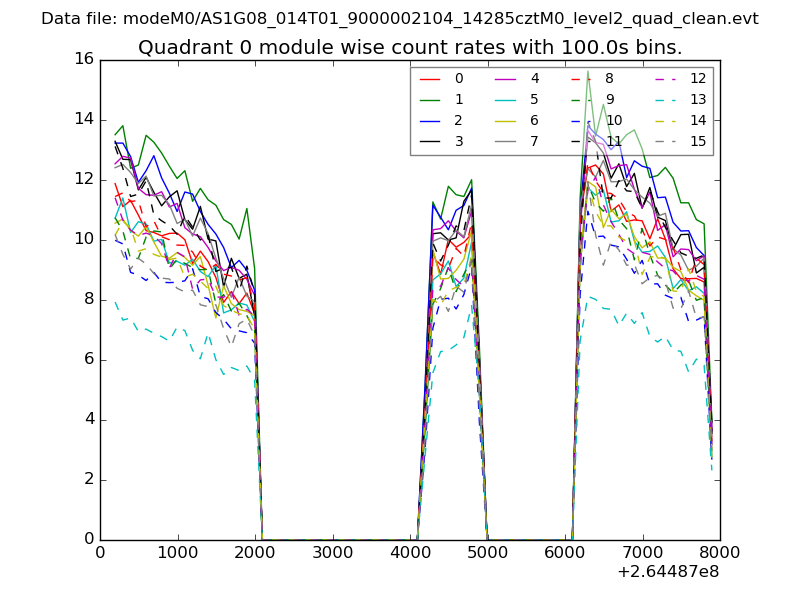 |
 |
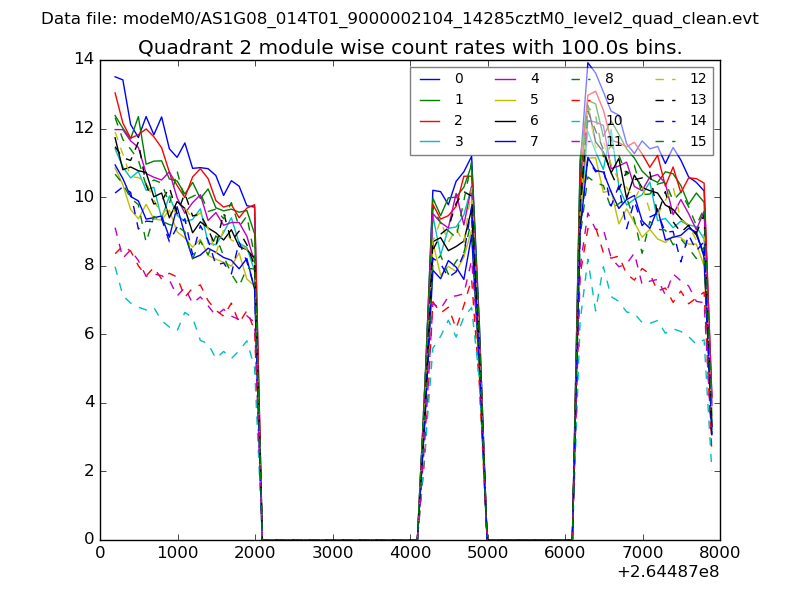
| Module-wise count rates for Quadrant B Data is divided into 100 sec bins |
 |
 |
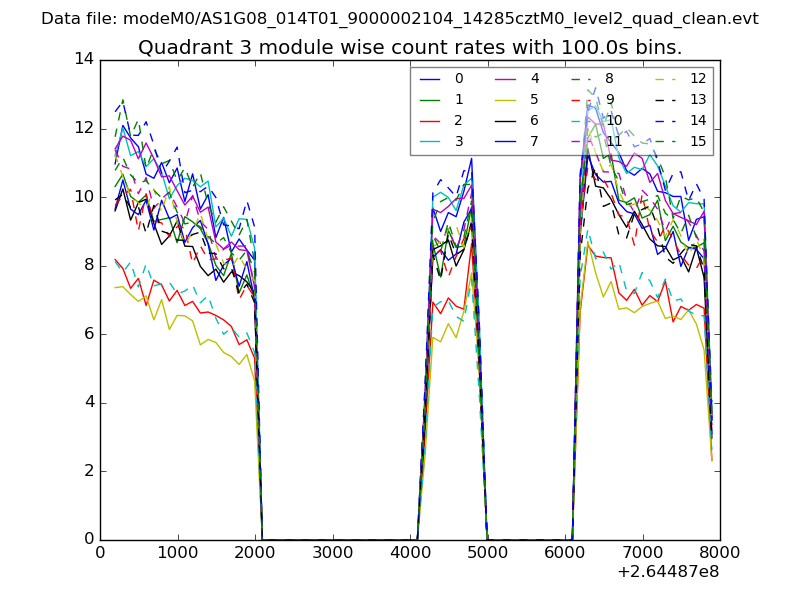
| Module-wise count rates for Quadrant C Data is divided into 100 sec bins |
 |
 |
| Module-wise count rates for Quadrant D Data is divided into 100 sec bins |
 |
 |
| Parameter | Plot |
|---|---|
| CZT HV Monitor | 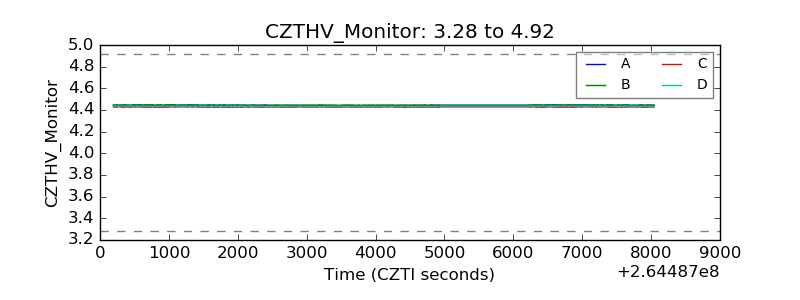 |
| D_VDD | 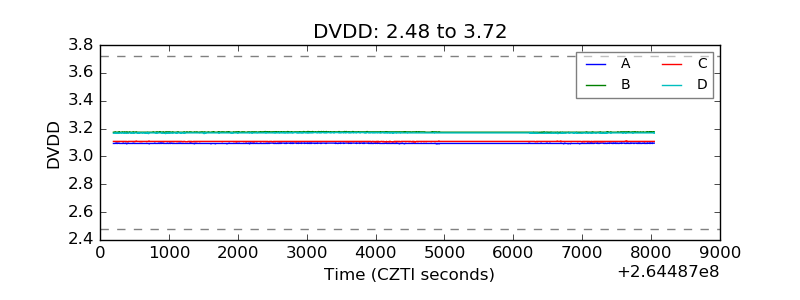 |
| Temperature 1 | 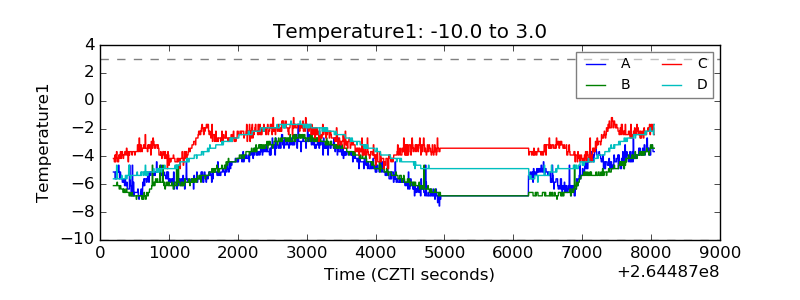 |
| Veto HV Monitor | 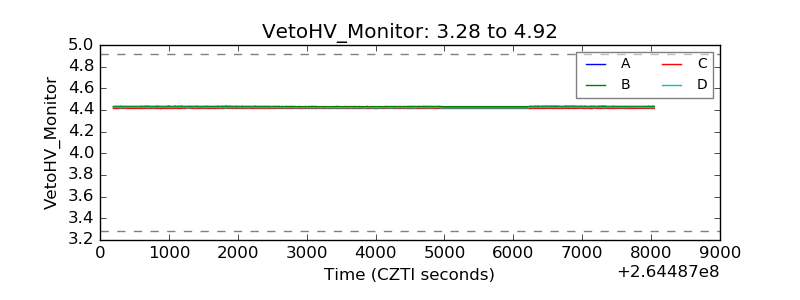 |
| Veto LLD | 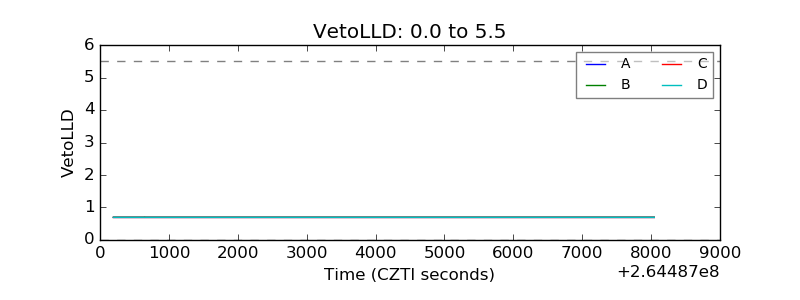 |
| Alpha Counter | 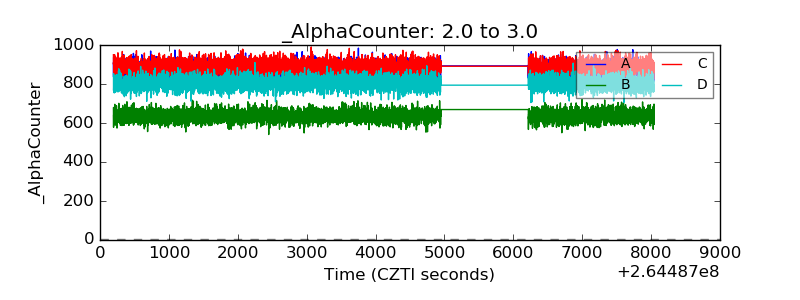 |
| _CPM_Rate | 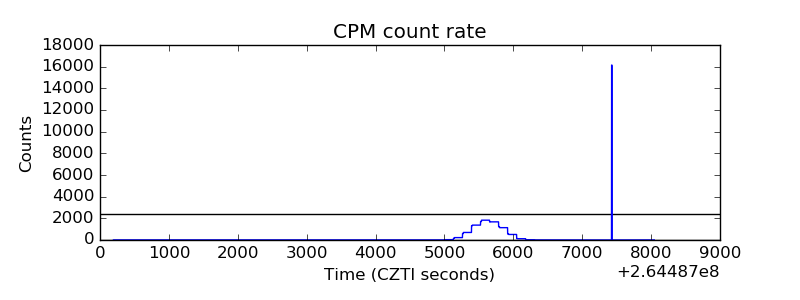 |
| CZT Counter | 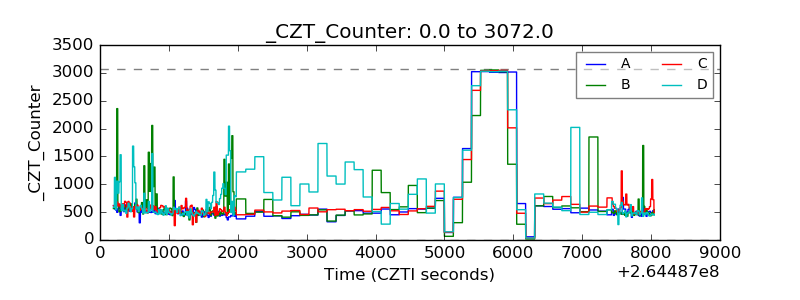 |
| +2.5 Volts monitor |  |
| +5 Volts monitor | 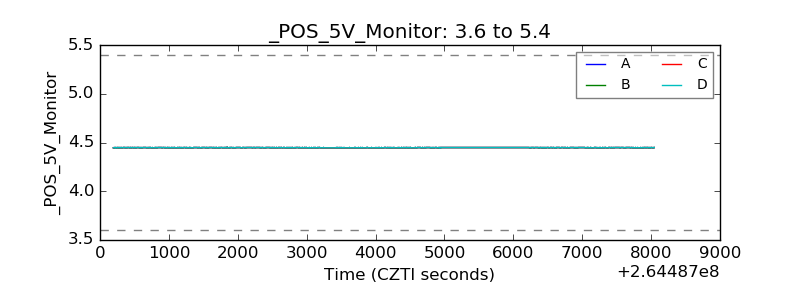 |
| _ROLL_ROT | 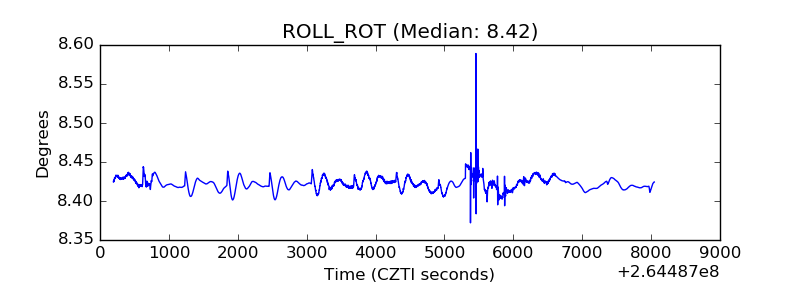 |
| _Roll_DEC | 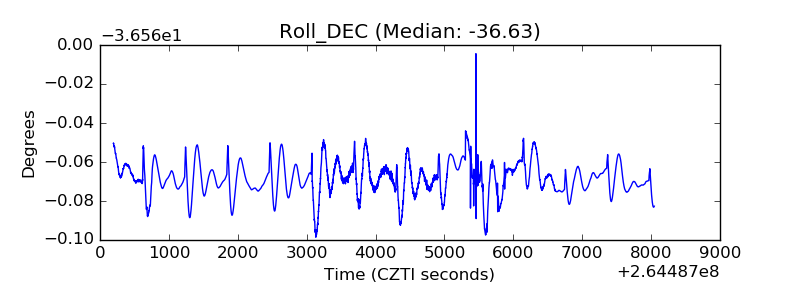 |
| _Roll_RA | 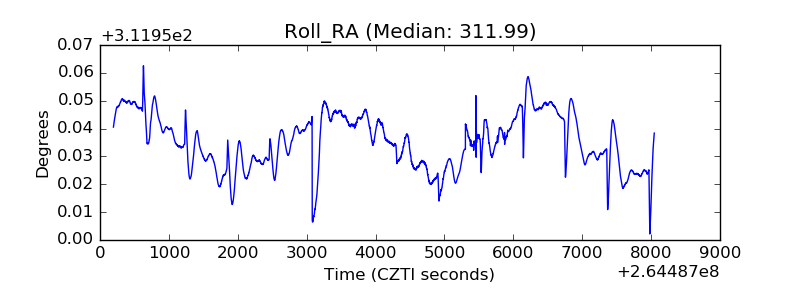 |
| Veto Counter |  |