| Param | Original file | Final file |
|---|---|---|
| Filename | modeM0/AS1G08_014T01_9000002104_14286cztM0_level2.evt | modeM0/AS1G08_014T01_9000002104_14286cztM0_level2_quad_clean.evt |
| Size (bytes) | 555,577,920 | 75,265,920 |
| Size | 529.8 MB | 71.8 MB |
| Events in quadrant A | 2,893,784 | 509,537 |
| Events in quadrant B | 3,170,695 | 511,191 |
| Events in quadrant C | 3,145,201 | 485,529 |
| Events in quadrant D | 7,246,476 | 390,593 |
| Mode M9 | |||
|---|---|---|---|
| Quadrant | BADHDUFLAG | Total packets | Discarded packets |
| A | 0 | 13 | 0 |
| B | 0 | 13 | 0 |
| C | 0 | 13 | 0 |
| D | 0 | 13 | 0 |
| Mode SS | |||
|---|---|---|---|
| Quadrant | BADHDUFLAG | Total packets | Discarded packets |
| A | 0 | 110 | 0 |
| B | 0 | 110 | 0 |
| C | 0 | 110 | 0 |
| D | 0 | 110 | 0 |
| Mode M0 | |||
|---|---|---|---|
| Quadrant | BADHDUFLAG | Total packets | Discarded packets |
| A | 0 | 11756 | 2 |
| B | 0 | 12642 | 1 |
| C | 0 | 12595 | 1 |
| D | 0 | 25129 | 1 |
| Quadrant | Total seconds | Saturated seconds | Saturation percentage |
|---|---|---|---|
| A | 5457 | 63 | 1.154480% |
| B | 5457 | 121 | 2.217336% |
| C | 5457 | 56 | 1.026205% |
| D | 5457 | 1750 | 32.068902% |
Noise dominated data is calculated using 1-second bins in cleaned event files. If a bin has >2000 counts, and if more than 50% of those come from <1% of pixels, then it is considered to be noise-dominated and hence unusable.
| Quadrant | # 1 sec bins | Bins with >0 counts | Bins with >2000 counts | High rate bins dominated by noise | Noise dominated (total time) | Noise dominated (detector-on time) | Marked lightcurve |
|---|---|---|---|---|---|---|---|
| A | 6733 | 5460 | 2 | 2 | 0.03% | 0.04% | 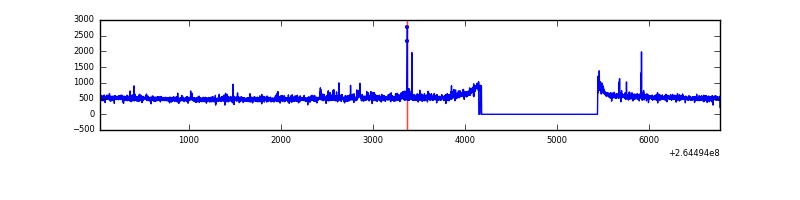 |
| B | 6733 | 5460 | 27 | 27 | 0.40% | 0.49% | 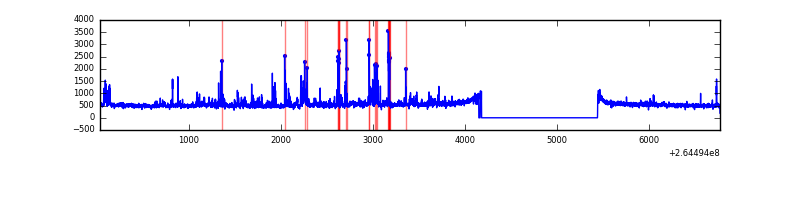 |
| C | 6733 | 5460 | 3 | 3 | 0.04% | 0.05% | 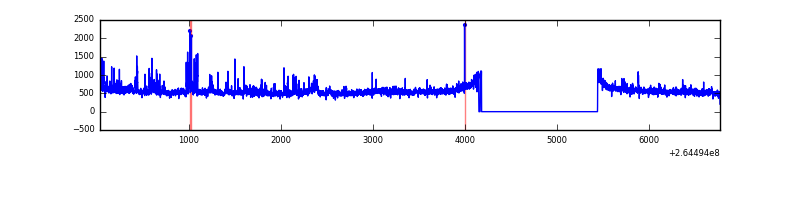 |
| D | 6733 | 5458 | 1509 | 1509 | 22.41% | 27.65% | 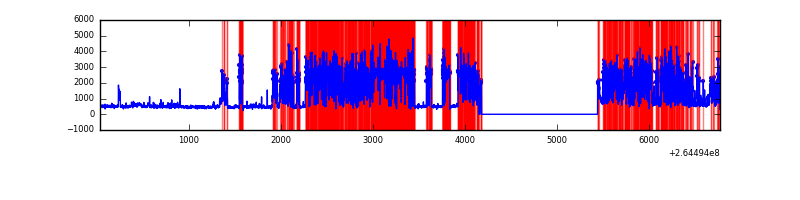 |
Top three noisy pixels from each quadrant. If the there are fewer than three noisy pixels in the level2.evt file, extra rows are filled as -1
| Pixel properties | Quadrant properties | ||||||
|---|---|---|---|---|---|---|---|
| Quadrant | DetID | PixID | Counts | Sigma | Mean | Median | Sigma |
| A | 12 | 189 | 67312 | 462.08 | 723 | 709 | 144.1 |
| A | 15 | 69 | 25038 | 168.79 | 723 | 709 | 144.1 |
| A | 8 | 15 | 11286 | 73.38 | 723 | 709 | 144.1 |
| B | 0 | 229 | 221645 | 1646.69 | 707 | 691 | 134.2 |
| B | 3 | 209 | 46858 | 344.06 | 707 | 691 | 134.2 |
| B | 10 | 244 | 34489 | 251.88 | 707 | 691 | 134.2 |
| C | 3 | 233 | 448259 | 2825.29 | 690 | 696 | 158.4 |
| C | 13 | 61 | 4770 | 25.72 | 690 | 696 | 158.4 |
| C | 14 | 234 | 4463 | 23.78 | 690 | 696 | 158.4 |
| D | 5 | 222 | 4671599 | 33359.38 | 596 | 586 | 140.0 |
| D | 12 | 110 | 138297 | 983.5 | 596 | 586 | 140.0 |
| D | 13 | 122 | 79575 | 564.12 | 596 | 586 | 140.0 |
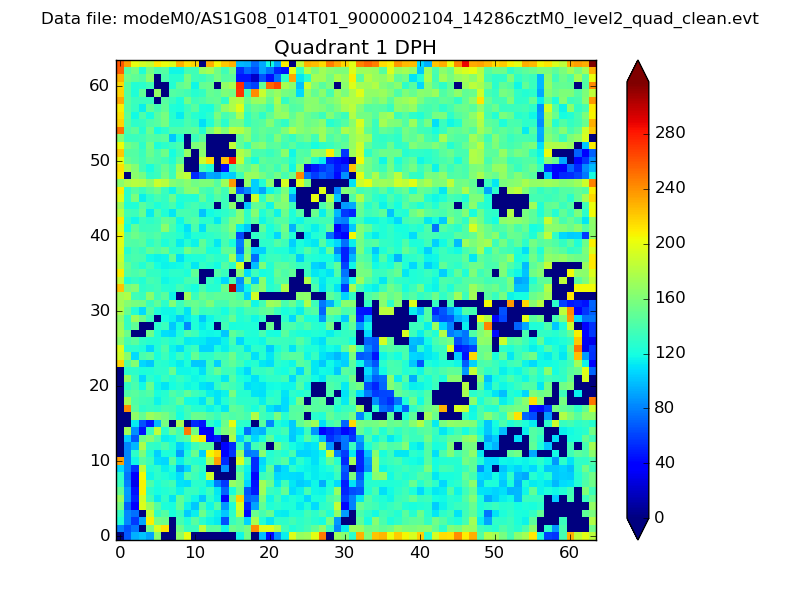
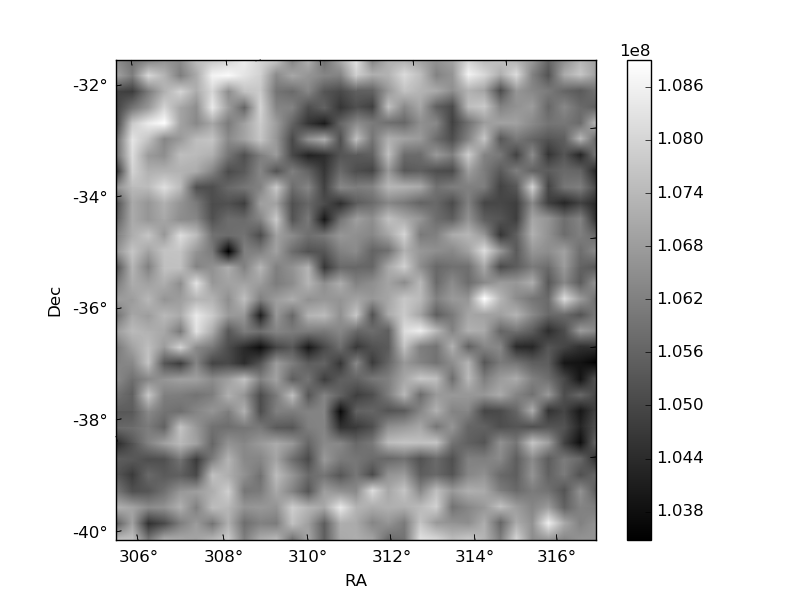
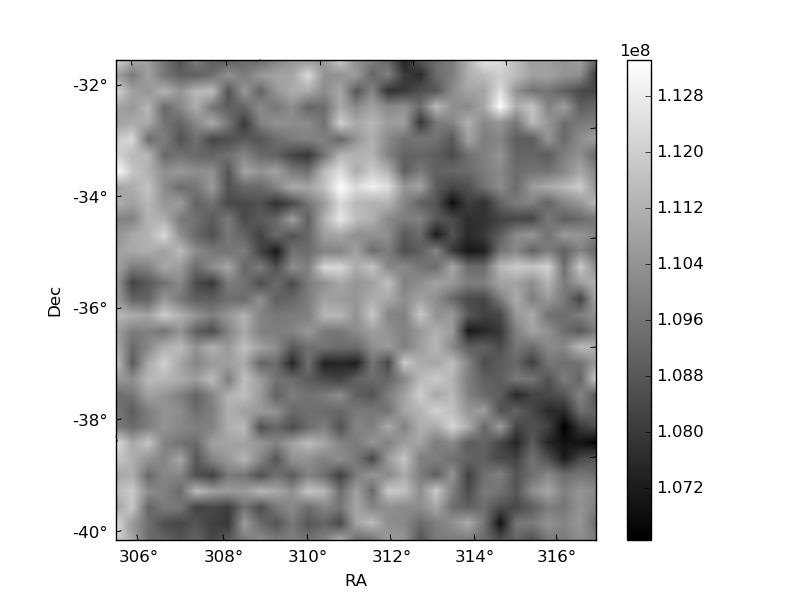
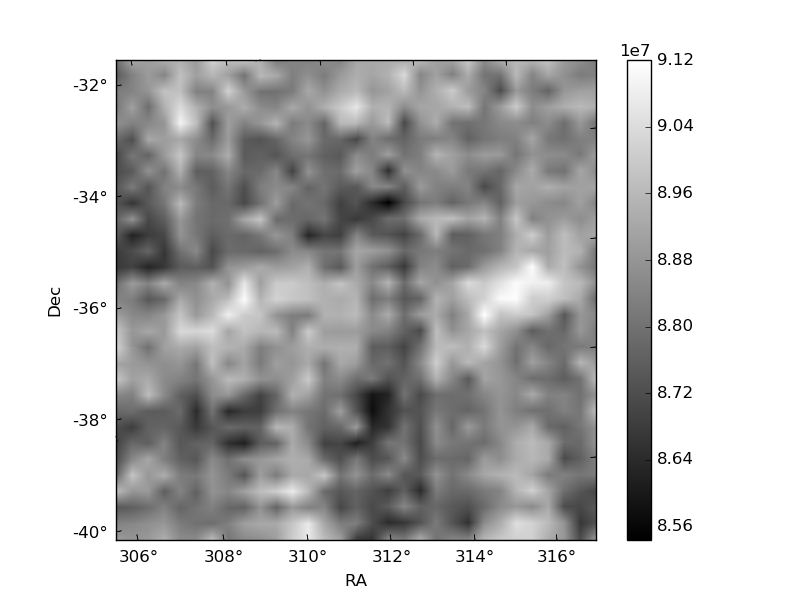
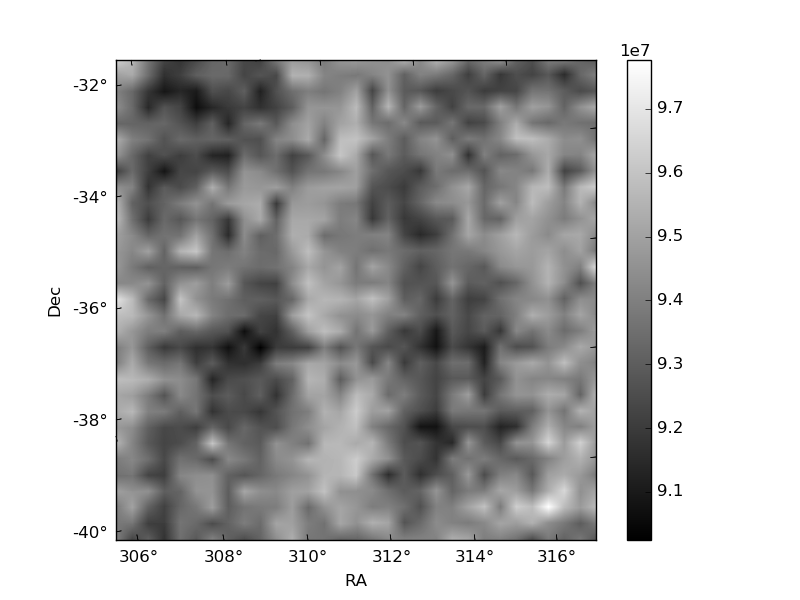
Histogram calculated using DETX and DETY for each event in the final _common_clean file
| Quadrant A | 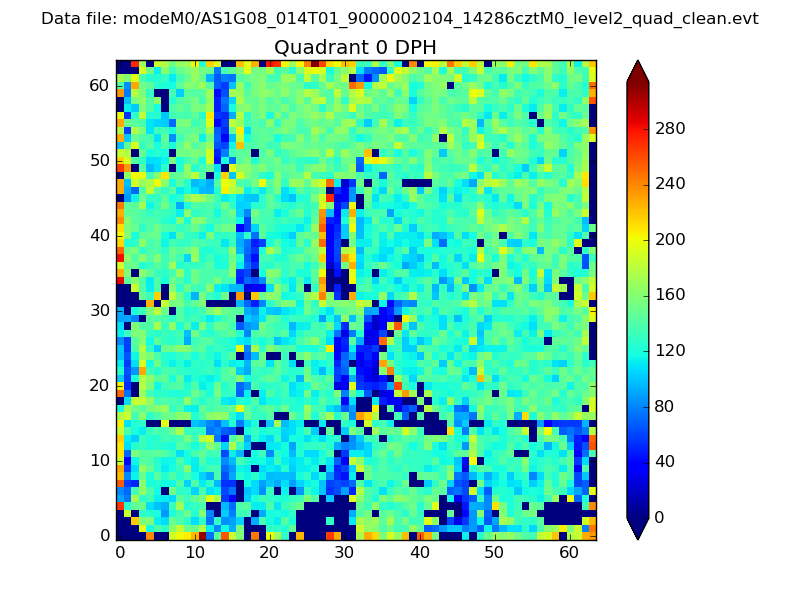 |
 |
Quadrant B |
|---|---|---|---|
| Quadrant D | 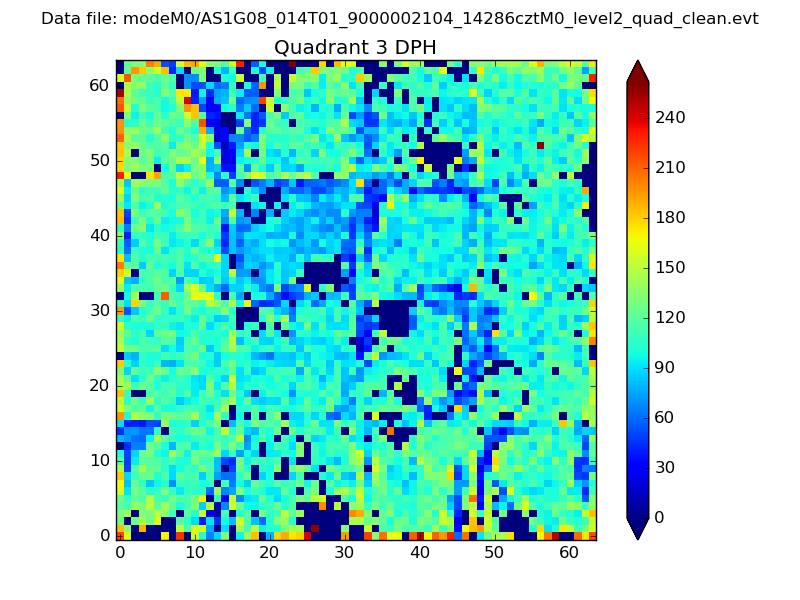 |
 |
Quadrant C |
| Plot type | Count rate plots | Images |
|---|---|---|
| Comparison with Poisson distribution Blue bars denote a histogram of data divided into 1 sec bins. Red curve is a Poisson curve with rate = median count rate of data. |
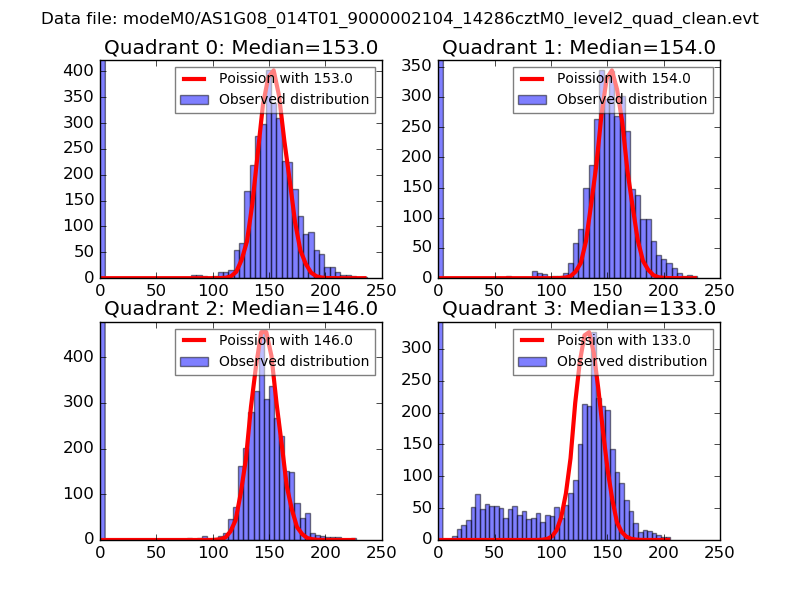 |
 |
| Quadrant-wise count rates Data is divided into 100 sec bins |
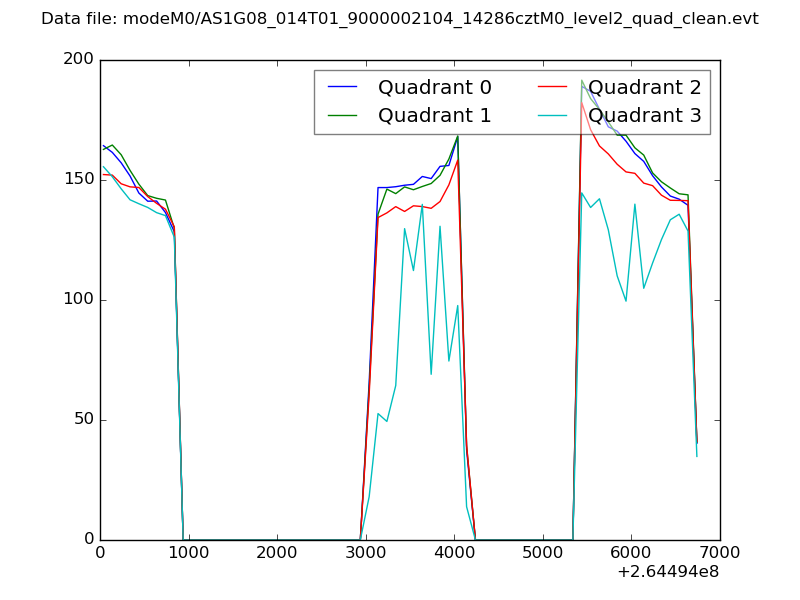 |
|
| Module-wise count rates for Quadrant A Data is divided into 100 sec bins |
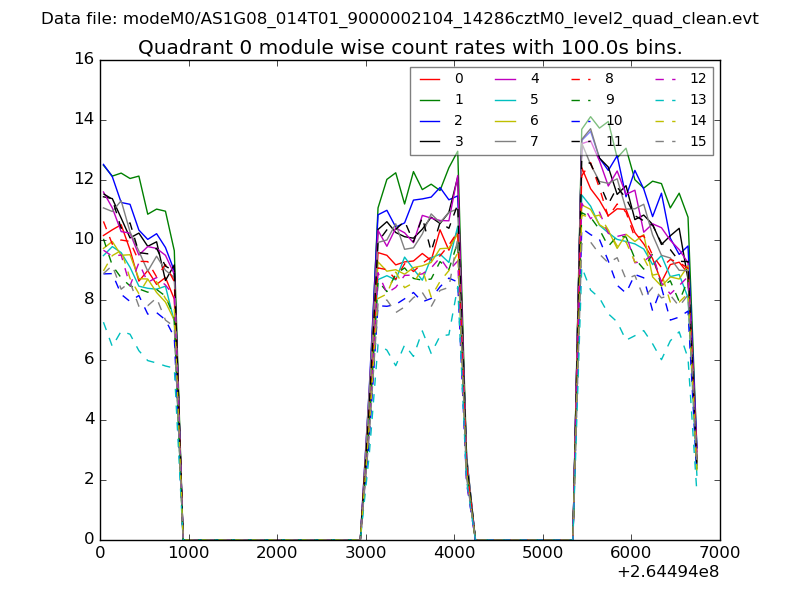 |
 |
| Module-wise count rates for Quadrant B Data is divided into 100 sec bins |
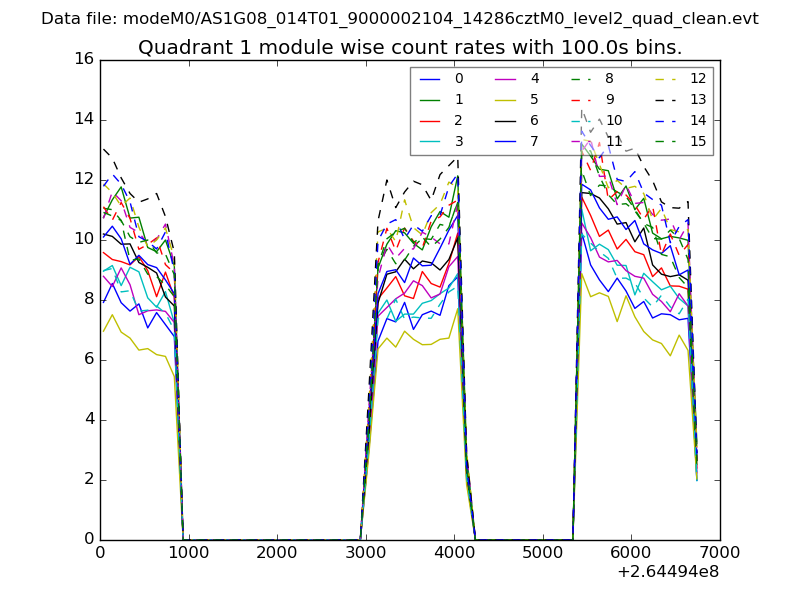 |
 |
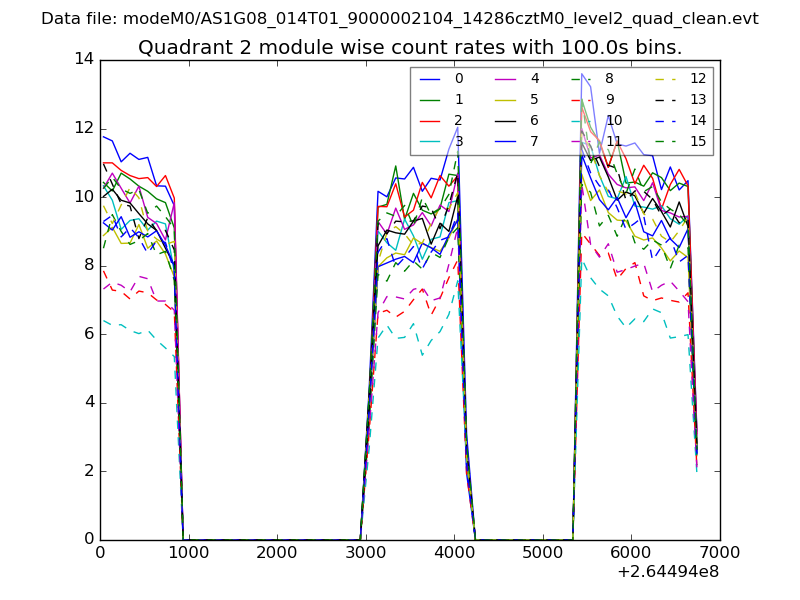
| Module-wise count rates for Quadrant C Data is divided into 100 sec bins |
 |
 |
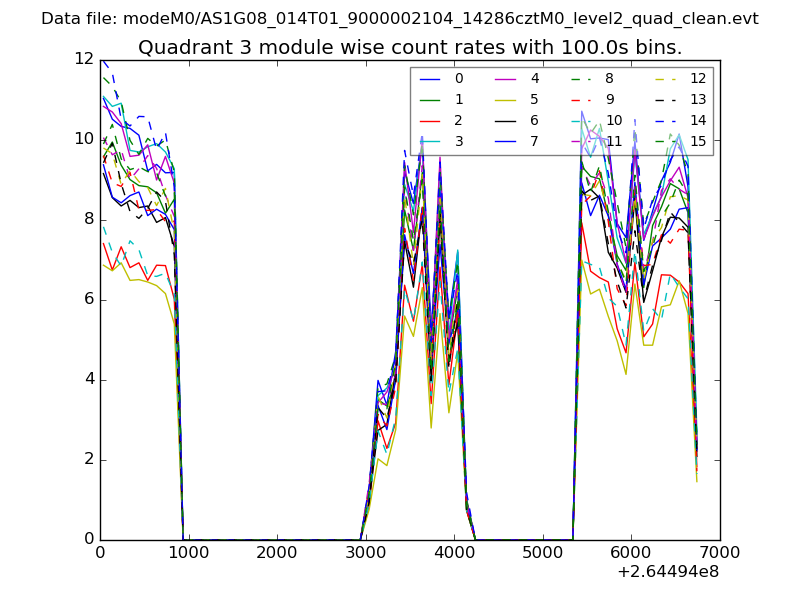
| Module-wise count rates for Quadrant D Data is divided into 100 sec bins |
 |
 |
| Parameter | Plot |
|---|---|
| CZT HV Monitor | 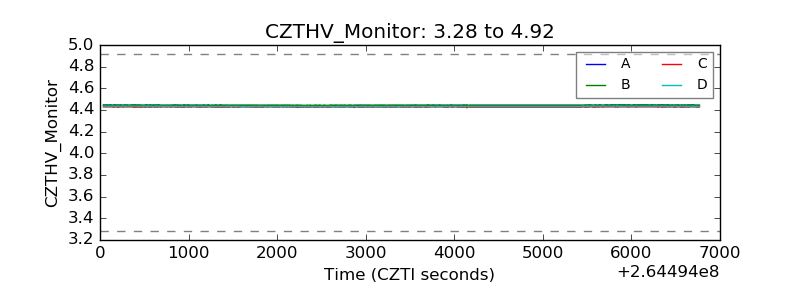 |
| D_VDD | 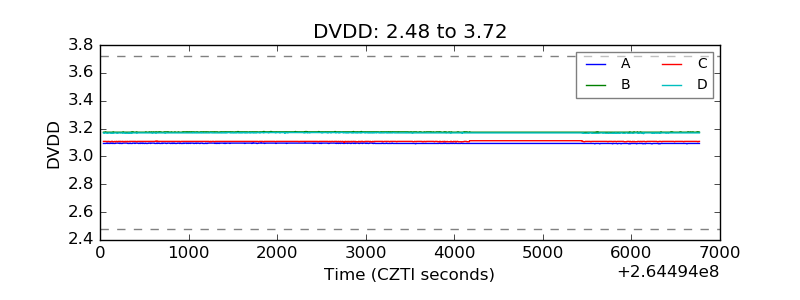 |
| Temperature 1 | 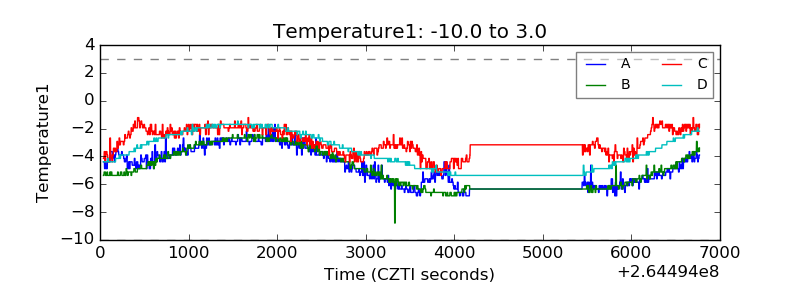 |
| Veto HV Monitor | 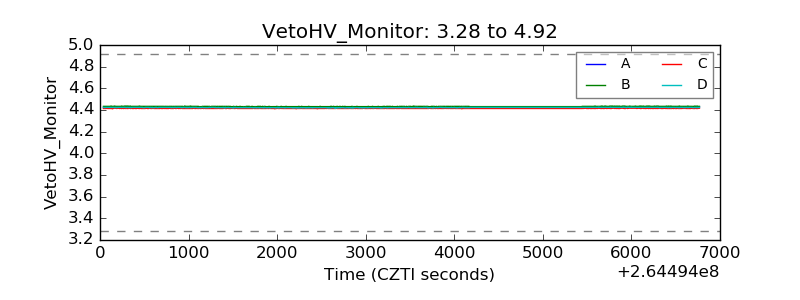 |
| Veto LLD | 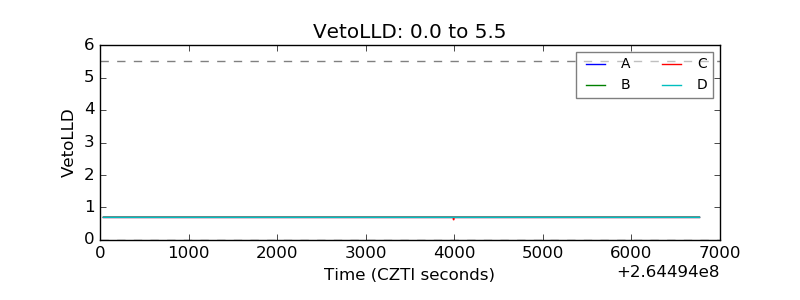 |
| Alpha Counter | 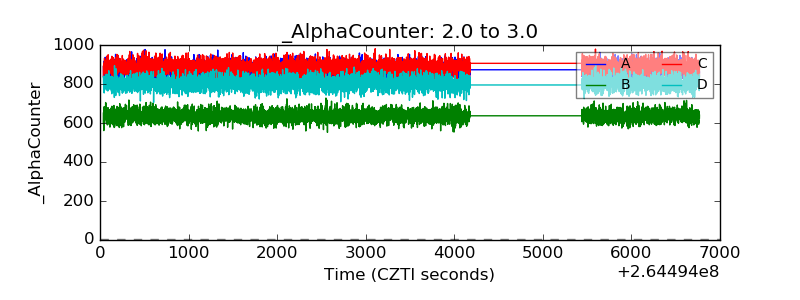 |
| _CPM_Rate | 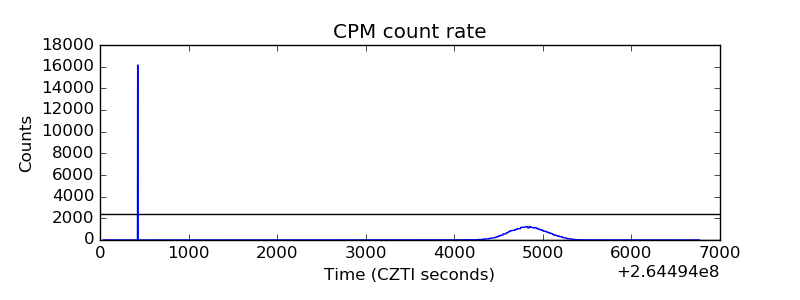 |
| CZT Counter |  |
| +2.5 Volts monitor | 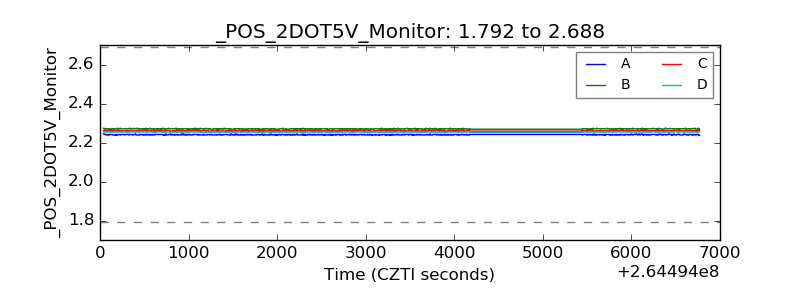 |
| +5 Volts monitor |  |
| _ROLL_ROT | 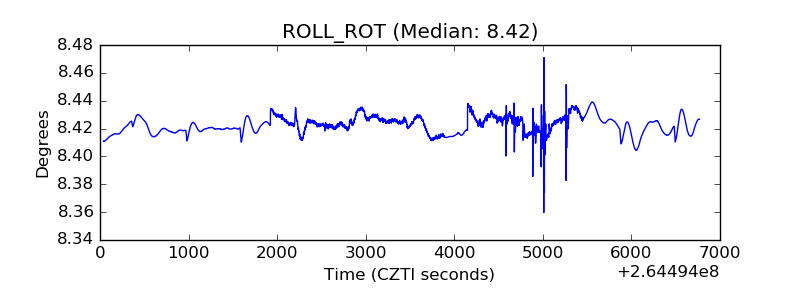 |
| _Roll_DEC |  |
| _Roll_RA | 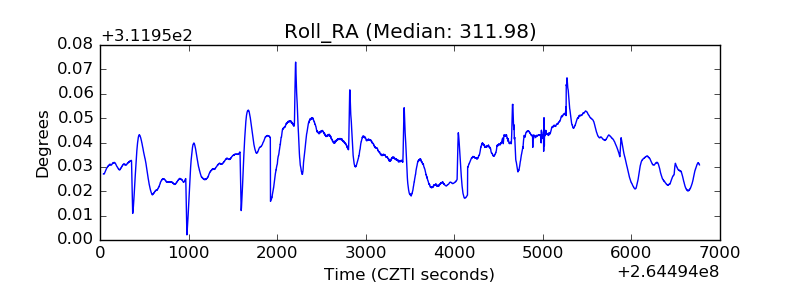 |
| Veto Counter | 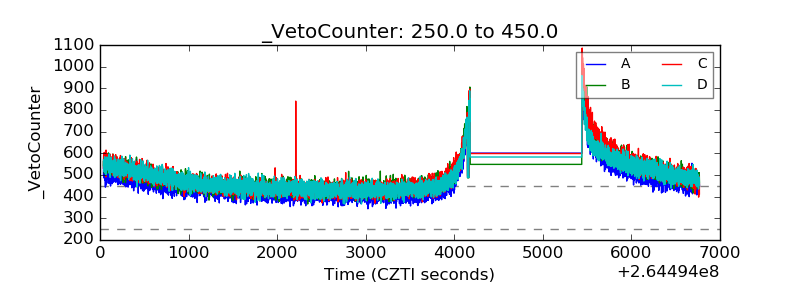 |