| Param | Original file | Final file |
|---|---|---|
| Filename | modeM0/AS1G08_014T01_9000002104_14288cztM0_level2.evt | modeM0/AS1G08_014T01_9000002104_14288cztM0_level2_quad_clean.evt |
| Size (bytes) | 600,742,080 | 78,955,200 |
| Size | 572.9 MB | 75.3 MB |
| Events in quadrant A | 3,352,943 | 497,208 |
| Events in quadrant B | 3,575,497 | 498,170 |
| Events in quadrant C | 3,434,759 | 473,900 |
| Events in quadrant D | 7,379,191 | 457,011 |
| Mode M9 | |||
|---|---|---|---|
| Quadrant | BADHDUFLAG | Total packets | Discarded packets |
| A | 0 | 10 | 0 |
| B | 0 | 10 | 0 |
| C | 0 | 10 | 0 |
| D | 0 | 10 | 0 |
| Mode SS | |||
|---|---|---|---|
| Quadrant | BADHDUFLAG | Total packets | Discarded packets |
| A | 0 | 134 | 0 |
| B | 0 | 134 | 0 |
| C | 0 | 134 | 0 |
| D | 0 | 134 | 0 |
| Mode M0 | |||
|---|---|---|---|
| Quadrant | BADHDUFLAG | Total packets | Discarded packets |
| A | 0 | 13861 | 2 |
| B | 0 | 14590 | 1 |
| C | 0 | 13977 | 1 |
| D | 0 | 26469 | 1 |
| Quadrant | Total seconds | Saturated seconds | Saturation percentage |
|---|---|---|---|
| A | 6665 | 106 | 1.590398% |
| B | 6665 | 143 | 2.145536% |
| C | 6665 | 61 | 0.915229% |
| D | 6665 | 1061 | 15.918980% |
Noise dominated data is calculated using 1-second bins in cleaned event files. If a bin has >2000 counts, and if more than 50% of those come from <1% of pixels, then it is considered to be noise-dominated and hence unusable.
| Quadrant | # 1 sec bins | Bins with >0 counts | Bins with >2000 counts | High rate bins dominated by noise | Noise dominated (total time) | Noise dominated (detector-on time) | Marked lightcurve |
|---|---|---|---|---|---|---|---|
| A | 7626 | 6667 | 2 | 2 | 0.03% | 0.03% | 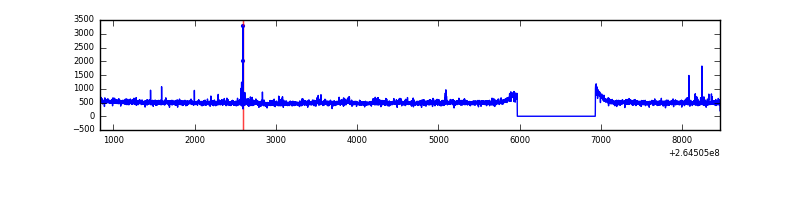 |
| B | 7626 | 6667 | 21 | 21 | 0.28% | 0.31% | 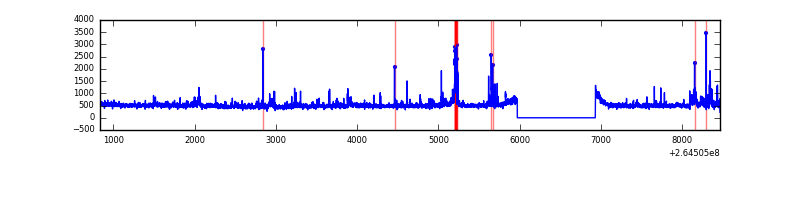 |
| C | 7626 | 6667 | 0 | 0 | 0.00% | 0.00% | 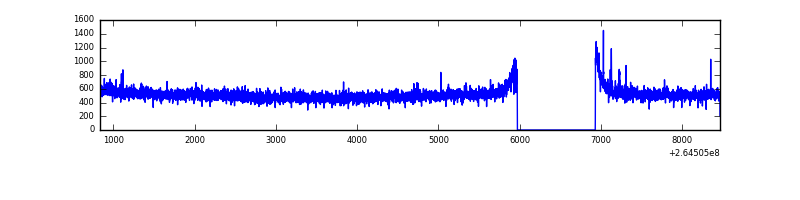 |
| D | 7626 | 6667 | 820 | 820 | 10.75% | 12.30% | 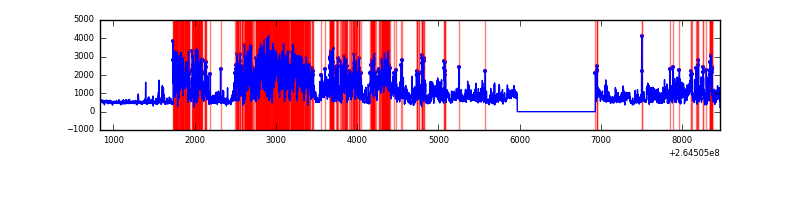 |
Top three noisy pixels from each quadrant. If the there are fewer than three noisy pixels in the level2.evt file, extra rows are filled as -1
| Pixel properties | Quadrant properties | ||||||
|---|---|---|---|---|---|---|---|
| Quadrant | DetID | PixID | Counts | Sigma | Mean | Median | Sigma |
| A | 12 | 189 | 78601 | 458.97 | 842 | 826 | 169.5 |
| A | 8 | 15 | 23670 | 134.81 | 842 | 826 | 169.5 |
| A | 15 | 69 | 11697 | 64.15 | 842 | 826 | 169.5 |
| B | 0 | 229 | 203324 | 1275.33 | 830 | 809 | 158.8 |
| B | 0 | 219 | 40247 | 248.36 | 830 | 809 | 158.8 |
| B | 4 | 48 | 27454 | 167.8 | 830 | 809 | 158.8 |
| C | 3 | 233 | 300723 | 1620.62 | 803 | 805 | 185.1 |
| C | 13 | 61 | 5690 | 26.4 | 803 | 805 | 185.1 |
| C | 14 | 234 | 1833 | 5.55 | 803 | 805 | 185.1 |
| D | 13 | 122 | 4144561 | 22588.46 | 774 | 758 | 183.4 |
| D | 10 | 199 | 135030 | 731.94 | 774 | 758 | 183.4 |
| D | 12 | 110 | 90154 | 487.31 | 774 | 758 | 183.4 |
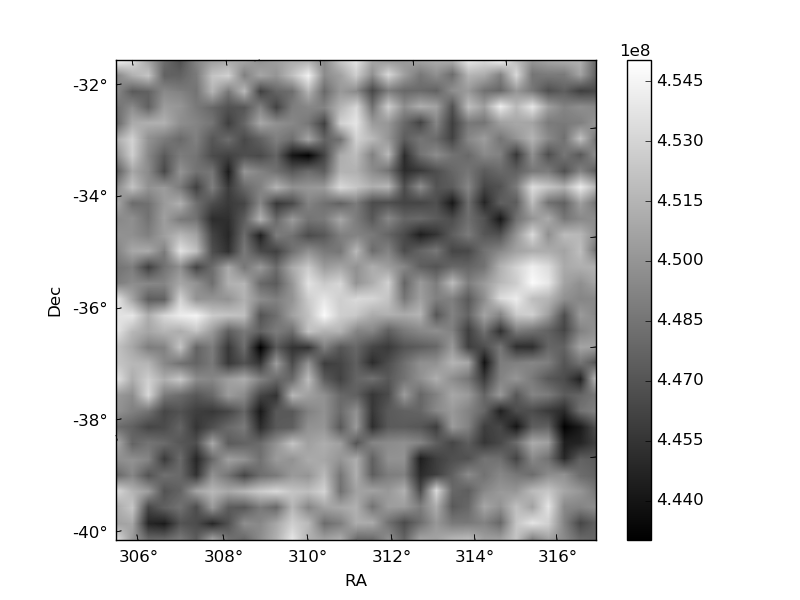
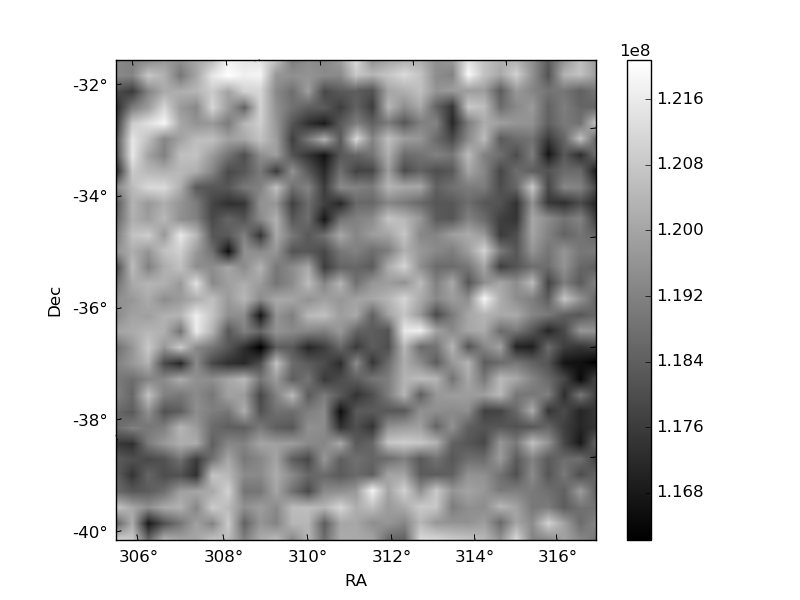
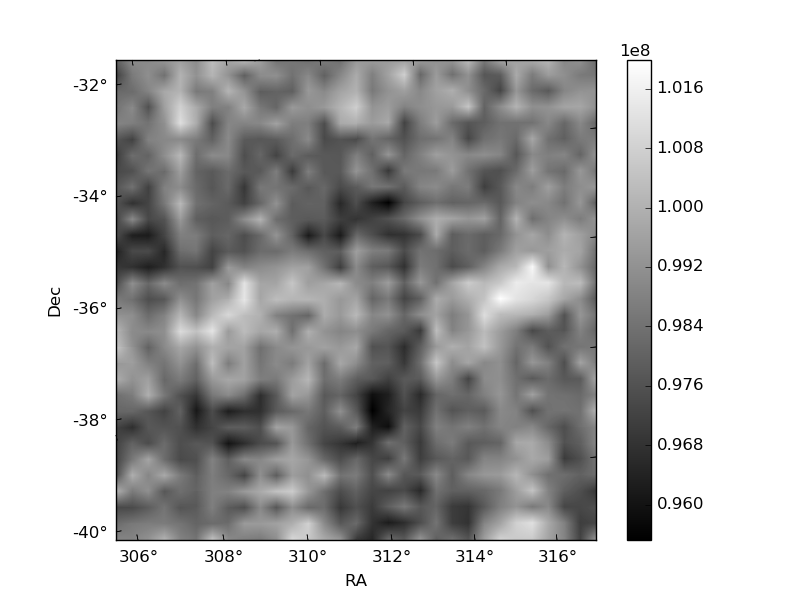
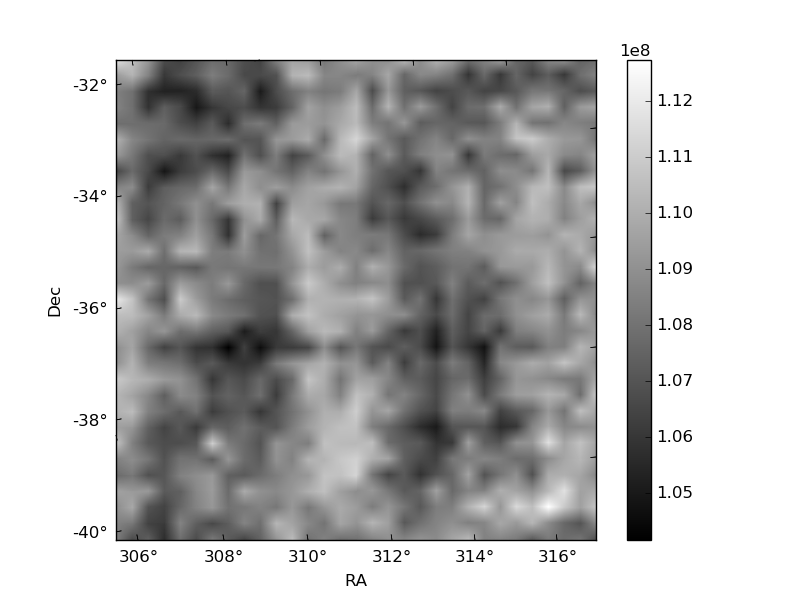
Histogram calculated using DETX and DETY for each event in the final _common_clean file
| Quadrant A | 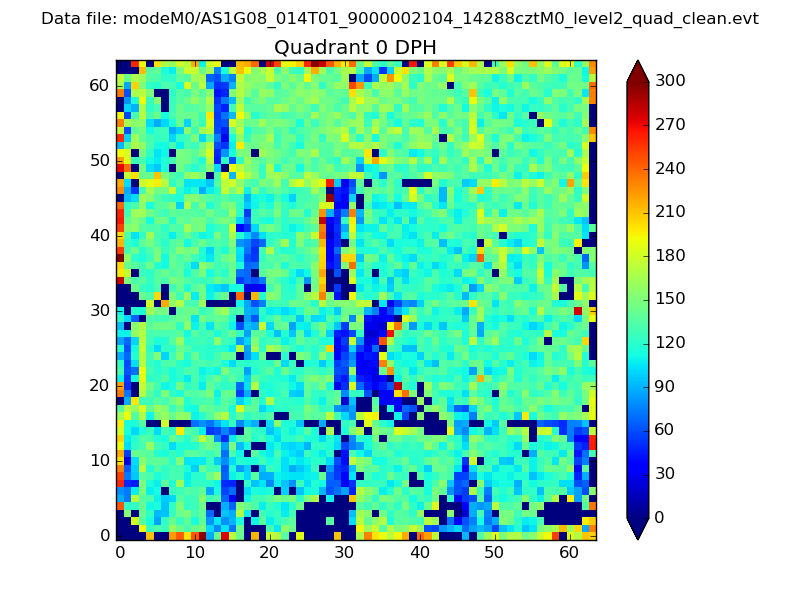 |
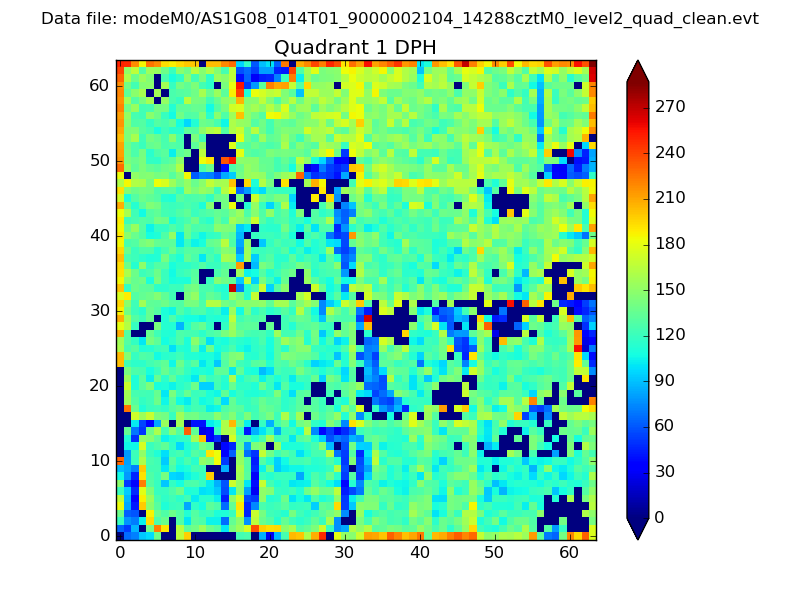 |
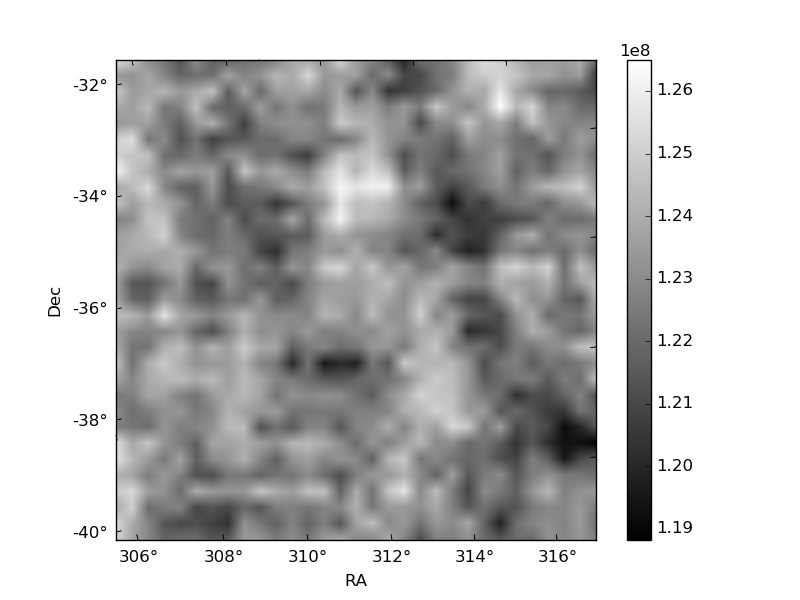
Quadrant B |
|---|---|---|---|
| Quadrant D | 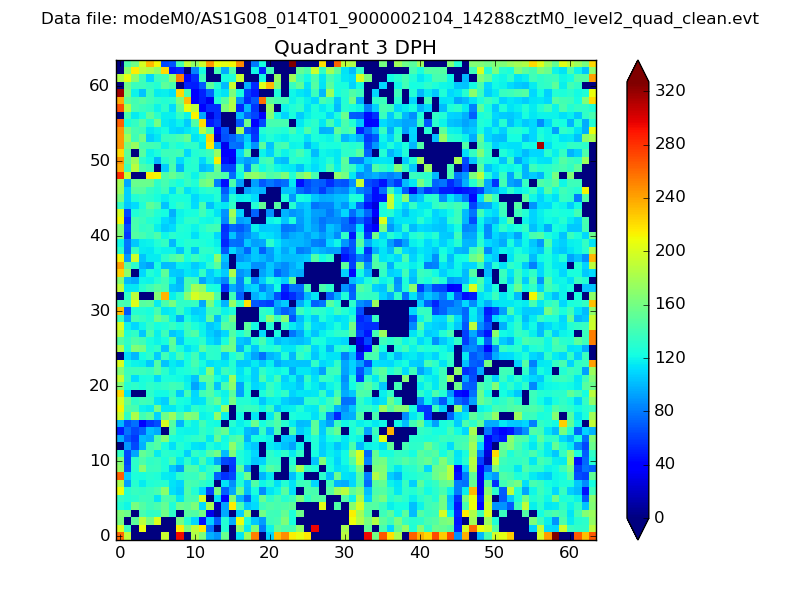 |
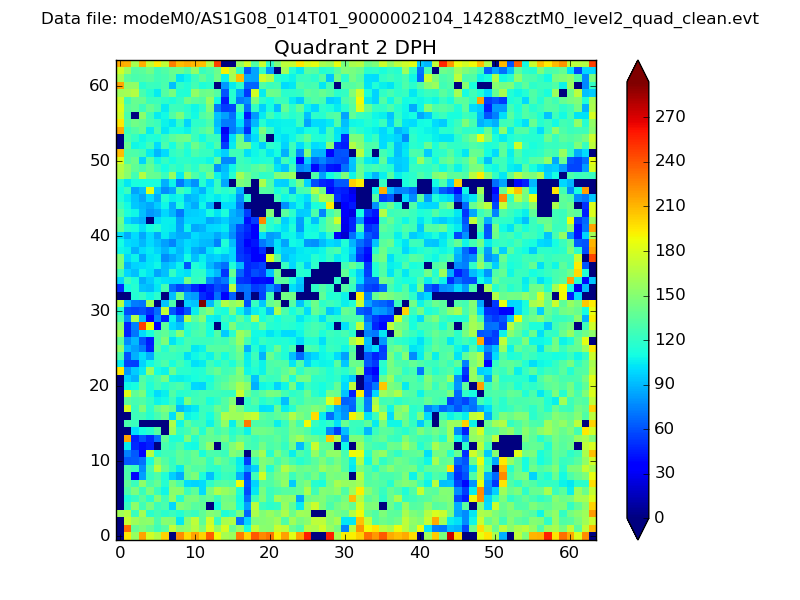 |
Quadrant C |
| Plot type | Count rate plots | Images |
|---|---|---|
| Comparison with Poisson distribution Blue bars denote a histogram of data divided into 1 sec bins. Red curve is a Poisson curve with rate = median count rate of data. |
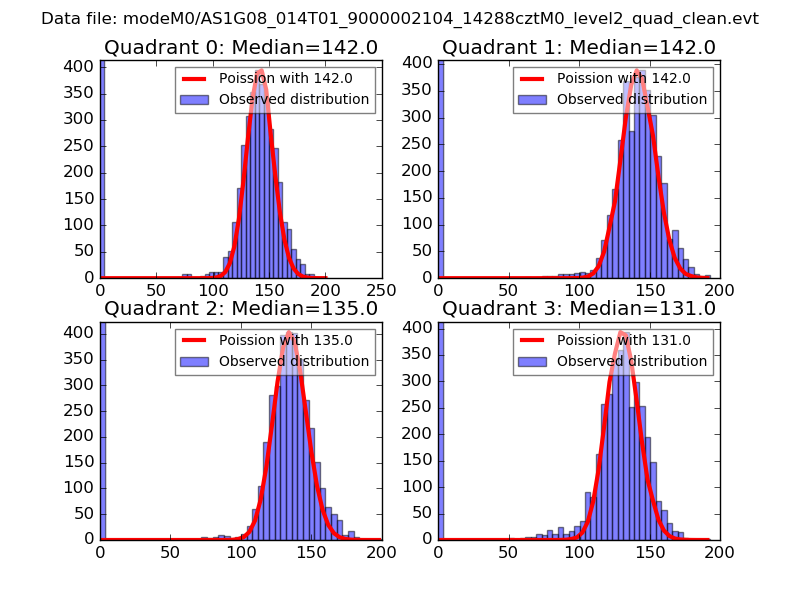 |
 |
| Quadrant-wise count rates Data is divided into 100 sec bins |
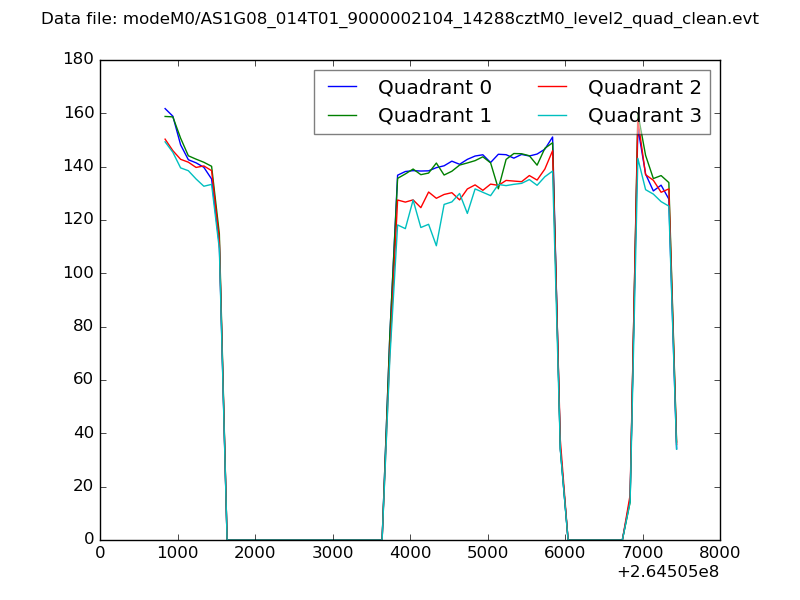 |
|
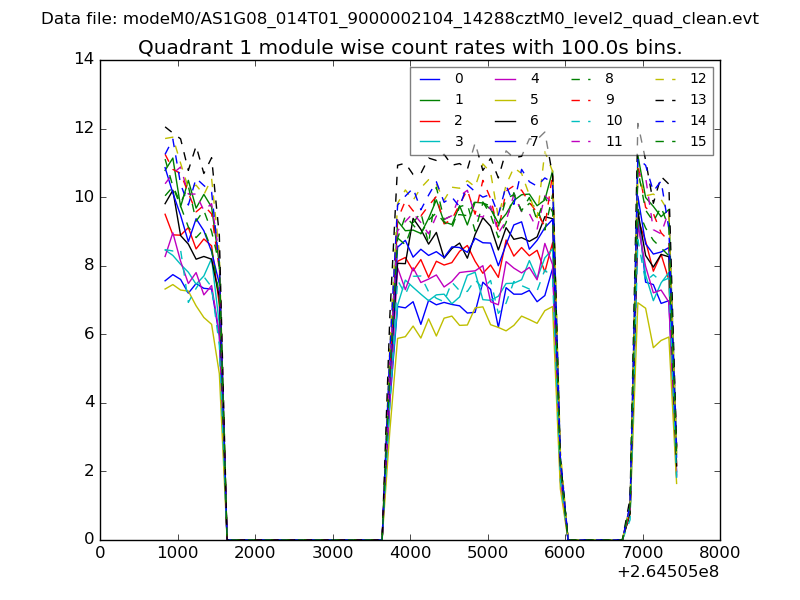
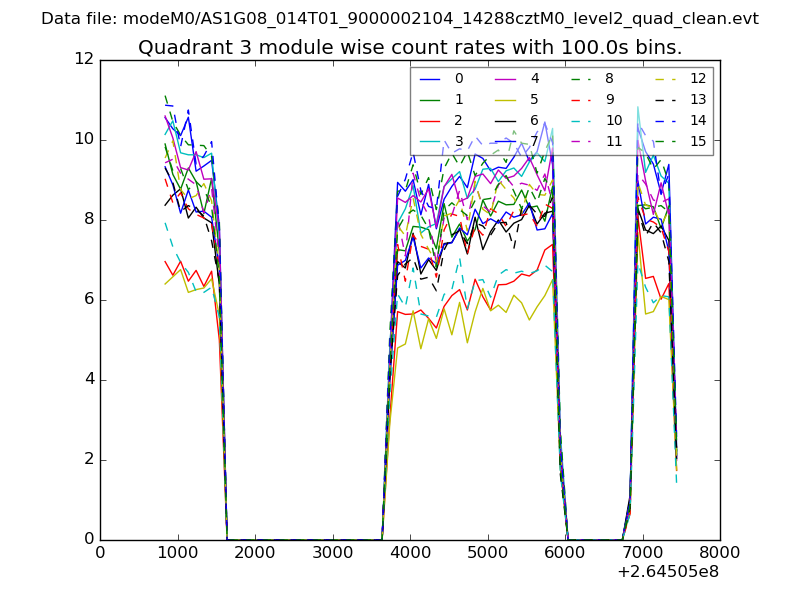
| Module-wise count rates for Quadrant A Data is divided into 100 sec bins |
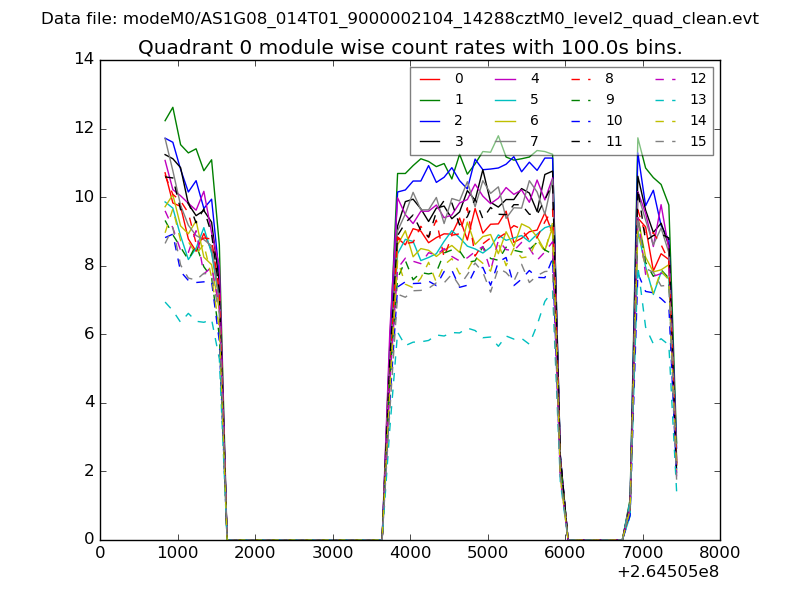 |
 |
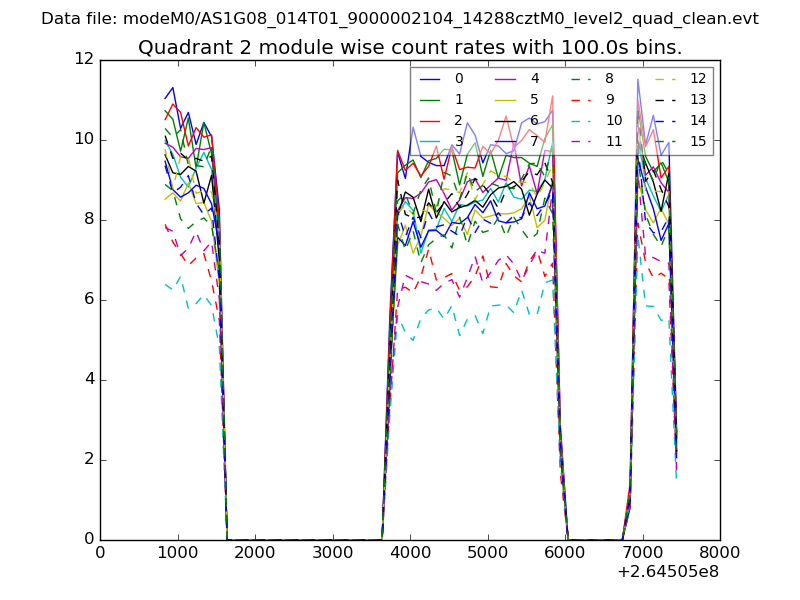
| Module-wise count rates for Quadrant B Data is divided into 100 sec bins |
 |
 |
| Module-wise count rates for Quadrant C Data is divided into 100 sec bins |
 |
 |
| Module-wise count rates for Quadrant D Data is divided into 100 sec bins |
 |
 |
| Parameter | Plot |
|---|---|
| CZT HV Monitor | 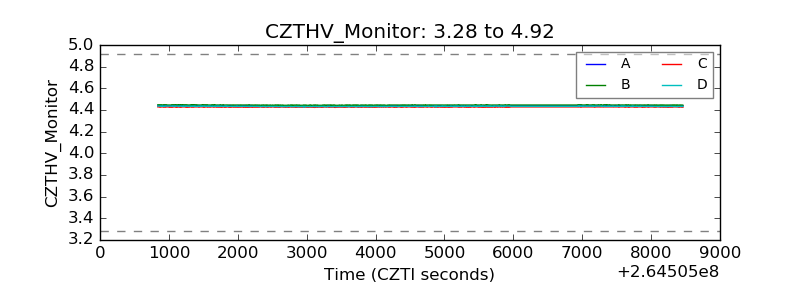 |
| D_VDD | 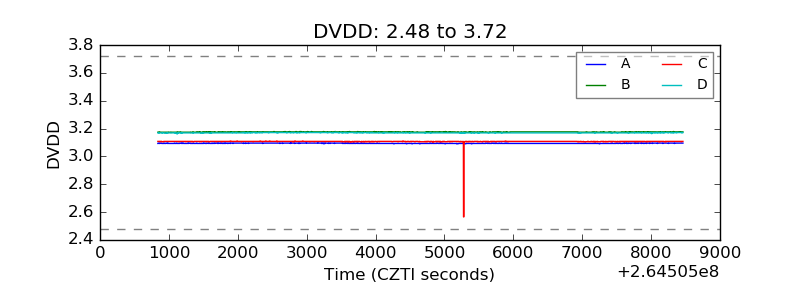 |
| Temperature 1 | 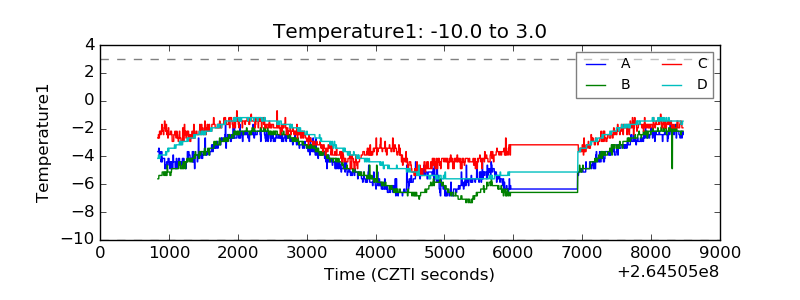 |
| Veto HV Monitor | 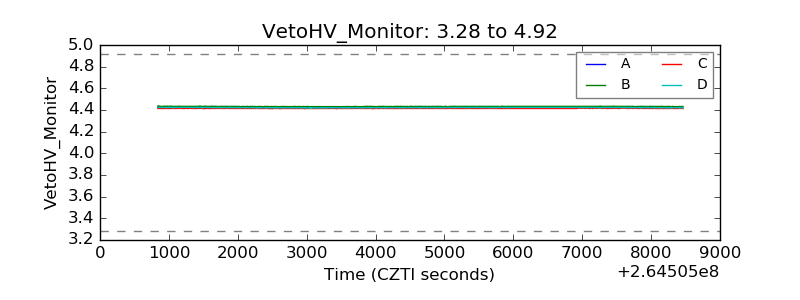 |
| Veto LLD |  |
| Alpha Counter | 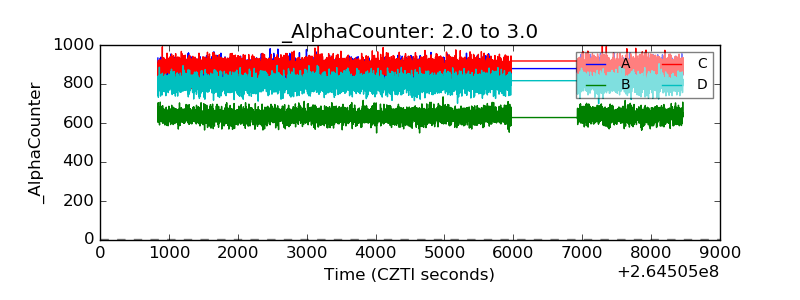 |
| _CPM_Rate |  |
| CZT Counter | 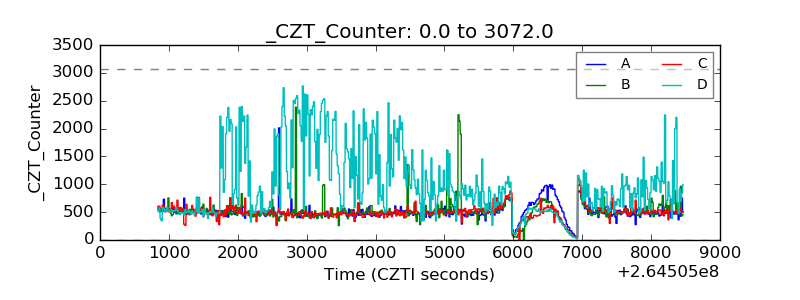 |
| +2.5 Volts monitor |  |
| +5 Volts monitor |  |
| _ROLL_ROT | 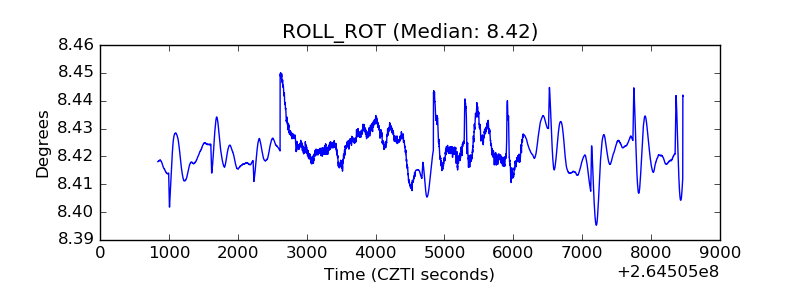 |
| _Roll_DEC | 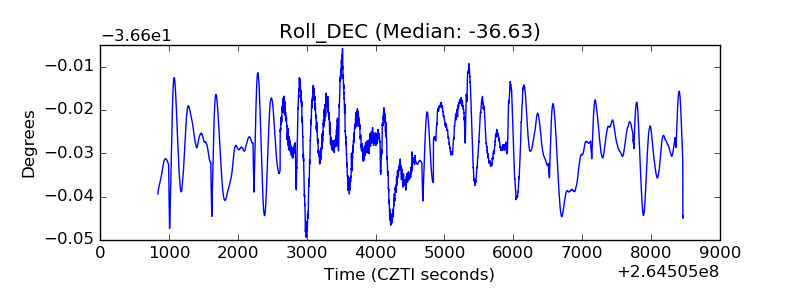 |
| _Roll_RA | 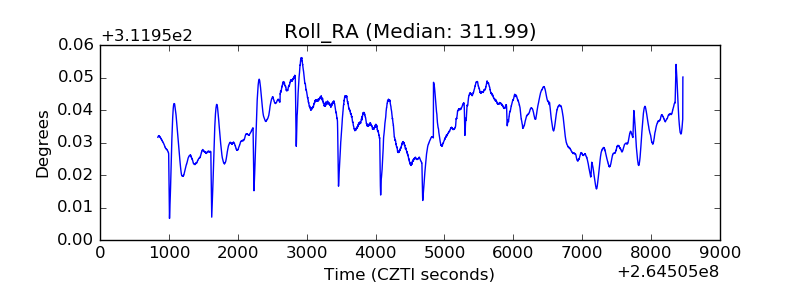 |
| Veto Counter | 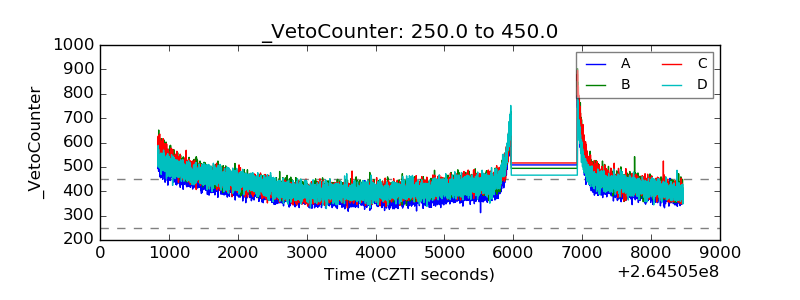 |