| Param | Original file | Final file |
|---|---|---|
| Filename | modeM0/AS1G08_014T01_9000002104_14289cztM0_level2.evt | modeM0/AS1G08_014T01_9000002104_14289cztM0_level2_quad_clean.evt |
| Size (bytes) | 298,077,120 | 34,490,880 |
| Size | 284.3 MB | 32.9 MB |
| Events in quadrant A | 1,785,285 | 202,149 |
| Events in quadrant B | 2,014,801 | 203,233 |
| Events in quadrant C | 1,832,429 | 191,354 |
| Events in quadrant D | 3,144,176 | 187,125 |
| Mode SS | |||
|---|---|---|---|
| Quadrant | BADHDUFLAG | Total packets | Discarded packets |
| A | 0 | 74 | 0 |
| B | 0 | 74 | 0 |
| C | 0 | 74 | 0 |
| D | 0 | 74 | 0 |
| Mode M0 | |||
|---|---|---|---|
| Quadrant | BADHDUFLAG | Total packets | Discarded packets |
| A | 0 | 7604 | 1 |
| B | 0 | 8258 | 1 |
| C | 0 | 7577 | 1 |
| D | 0 | 11933 | 1 |
| Quadrant | Total seconds | Saturated seconds | Saturation percentage |
|---|---|---|---|
| A | 3671 | 5 | 0.136203% |
| B | 3671 | 27 | 0.735494% |
| C | 3671 | 3 | 0.081722% |
| D | 3671 | 96 | 2.615091% |
Noise dominated data is calculated using 1-second bins in cleaned event files. If a bin has >2000 counts, and if more than 50% of those come from <1% of pixels, then it is considered to be noise-dominated and hence unusable.
| Quadrant | # 1 sec bins | Bins with >0 counts | Bins with >2000 counts | High rate bins dominated by noise | Noise dominated (total time) | Noise dominated (detector-on time) | Marked lightcurve |
|---|---|---|---|---|---|---|---|
| A | 3672 | 3672 | 0 | 0 | 0.00% | 0.00% | 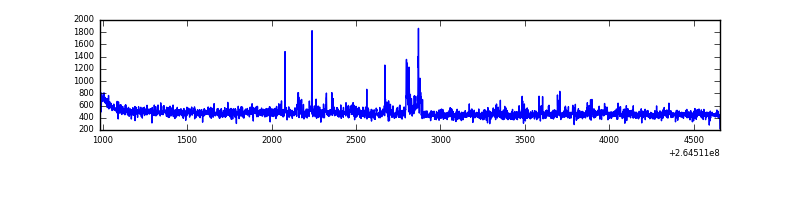 |
| B | 3672 | 3672 | 15 | 15 | 0.41% | 0.41% | 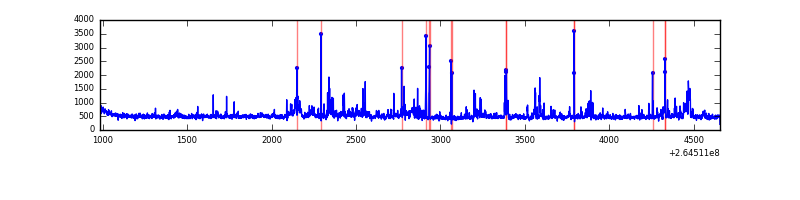 |
| C | 3672 | 3672 | 0 | 0 | 0.00% | 0.00% | 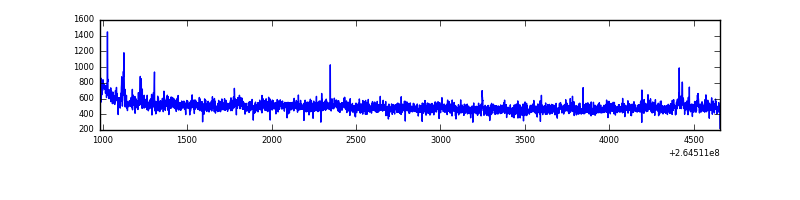 |
| D | 3672 | 3672 | 79 | 79 | 2.15% | 2.15% | 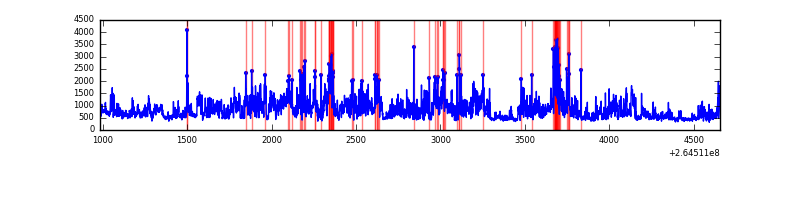 |
Top three noisy pixels from each quadrant. If the there are fewer than three noisy pixels in the level2.evt file, extra rows are filled as -1
| Pixel properties | Quadrant properties | ||||||
|---|---|---|---|---|---|---|---|
| Quadrant | DetID | PixID | Counts | Sigma | Mean | Median | Sigma |
| A | 12 | 189 | 80546 | 893.27 | 440 | 431 | 89.7 |
| A | 8 | 15 | 6078 | 62.96 | 440 | 431 | 89.7 |
| A | 0 | 226 | 3986 | 39.64 | 440 | 431 | 89.7 |
| B | 0 | 229 | 187398 | 2254.67 | 432 | 420 | 82.9 |
| B | 3 | 209 | 42961 | 512.98 | 432 | 420 | 82.9 |
| B | 0 | 219 | 34738 | 413.82 | 432 | 420 | 82.9 |
| C | 3 | 233 | 211076 | 2157.33 | 415 | 418 | 97.6 |
| C | 13 | 61 | 2879 | 25.2 | 415 | 418 | 97.6 |
| C | 12 | 4 | 1119 | 7.18 | 415 | 418 | 97.6 |
| D | 13 | 122 | 1437090 | 14489.94 | 417 | 407 | 99.2 |
| D | 10 | 199 | 37581 | 374.93 | 417 | 407 | 99.2 |
| D | 5 | 222 | 26912 | 267.32 | 417 | 407 | 99.2 |
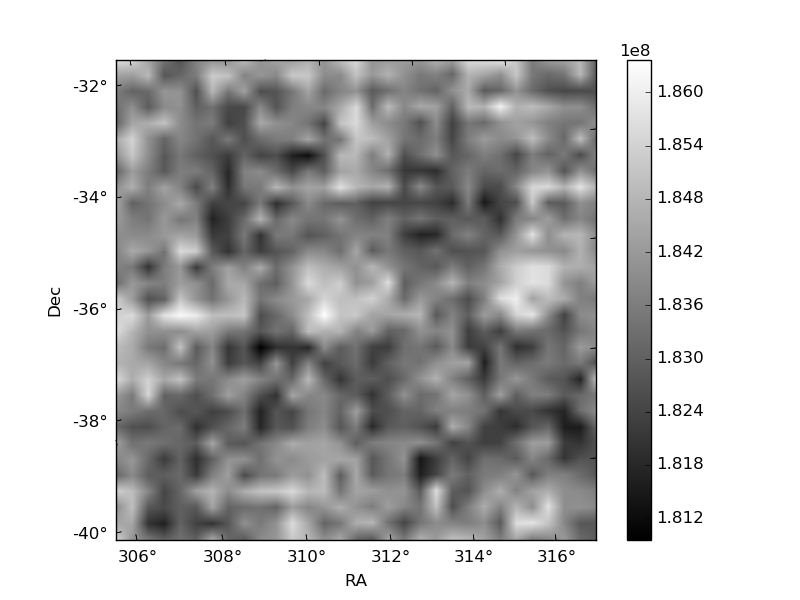
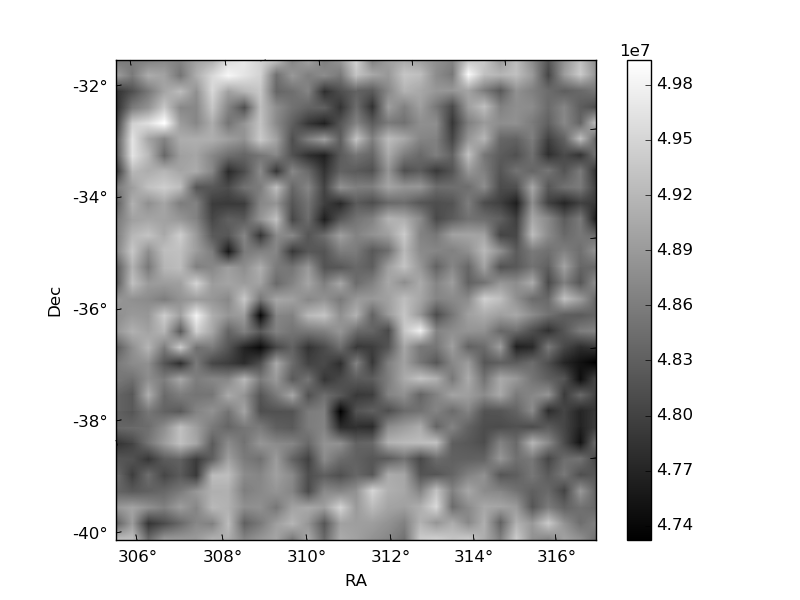
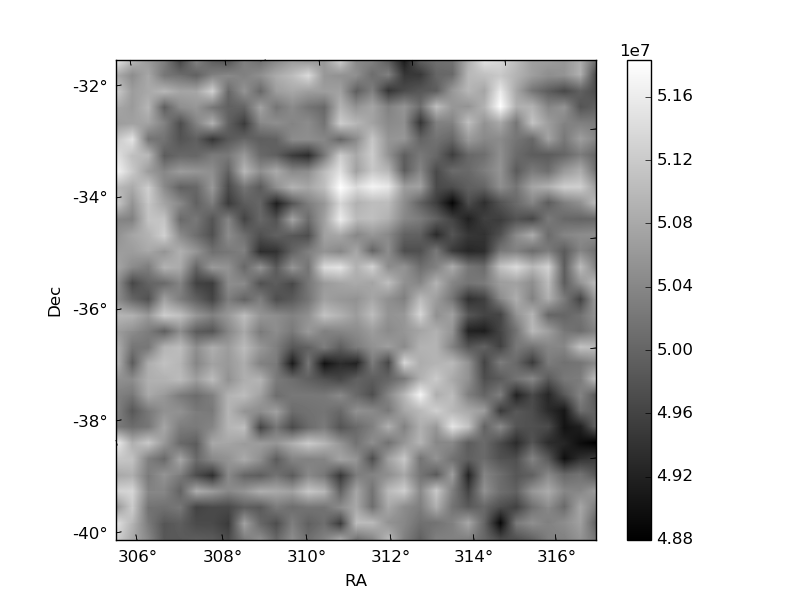
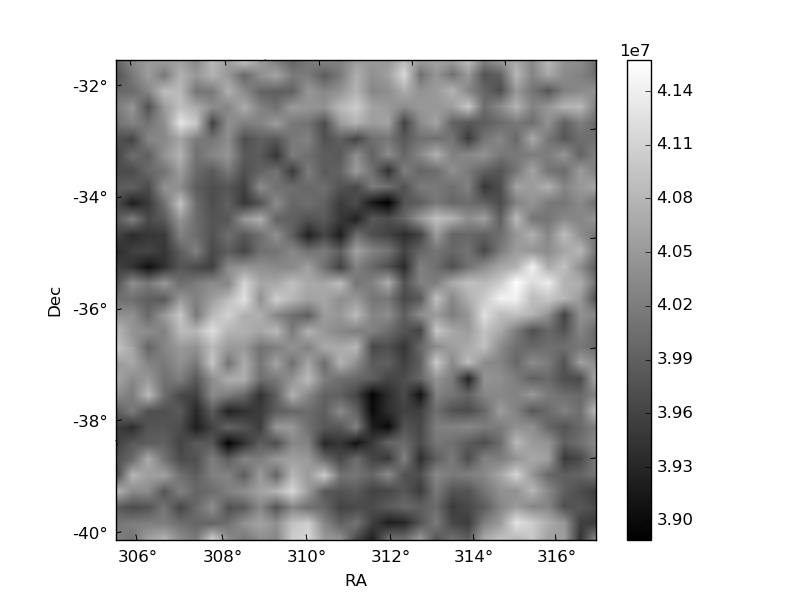
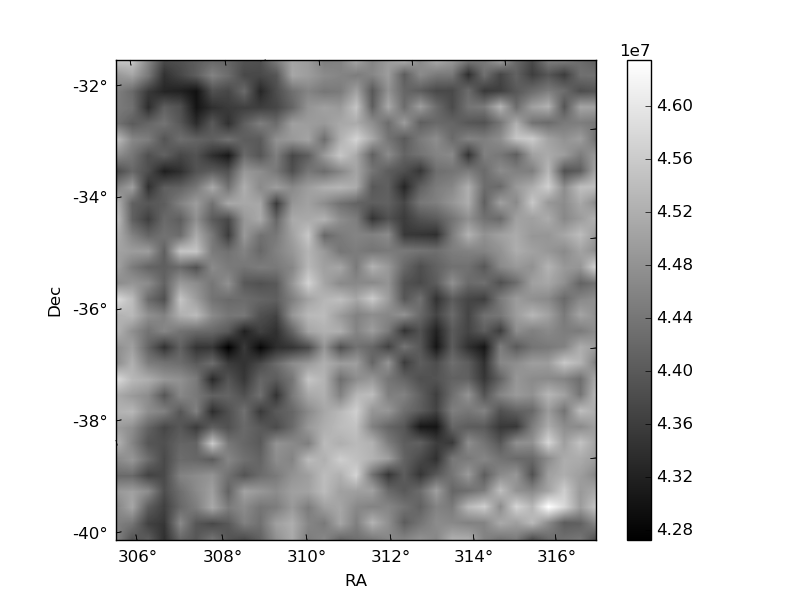
Histogram calculated using DETX and DETY for each event in the final _common_clean file
| Quadrant A | 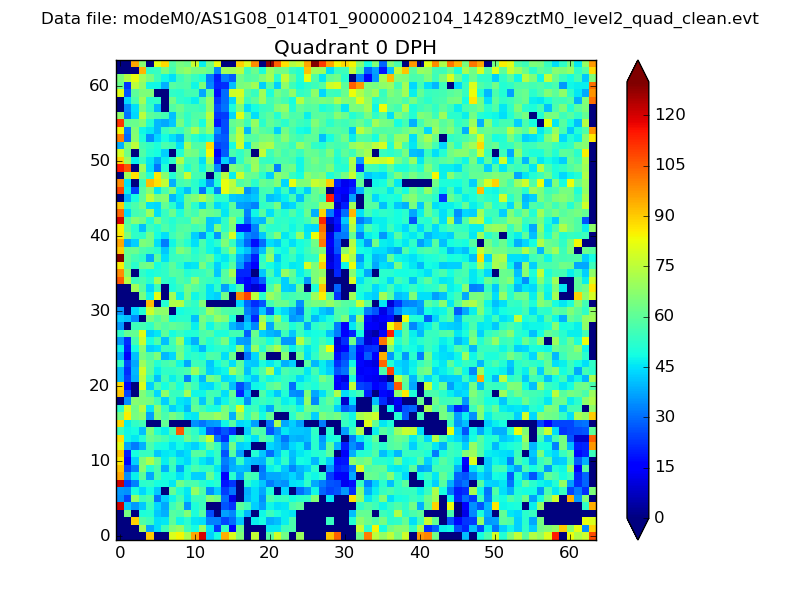 |
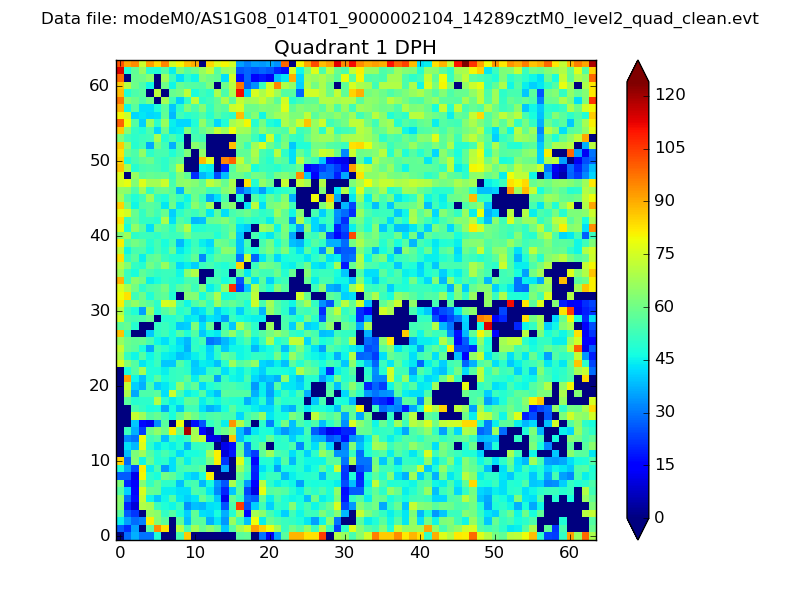 |
Quadrant B |
|---|---|---|---|
| Quadrant D | 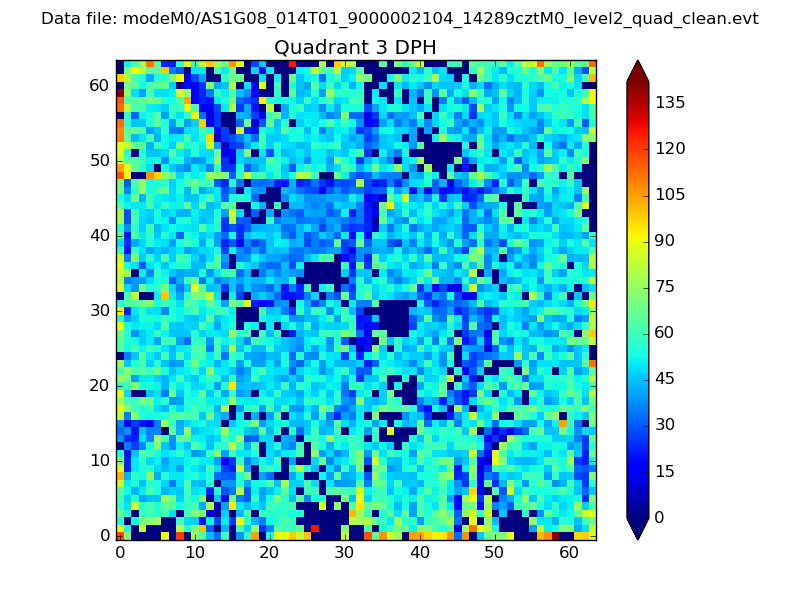 |
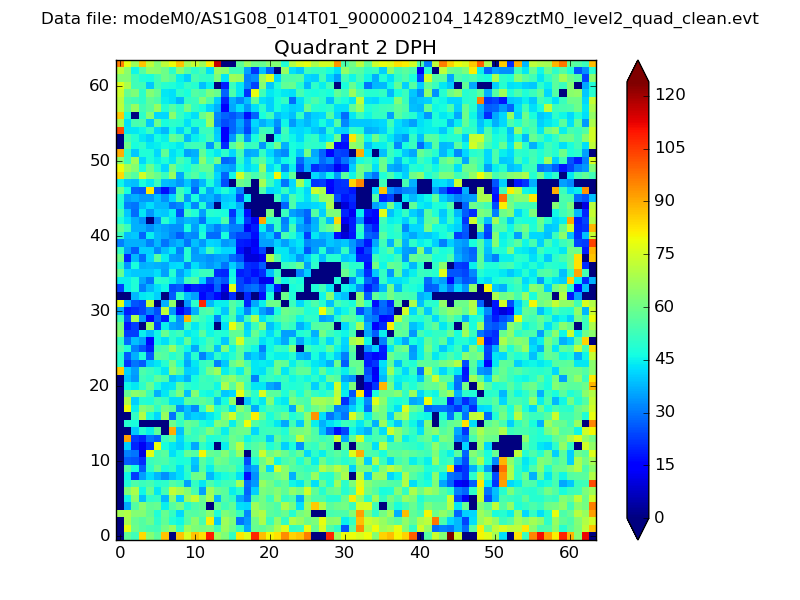 |
Quadrant C |
| Plot type | Count rate plots | Images |
|---|---|---|
| Comparison with Poisson distribution Blue bars denote a histogram of data divided into 1 sec bins. Red curve is a Poisson curve with rate = median count rate of data. |
 |
 |
| Quadrant-wise count rates Data is divided into 100 sec bins |
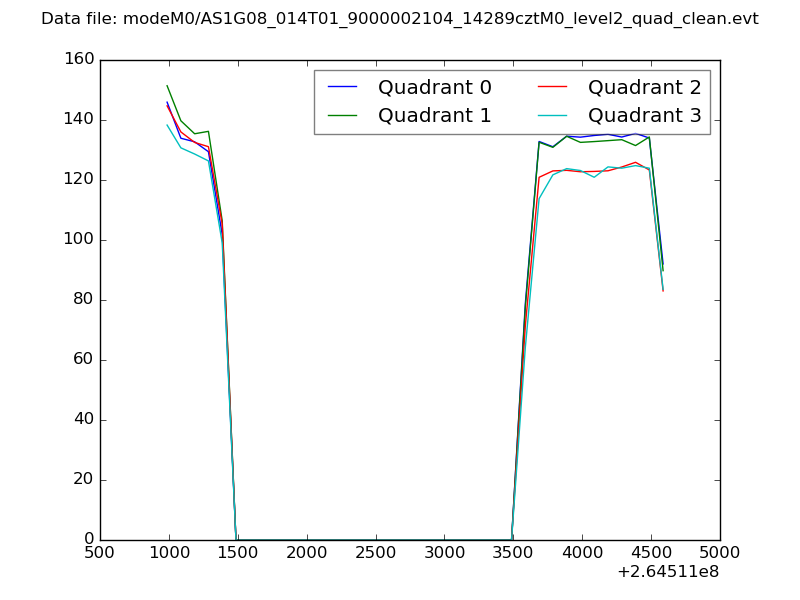 |
|
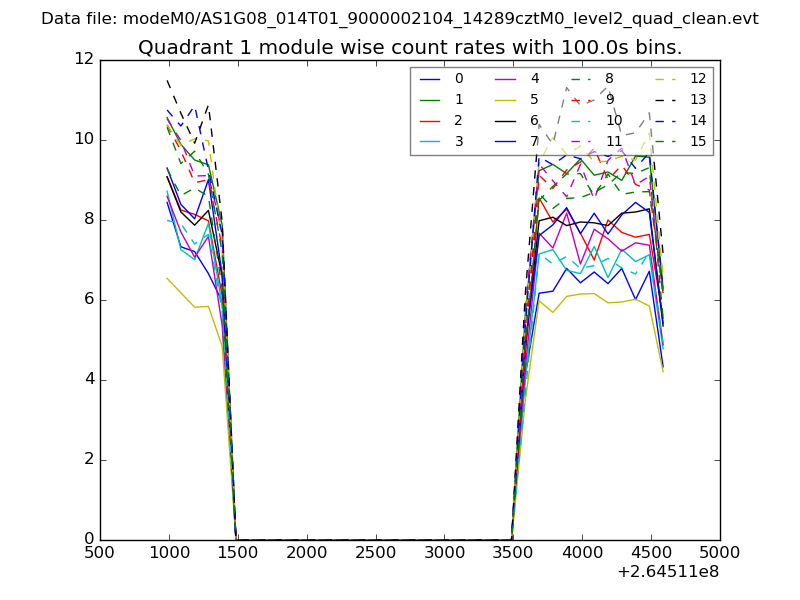
| Module-wise count rates for Quadrant A Data is divided into 100 sec bins |
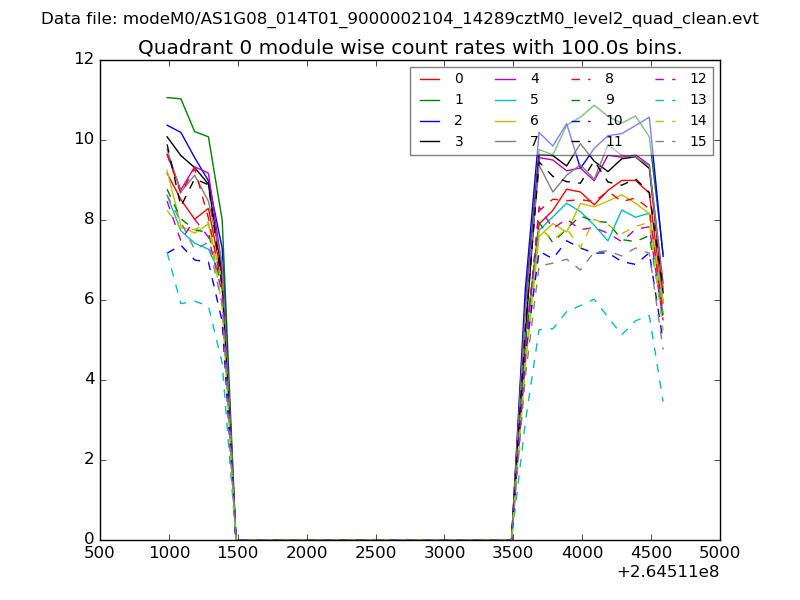 |
 |
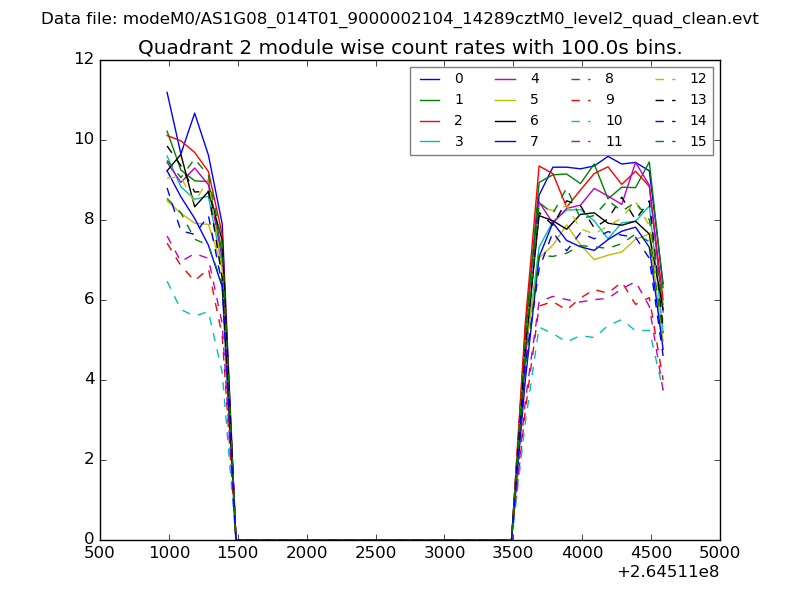
| Module-wise count rates for Quadrant B Data is divided into 100 sec bins |
 |
 |
| Module-wise count rates for Quadrant C Data is divided into 100 sec bins |
 |
 |
| Module-wise count rates for Quadrant D Data is divided into 100 sec bins |
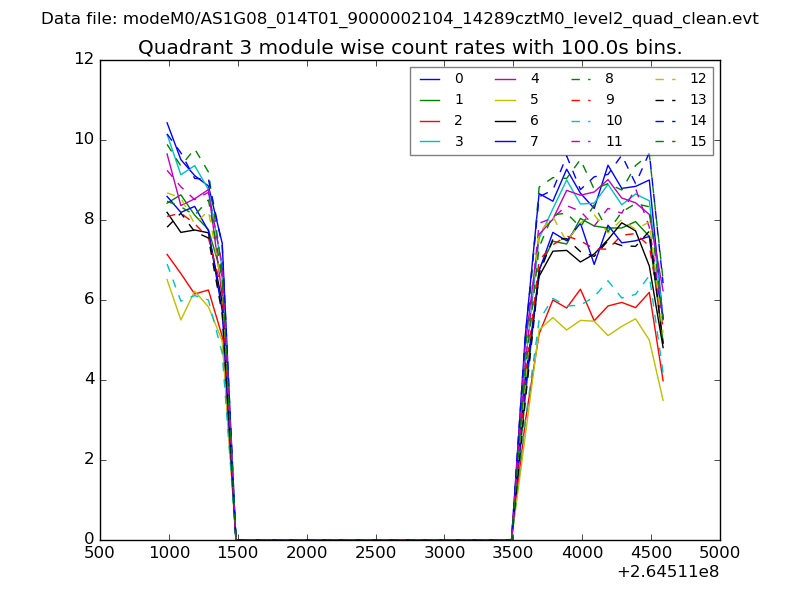 |
 |
| Parameter | Plot |
|---|---|
| CZT HV Monitor | 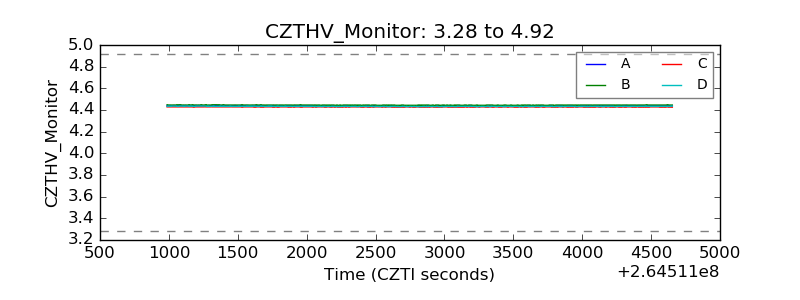 |
| D_VDD | 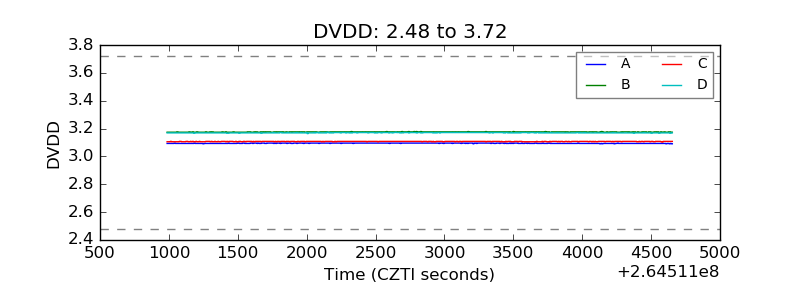 |
| Temperature 1 | 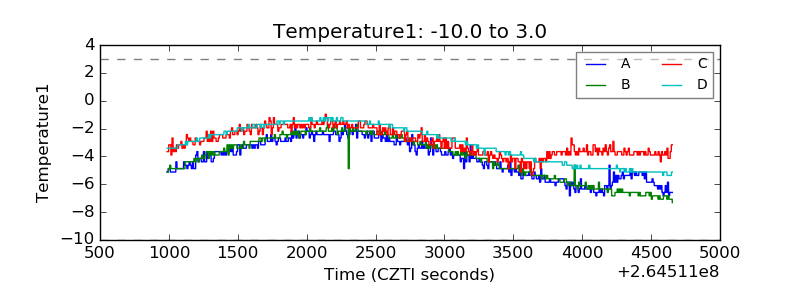 |
| Veto HV Monitor | 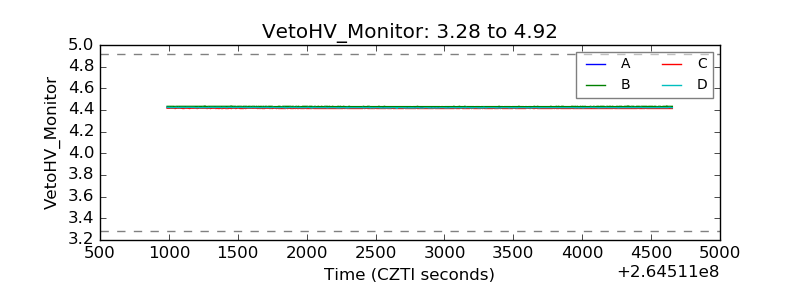 |
| Veto LLD | 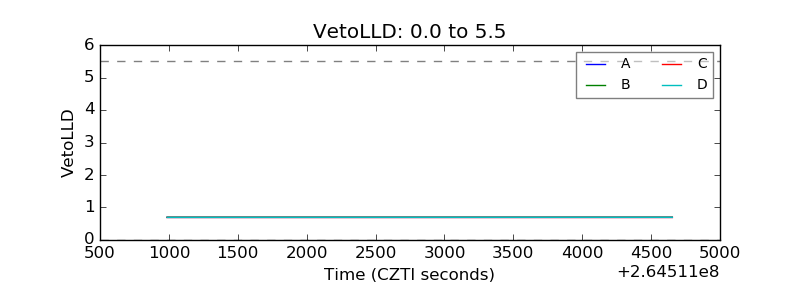 |
| Alpha Counter | 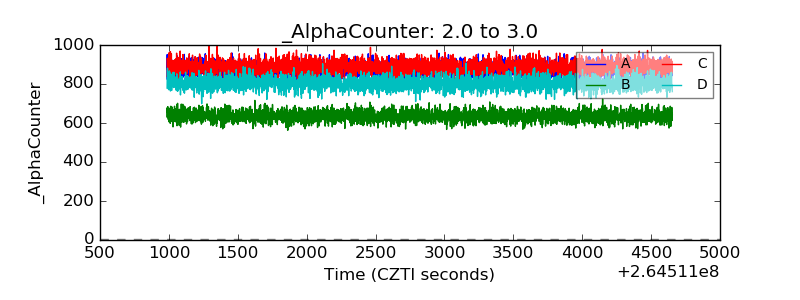 |
| _CPM_Rate | 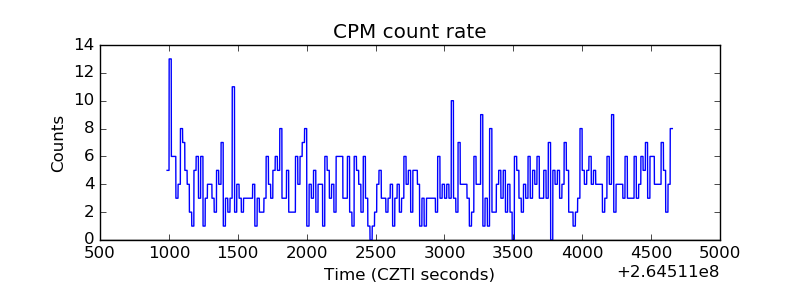 |
| CZT Counter | 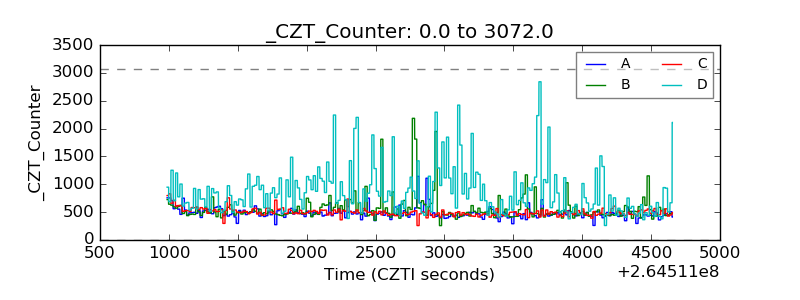 |
| +2.5 Volts monitor |  |
| +5 Volts monitor |  |
| _ROLL_ROT | 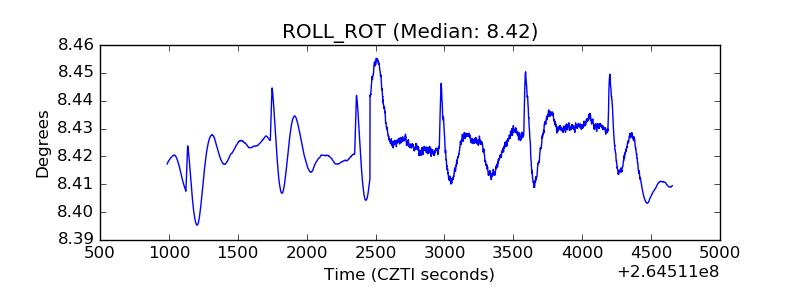 |
| _Roll_DEC | 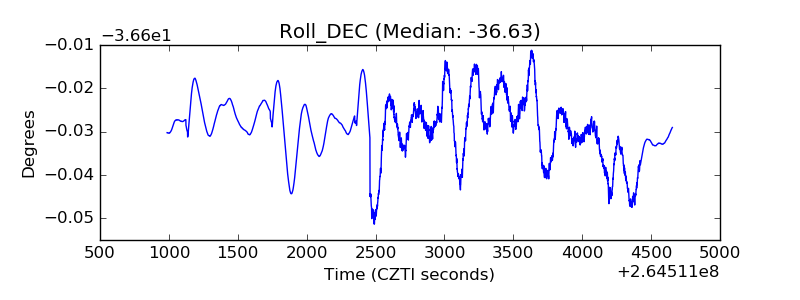 |
| _Roll_RA | 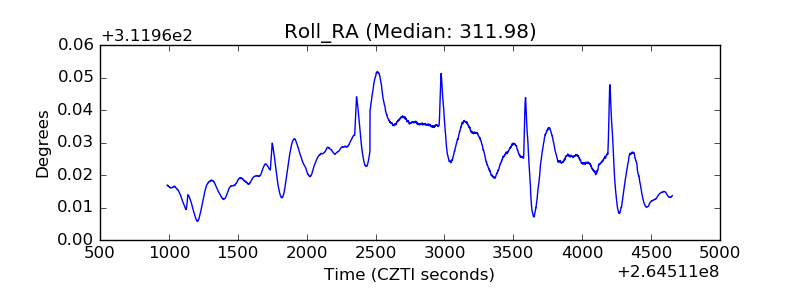 |
| Veto Counter |  |