| Param | Original file | Final file |
|---|---|---|
| Filename | modeM0/AS1A04_231T01_9000002106_14289cztM0_level2.evt | modeM0/AS1A04_231T01_9000002106_14289cztM0_level2_quad_clean.evt |
| Size (bytes) | 236,393,280 | 34,030,080 |
| Size | 225.4 MB | 32.5 MB |
| Events in quadrant A | 1,390,491 | 211,610 |
| Events in quadrant B | 1,505,030 | 214,194 |
| Events in quadrant C | 1,525,809 | 212,889 |
| Events in quadrant D | 2,555,881 | 201,224 |
| Mode SS | |||
|---|---|---|---|
| Quadrant | BADHDUFLAG | Total packets | Discarded packets |
| A | 0 | 56 | 0 |
| B | 0 | 56 | 0 |
| C | 0 | 56 | 0 |
| D | 0 | 56 | 0 |
| Mode M0 | |||
|---|---|---|---|
| Quadrant | BADHDUFLAG | Total packets | Discarded packets |
| A | 0 | 5746 | 2 |
| B | 0 | 6098 | 1 |
| C | 0 | 6131 | 1 |
| D | 0 | 9467 | 1 |
| Mode M9 | |||
|---|---|---|---|
| Quadrant | BADHDUFLAG | Total packets | Discarded packets |
| A | 0 | 5 | 0 |
| B | 0 | 5 | 0 |
| C | 0 | 5 | 0 |
| D | 0 | 5 | 0 |
| Quadrant | Total seconds | Saturated seconds | Saturation percentage |
|---|---|---|---|
| A | 2649 | 116 | 4.379011% |
| B | 2649 | 131 | 4.945262% |
| C | 2649 | 57 | 2.151755% |
| D | 2649 | 263 | 9.928275% |
Noise dominated data is calculated using 1-second bins in cleaned event files. If a bin has >2000 counts, and if more than 50% of those come from <1% of pixels, then it is considered to be noise-dominated and hence unusable.
| Quadrant | # 1 sec bins | Bins with >0 counts | Bins with >2000 counts | High rate bins dominated by noise | Noise dominated (total time) | Noise dominated (detector-on time) | Marked lightcurve |
|---|---|---|---|---|---|---|---|
| A | 3210 | 2651 | 9 | 9 | 0.28% | 0.34% | 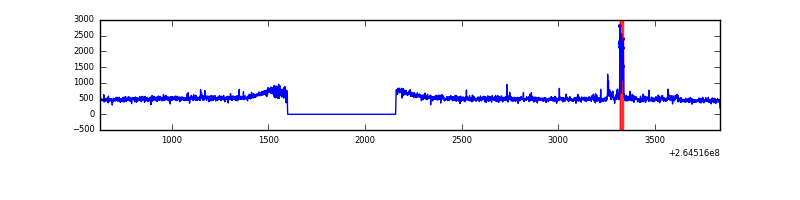 |
| B | 3210 | 2651 | 13 | 13 | 0.40% | 0.49% | 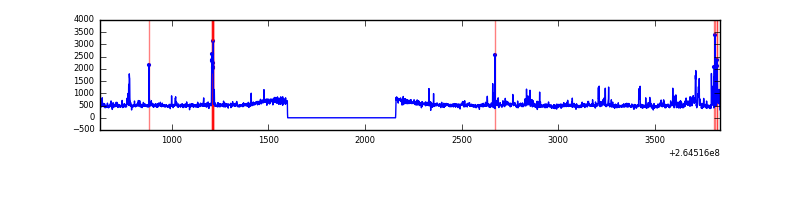 |
| C | 3210 | 2651 | 1 | 1 | 0.03% | 0.04% | 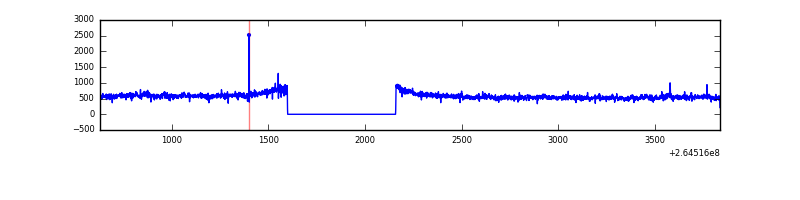 |
| D | 3210 | 2650 | 66 | 66 | 2.06% | 2.49% | 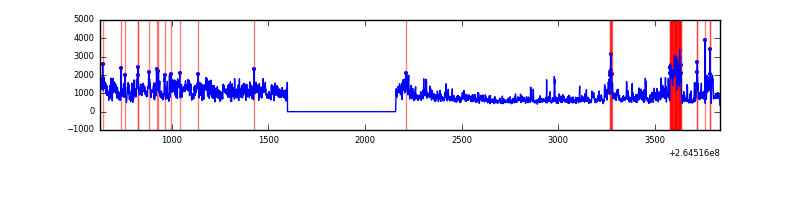 |
Top three noisy pixels from each quadrant. If the there are fewer than three noisy pixels in the level2.evt file, extra rows are filled as -1
| Pixel properties | Quadrant properties | ||||||
|---|---|---|---|---|---|---|---|
| Quadrant | DetID | PixID | Counts | Sigma | Mean | Median | Sigma |
| A | 12 | 189 | 55678 | 783.9 | 342 | 333 | 70.6 |
| A | 8 | 15 | 14751 | 204.22 | 342 | 333 | 70.6 |
| A | 0 | 226 | 3151 | 39.91 | 342 | 333 | 70.6 |
| B | 0 | 229 | 104616 | 1581.42 | 337 | 328 | 65.9 |
| B | 10 | 245 | 21379 | 319.22 | 337 | 328 | 65.9 |
| B | 0 | 219 | 17424 | 259.24 | 337 | 328 | 65.9 |
| C | 3 | 233 | 225316 | 2915.66 | 332 | 332 | 77.2 |
| C | 14 | 234 | 2387 | 26.63 | 332 | 332 | 77.2 |
| C | 13 | 61 | 2278 | 25.22 | 332 | 332 | 77.2 |
| D | 13 | 122 | 829313 | 10527.07 | 328 | 319 | 78.7 |
| D | 5 | 222 | 288893 | 3664.49 | 328 | 319 | 78.7 |
| D | 12 | 110 | 114977 | 1456.0 | 328 | 319 | 78.7 |
Histogram calculated using DETX and DETY for each event in the final _common_clean file
| Quadrant A | 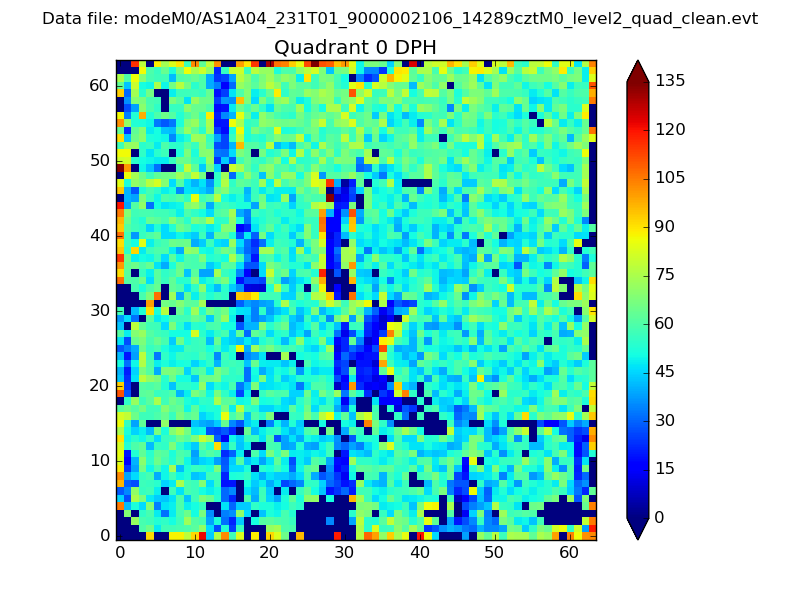 |
 |
Quadrant B |
|---|---|---|---|
| Quadrant D | 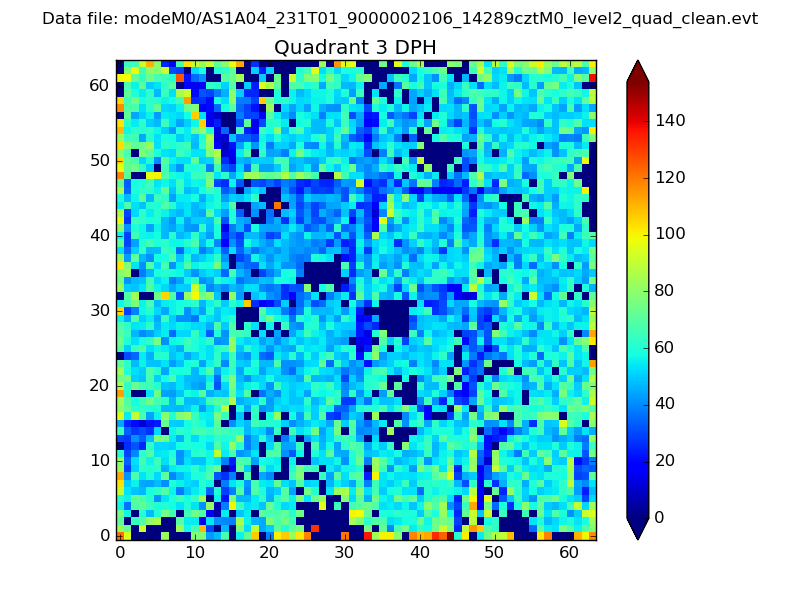 |
 |
Quadrant C |
| Plot type | Count rate plots | Images |
|---|---|---|
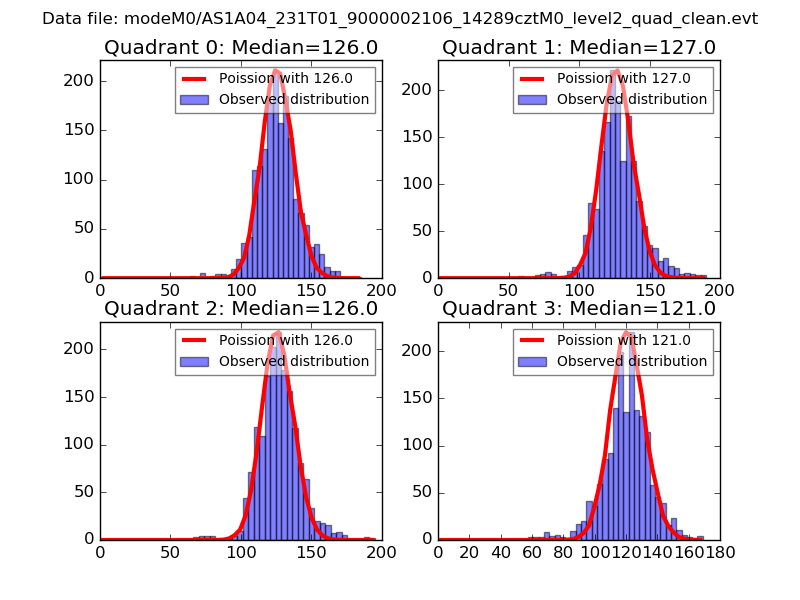
| Comparison with Poisson distribution Blue bars denote a histogram of data divided into 1 sec bins. Red curve is a Poisson curve with rate = median count rate of data. |
 |
 |
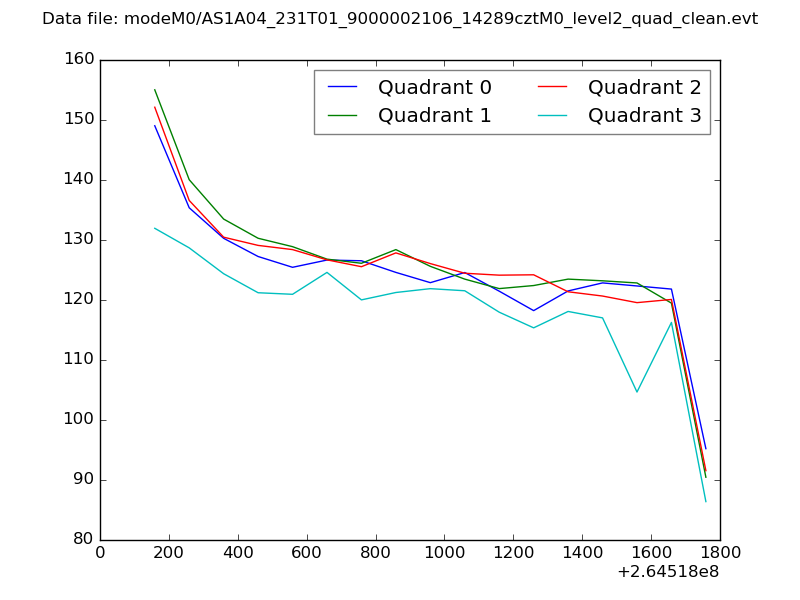
| Quadrant-wise count rates Data is divided into 100 sec bins |
 |
|
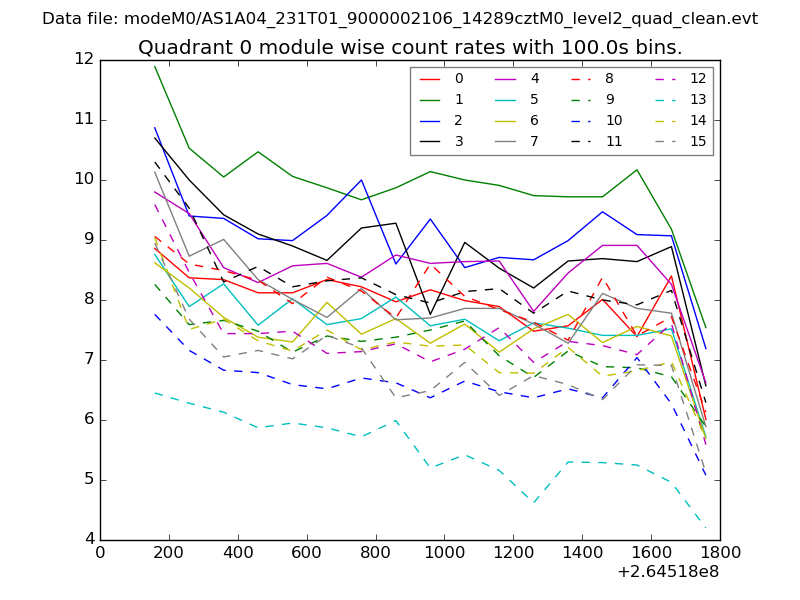
| Module-wise count rates for Quadrant A Data is divided into 100 sec bins |
 |
 |
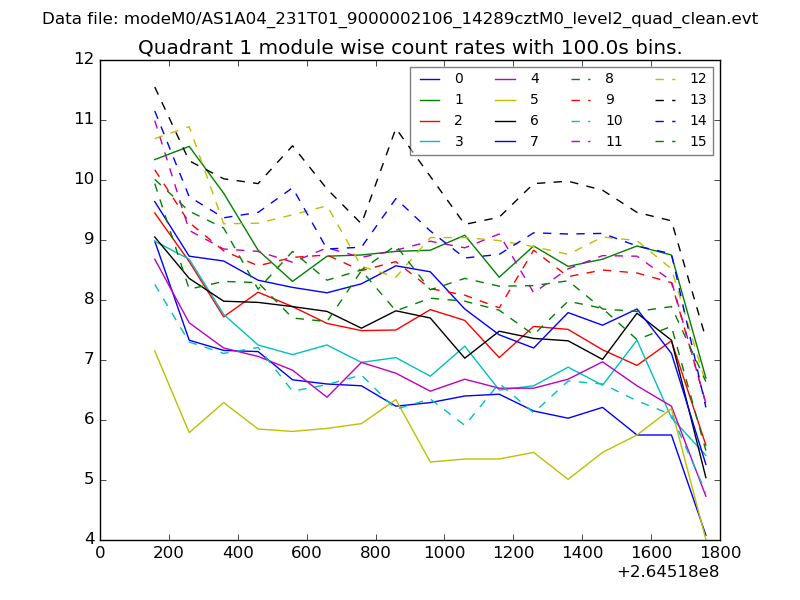
| Module-wise count rates for Quadrant B Data is divided into 100 sec bins |
 |
 |
| Module-wise count rates for Quadrant C Data is divided into 100 sec bins |
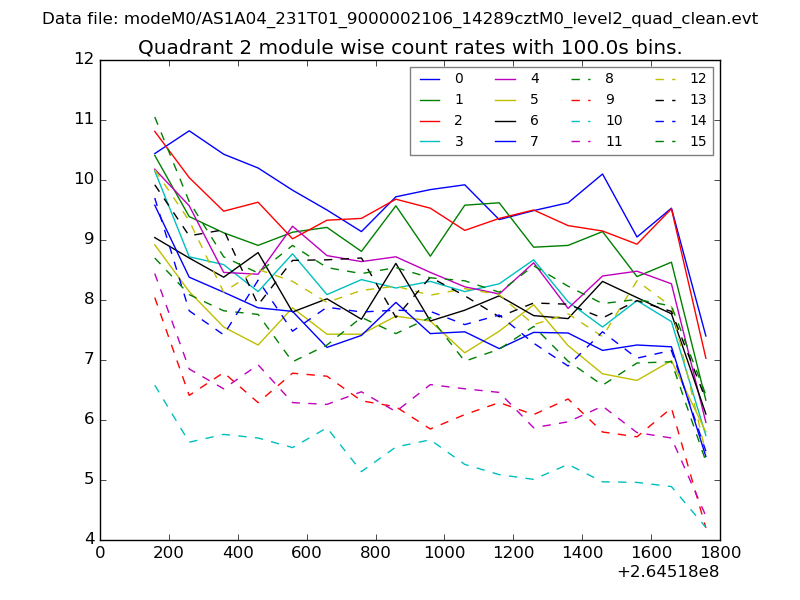 |
 |
| Module-wise count rates for Quadrant D Data is divided into 100 sec bins |
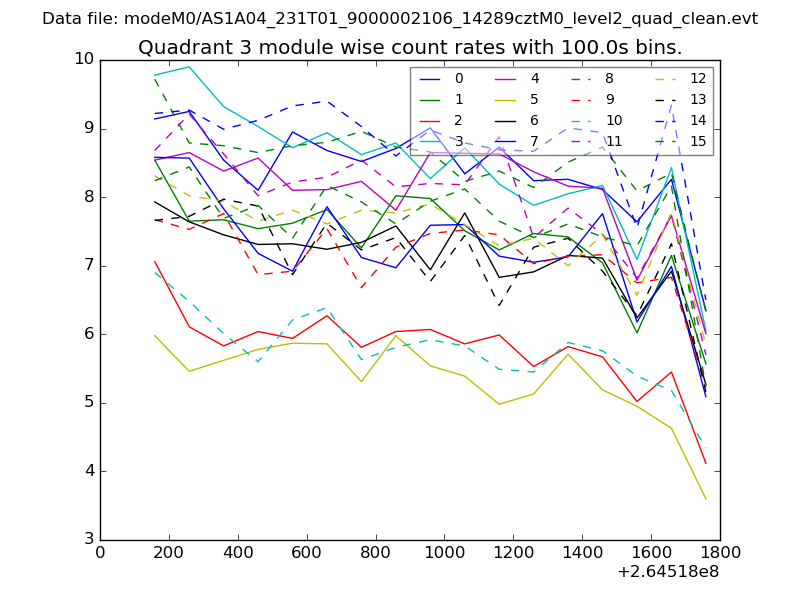 |
 |
| Parameter | Plot |
|---|---|
| CZT HV Monitor |  |
| D_VDD | 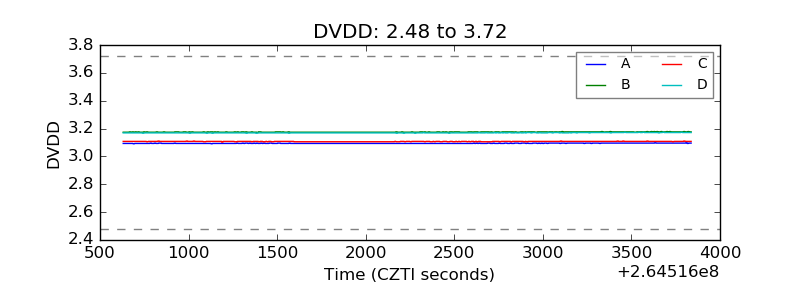 |
| Temperature 1 | 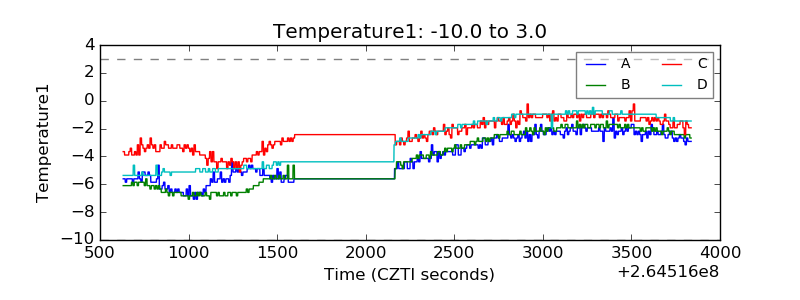 |
| Veto HV Monitor | 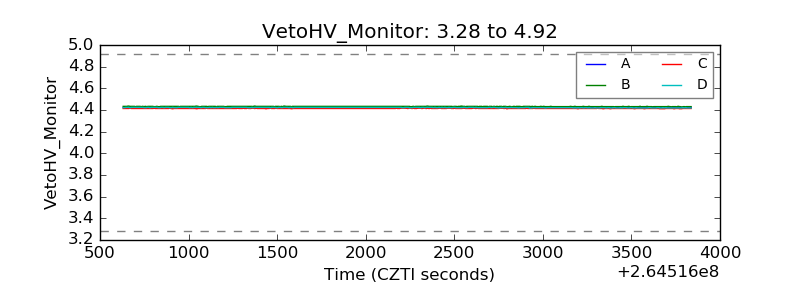 |
| Veto LLD | 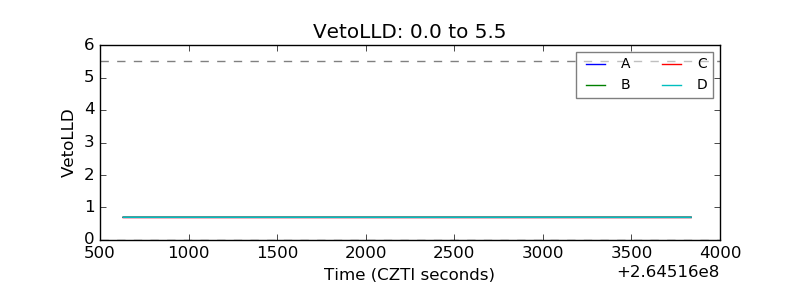 |
| Alpha Counter | 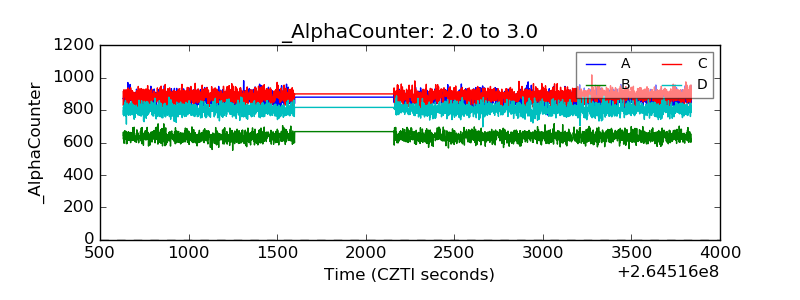 |
| _CPM_Rate | 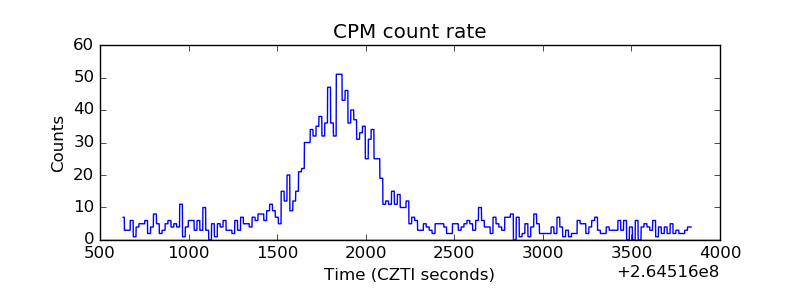 |
| CZT Counter | 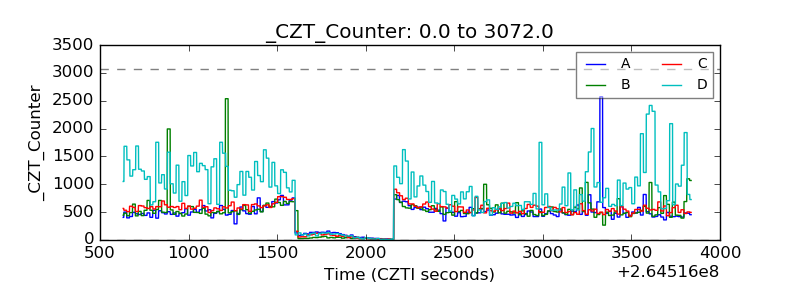 |
| +2.5 Volts monitor |  |
| +5 Volts monitor |  |
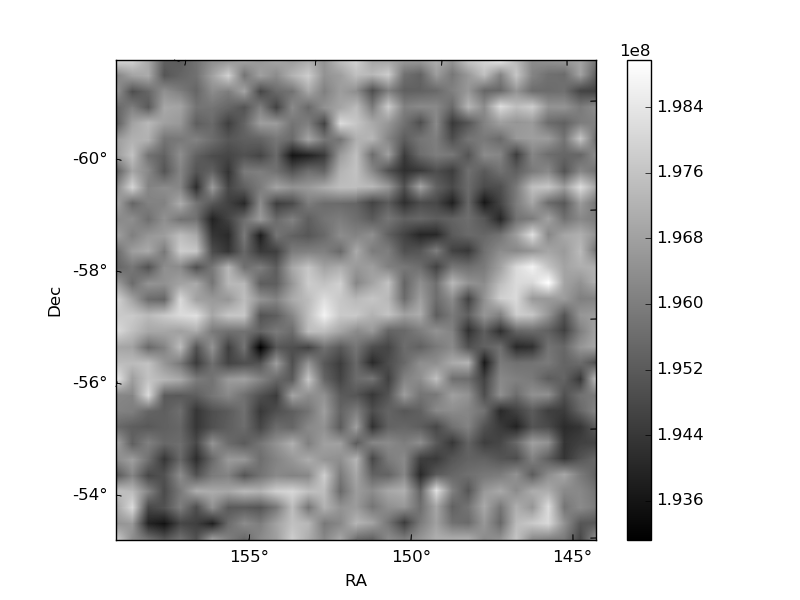
| _ROLL_ROT | 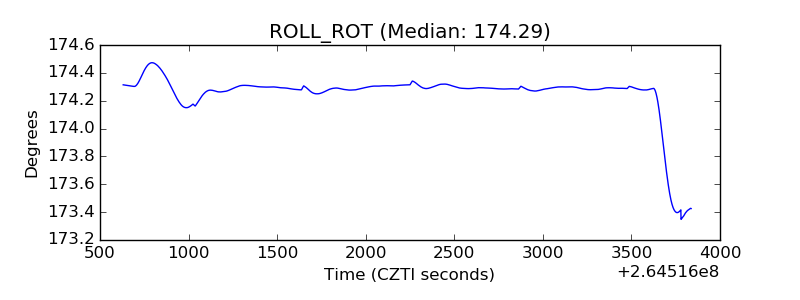 |
| _Roll_DEC | 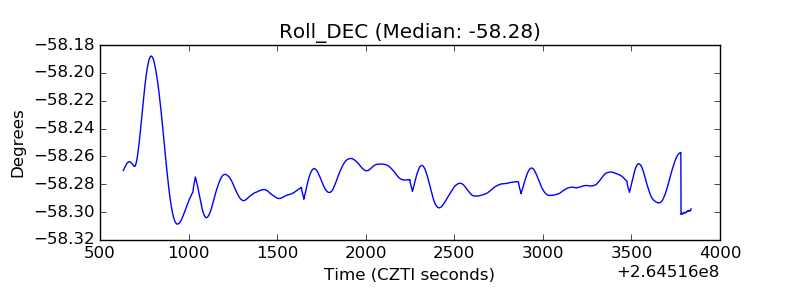 |
| _Roll_RA | 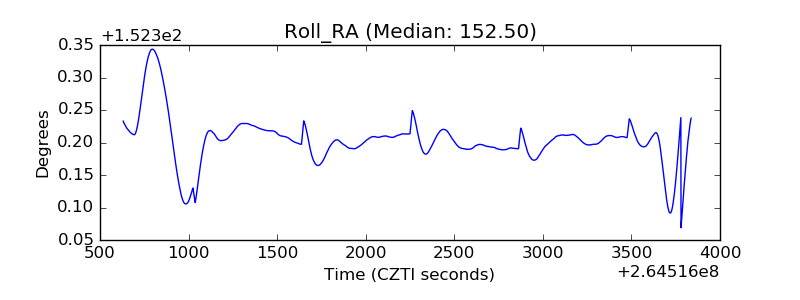 |
| Veto Counter | 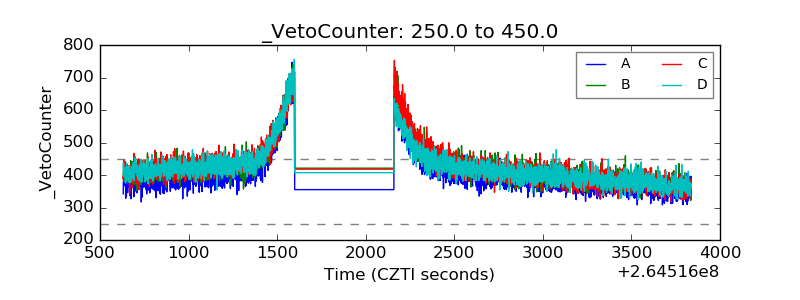 |