| Param | Original file | Final file |
|---|---|---|
| Filename | modeM0/AS1A04_231T01_9000002106_14290cztM0_level2.evt | modeM0/AS1A04_231T01_9000002106_14290cztM0_level2_quad_clean.evt |
| Size (bytes) | 557,087,040 | 97,931,520 |
| Size | 531.3 MB | 93.4 MB |
| Events in quadrant A | 3,448,487 | 640,640 |
| Events in quadrant B | 3,925,864 | 633,603 |
| Events in quadrant C | 3,548,931 | 625,704 |
| Events in quadrant D | 5,490,289 | 594,524 |
| Mode SS | |||
|---|---|---|---|
| Quadrant | BADHDUFLAG | Total packets | Discarded packets |
| A | 0 | 138 | 0 |
| B | 0 | 138 | 0 |
| C | 0 | 138 | 0 |
| D | 0 | 138 | 0 |
| Mode M0 | |||
|---|---|---|---|
| Quadrant | BADHDUFLAG | Total packets | Discarded packets |
| A | 0 | 14620 | 2 |
| B | 0 | 16118 | 1 |
| C | 0 | 14711 | 1 |
| D | 0 | 20899 | 1 |
| Mode M9 | |||
|---|---|---|---|
| Quadrant | BADHDUFLAG | Total packets | Discarded packets |
| A | 0 | 3 | 0 |
| B | 0 | 3 | 0 |
| C | 0 | 3 | 0 |
| D | 0 | 3 | 0 |
| Quadrant | Total seconds | Saturated seconds | Saturation percentage |
|---|---|---|---|
| A | 6756 | 52 | 0.769686% |
| B | 6756 | 162 | 2.397869% |
| C | 6756 | 14 | 0.207223% |
| D | 6756 | 449 | 6.645944% |
Noise dominated data is calculated using 1-second bins in cleaned event files. If a bin has >2000 counts, and if more than 50% of those come from <1% of pixels, then it is considered to be noise-dominated and hence unusable.
| Quadrant | # 1 sec bins | Bins with >0 counts | Bins with >2000 counts | High rate bins dominated by noise | Noise dominated (total time) | Noise dominated (detector-on time) | Marked lightcurve |
|---|---|---|---|---|---|---|---|
| A | 7042 | 6758 | 9 | 9 | 0.13% | 0.13% | 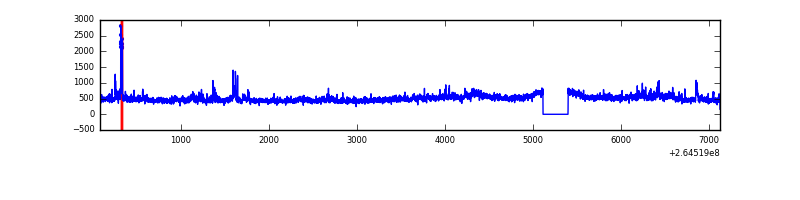 |
| B | 7042 | 6758 | 79 | 79 | 1.12% | 1.17% | 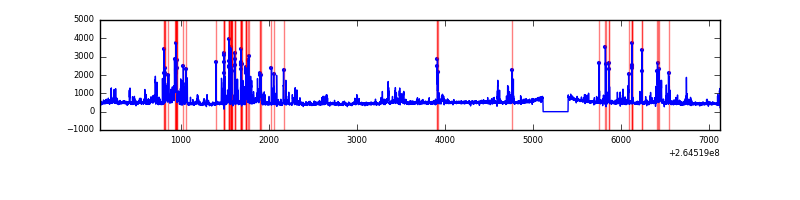 |
| C | 7042 | 6758 | 0 | 0 | 0.00% | 0.00% | 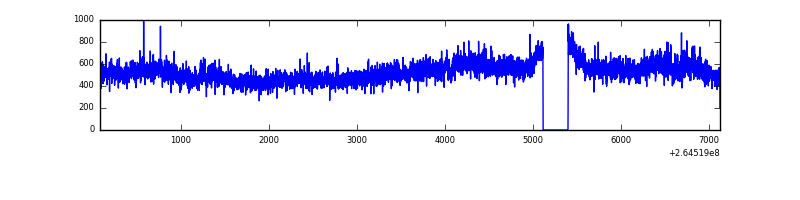 |
| D | 7042 | 6758 | 355 | 355 | 5.04% | 5.25% | 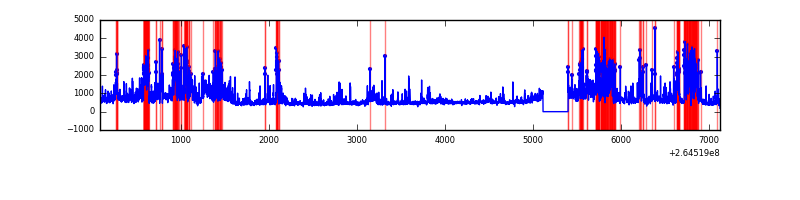 |
Top three noisy pixels from each quadrant. If the there are fewer than three noisy pixels in the level2.evt file, extra rows are filled as -1
| Pixel properties | Quadrant properties | ||||||
|---|---|---|---|---|---|---|---|
| Quadrant | DetID | PixID | Counts | Sigma | Mean | Median | Sigma |
| A | 8 | 15 | 251939 | 1559.72 | 793 | 776 | 161.0 |
| A | 12 | 189 | 128910 | 795.71 | 793 | 776 | 161.0 |
| A | 15 | 69 | 8332 | 46.92 | 793 | 776 | 161.0 |
| B | 0 | 229 | 405080 | 2690.9 | 783 | 761 | 150.3 |
| B | 10 | 245 | 249055 | 1652.49 | 783 | 761 | 150.3 |
| B | 0 | 182 | 87560 | 577.68 | 783 | 761 | 150.3 |
| C | 3 | 233 | 578833 | 3317.55 | 759 | 764 | 174.2 |
| C | 13 | 61 | 5579 | 27.63 | 759 | 764 | 174.2 |
| C | 8 | 128 | 4309 | 20.34 | 759 | 764 | 174.2 |
| D | 13 | 122 | 1614644 | 9022.51 | 750 | 732 | 178.9 |
| D | 5 | 222 | 580650 | 3242.01 | 750 | 732 | 178.9 |
| D | 12 | 110 | 203132 | 1131.51 | 750 | 732 | 178.9 |
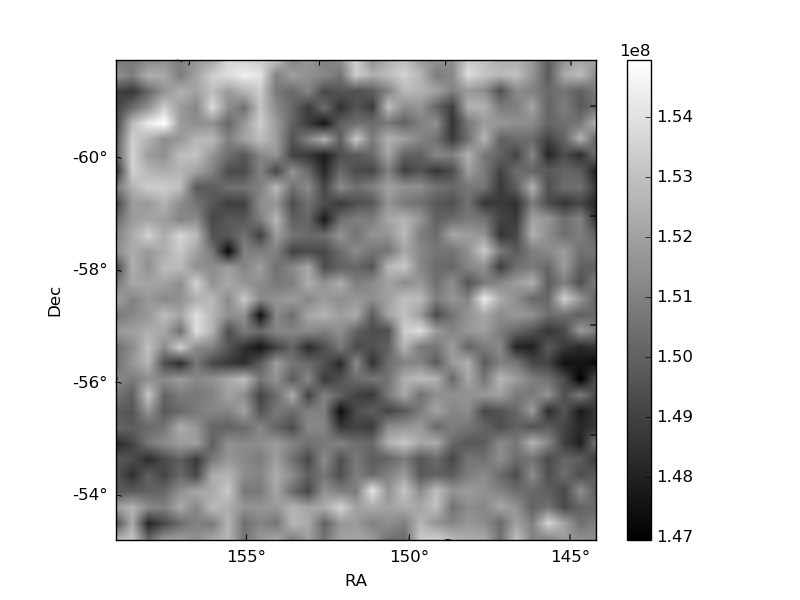
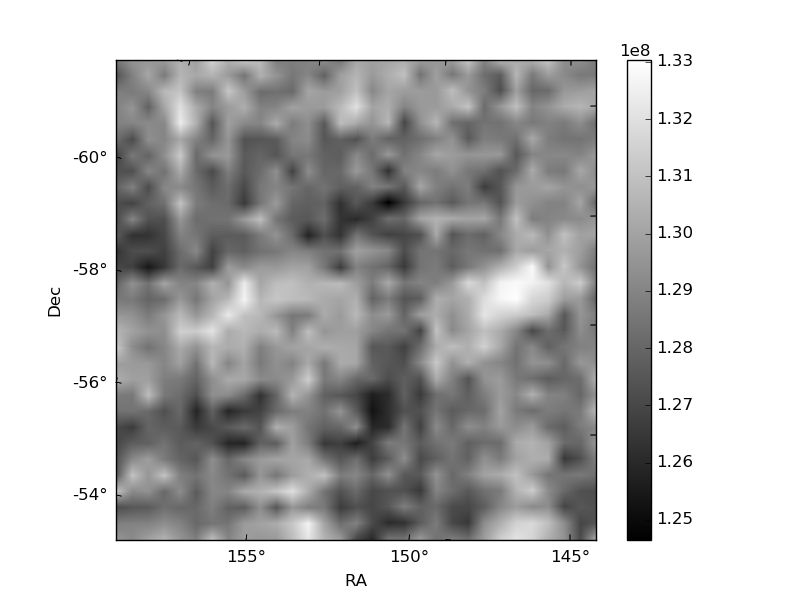
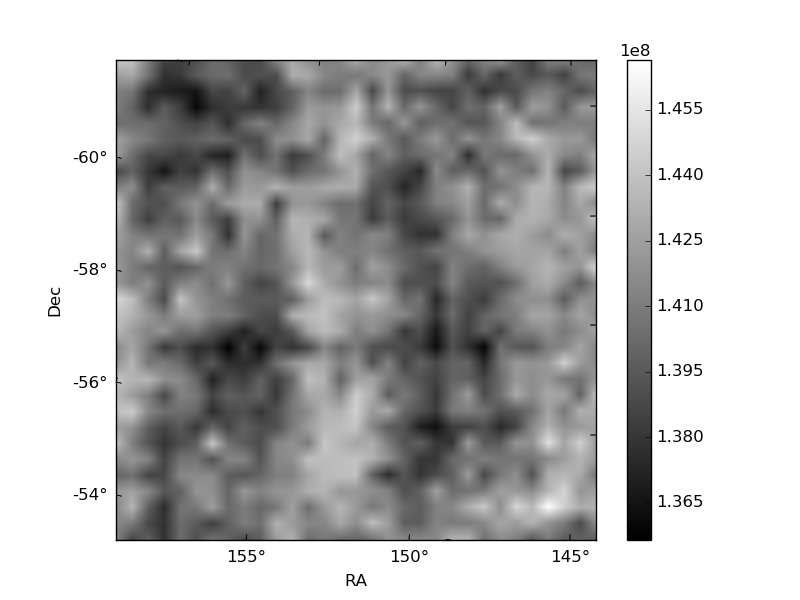
Histogram calculated using DETX and DETY for each event in the final _common_clean file
| Quadrant A |  |
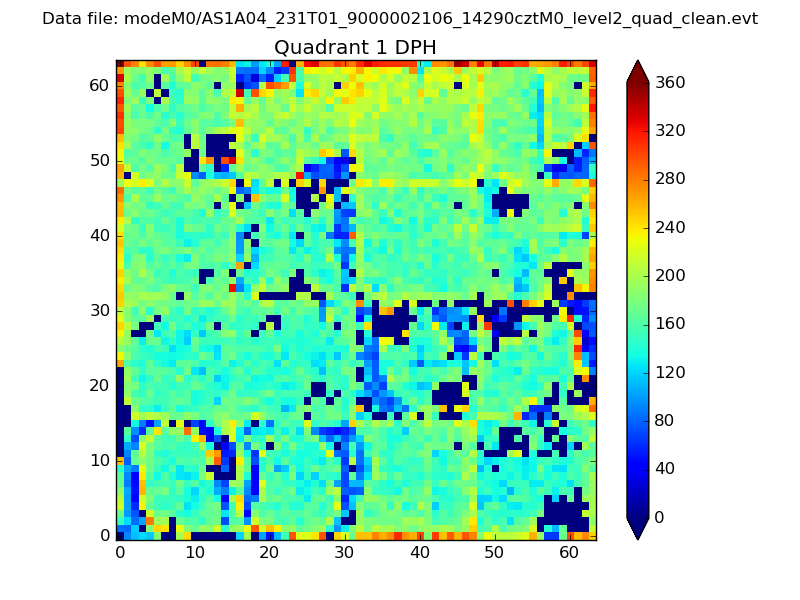 |
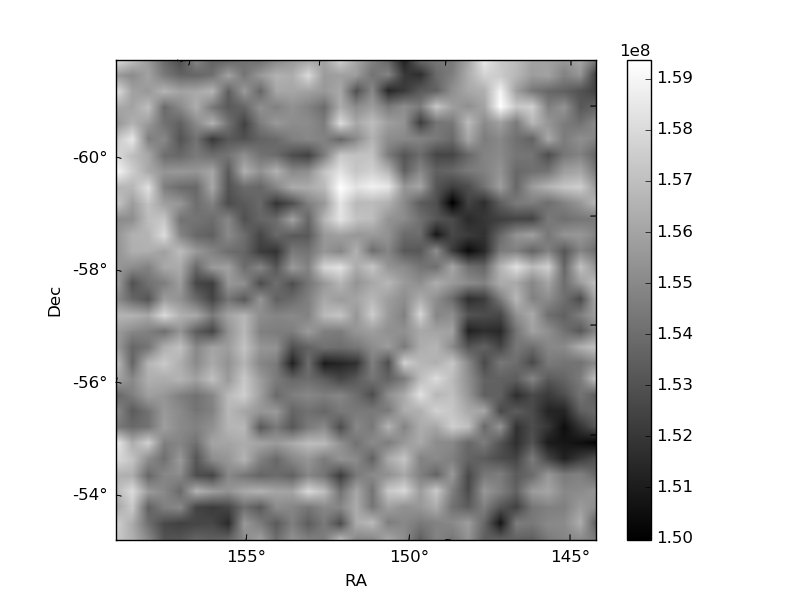
Quadrant B |
|---|---|---|---|
| Quadrant D |  |
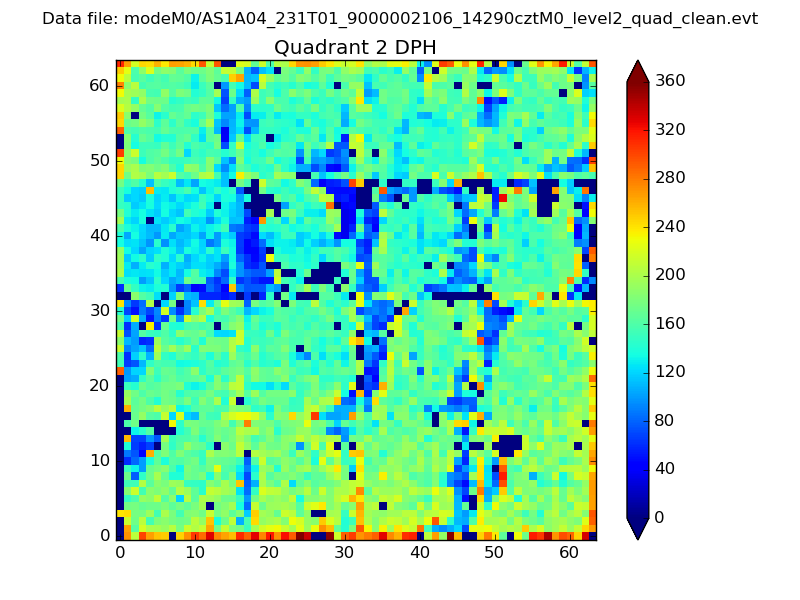 |
Quadrant C |
| Plot type | Count rate plots | Images |
|---|---|---|
| Comparison with Poisson distribution Blue bars denote a histogram of data divided into 1 sec bins. Red curve is a Poisson curve with rate = median count rate of data. |
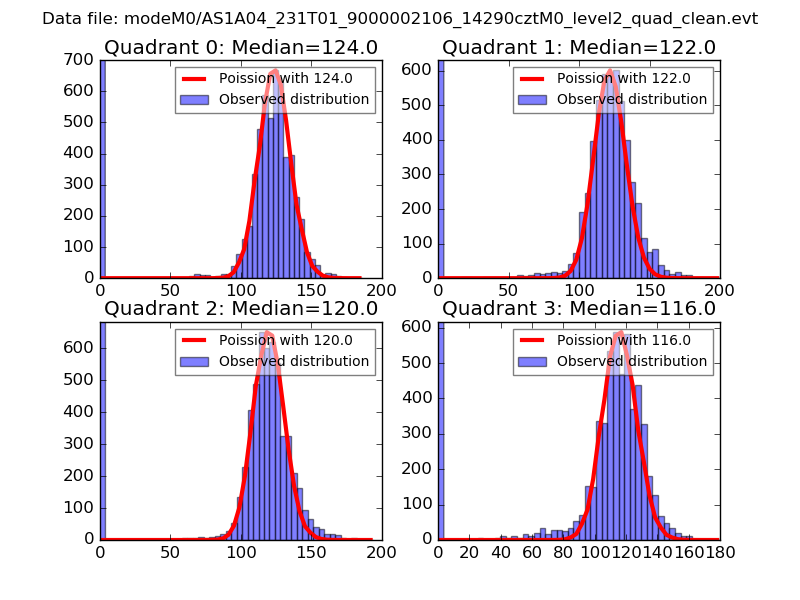 |
 |
| Quadrant-wise count rates Data is divided into 100 sec bins |
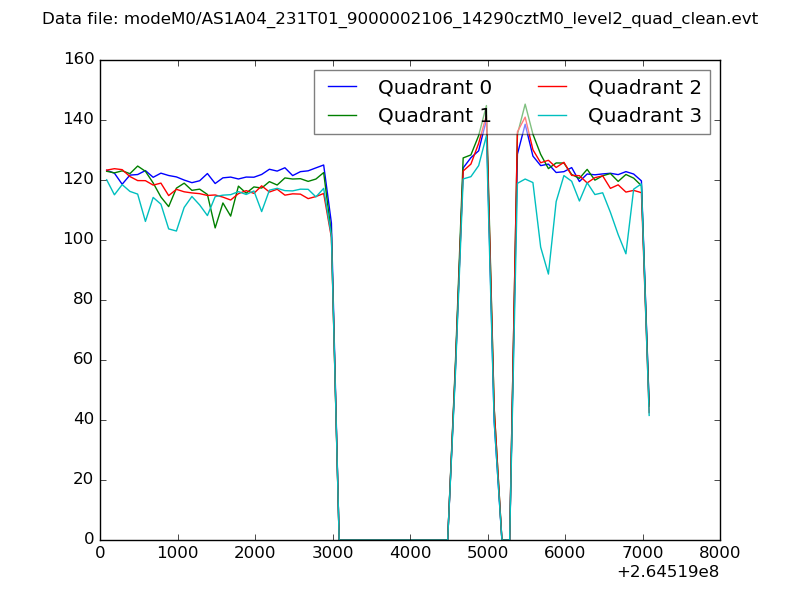 |
|
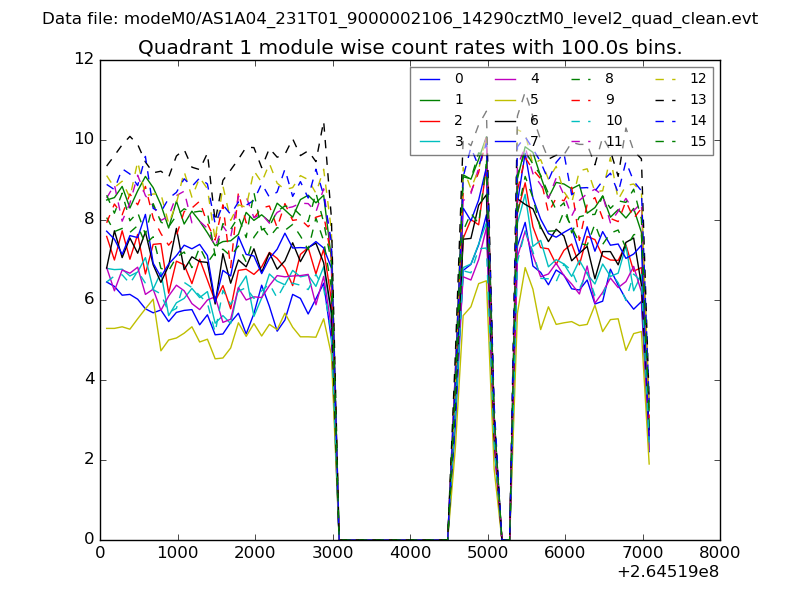
| Module-wise count rates for Quadrant A Data is divided into 100 sec bins |
 |
 |
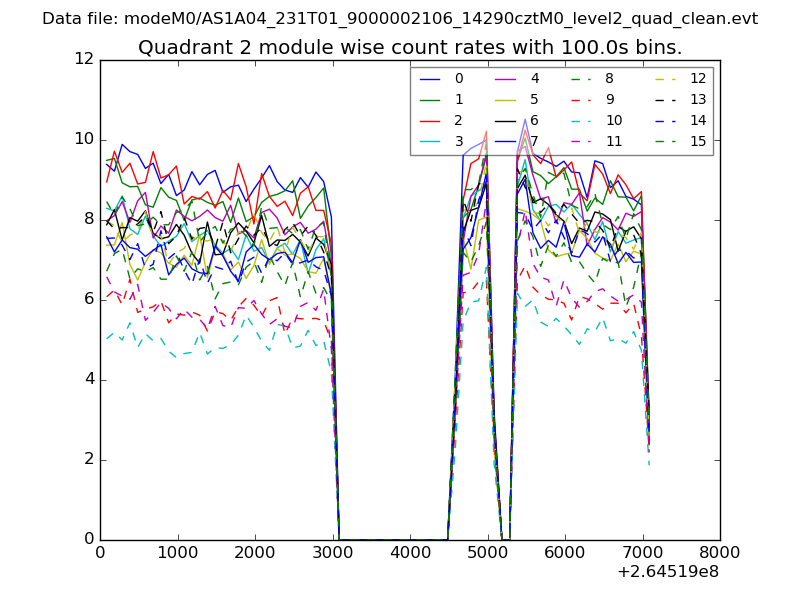
| Module-wise count rates for Quadrant B Data is divided into 100 sec bins |
 |
 |
| Module-wise count rates for Quadrant C Data is divided into 100 sec bins |
 |
 |
| Module-wise count rates for Quadrant D Data is divided into 100 sec bins |
 |
 |
| Parameter | Plot |
|---|---|
| CZT HV Monitor |  |
| D_VDD | 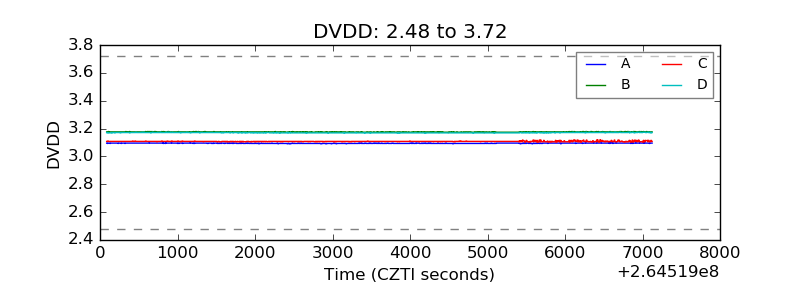 |
| Temperature 1 | 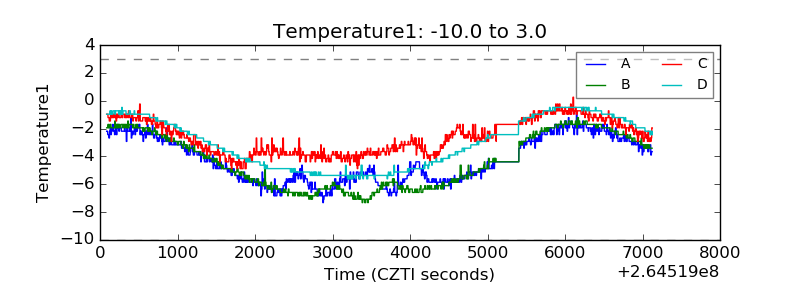 |
| Veto HV Monitor | 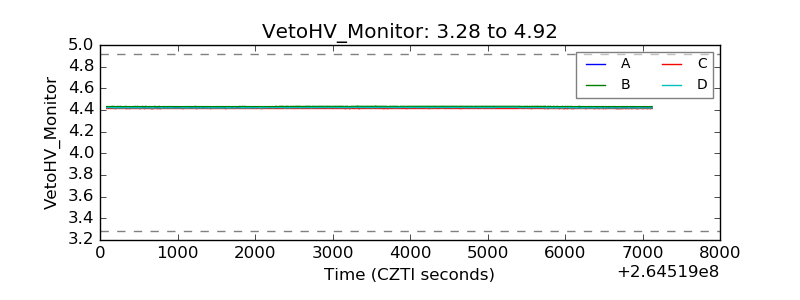 |
| Veto LLD | 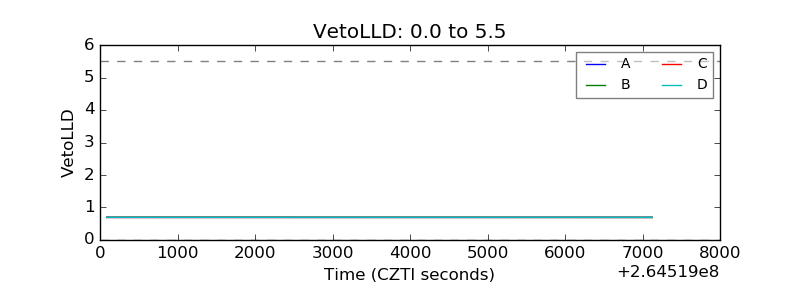 |
| Alpha Counter | 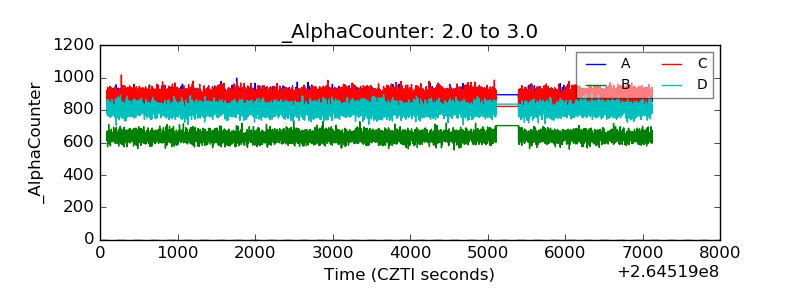 |
| _CPM_Rate | 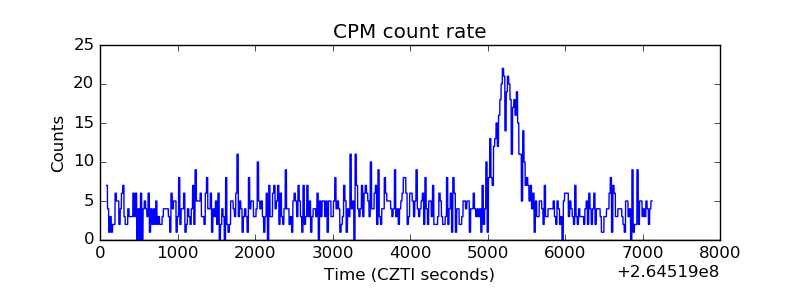 |
| CZT Counter | 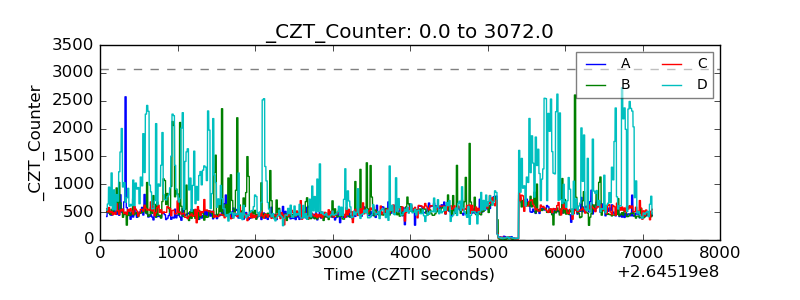 |
| +2.5 Volts monitor |  |
| +5 Volts monitor |  |
| _ROLL_ROT | 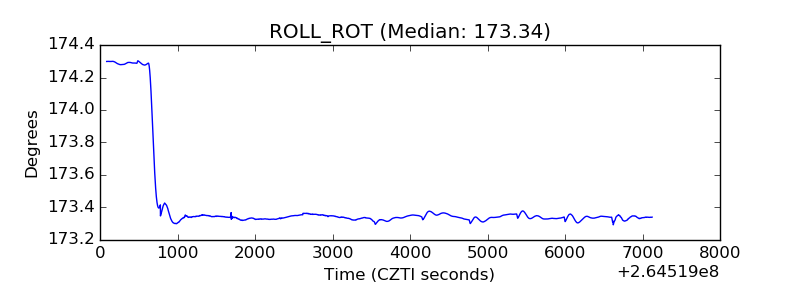 |
| _Roll_DEC | 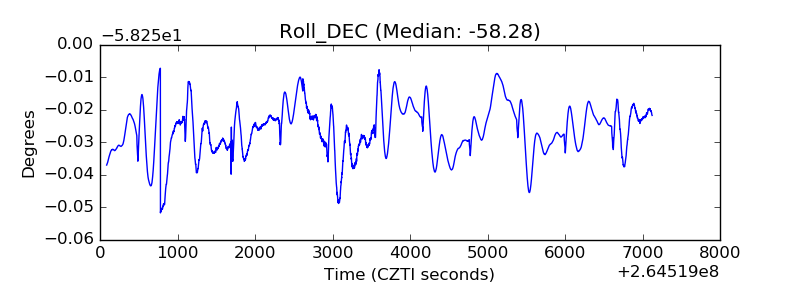 |
| _Roll_RA | 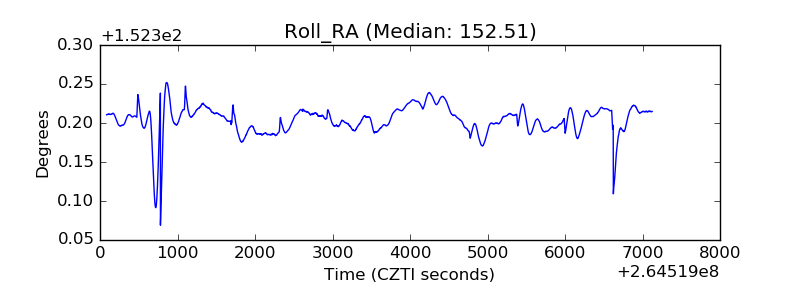 |
| Veto Counter | 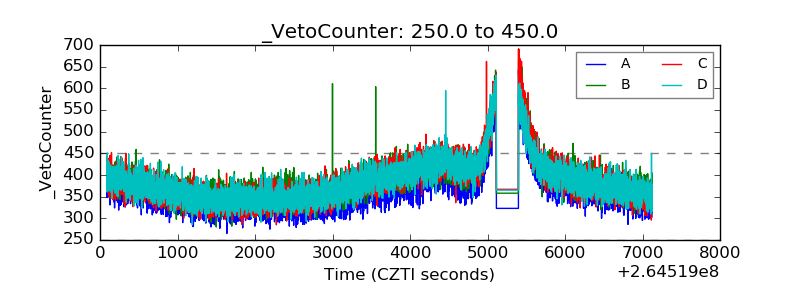 |