| Param | Original file | Final file |
|---|---|---|
| Filename | modeM0/AS1A04_231T01_9000002106_14291cztM0_level2.evt | modeM0/AS1A04_231T01_9000002106_14291cztM0_level2_quad_clean.evt |
| Size (bytes) | 718,076,160 | 103,115,520 |
| Size | 684.8 MB | 98.3 MB |
| Events in quadrant A | 3,658,223 | 691,938 |
| Events in quadrant B | 4,014,252 | 684,872 |
| Events in quadrant C | 3,929,589 | 673,193 |
| Events in quadrant D | 9,659,364 | 571,738 |
| Mode SS | |||
|---|---|---|---|
| Quadrant | BADHDUFLAG | Total packets | Discarded packets |
| A | 0 | 148 | 0 |
| B | 0 | 148 | 0 |
| C | 0 | 148 | 0 |
| D | 0 | 148 | 0 |
| Mode M0 | |||
|---|---|---|---|
| Quadrant | BADHDUFLAG | Total packets | Discarded packets |
| A | 0 | 15508 | 2 |
| B | 0 | 16660 | 1 |
| C | 0 | 16329 | 1 |
| D | 0 | 33665 | 1 |
| Mode M9 | |||
|---|---|---|---|
| Quadrant | BADHDUFLAG | Total packets | Discarded packets |
| A | 0 | 2 | 0 |
| B | 0 | 2 | 0 |
| C | 0 | 2 | 0 |
| D | 0 | 2 | 0 |
| Quadrant | Total seconds | Saturated seconds | Saturation percentage |
|---|---|---|---|
| A | 7175 | 61 | 0.850174% |
| B | 7175 | 203 | 2.829268% |
| C | 7175 | 23 | 0.320557% |
| D | 7175 | 1824 | 25.421603% |
Noise dominated data is calculated using 1-second bins in cleaned event files. If a bin has >2000 counts, and if more than 50% of those come from <1% of pixels, then it is considered to be noise-dominated and hence unusable.
| Quadrant | # 1 sec bins | Bins with >0 counts | Bins with >2000 counts | High rate bins dominated by noise | Noise dominated (total time) | Noise dominated (detector-on time) | Marked lightcurve |
|---|---|---|---|---|---|---|---|
| A | 7426 | 7177 | 0 | 0 | 0.00% | 0.00% | 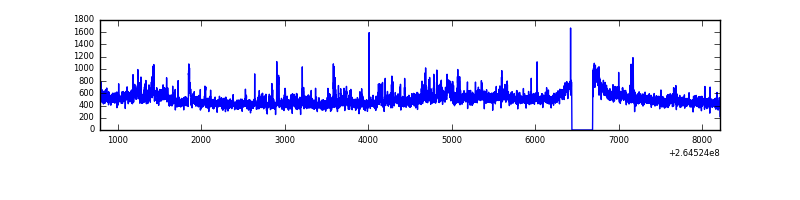 |
| B | 7426 | 7177 | 89 | 89 | 1.20% | 1.24% | 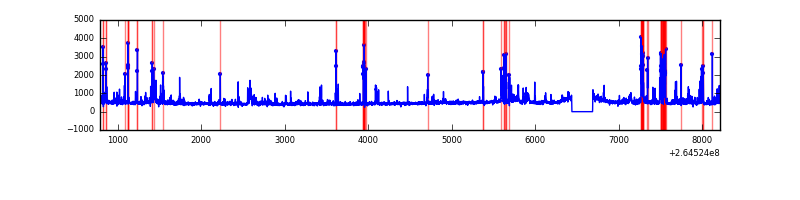 |
| C | 7426 | 7177 | 0 | 0 | 0.00% | 0.00% | 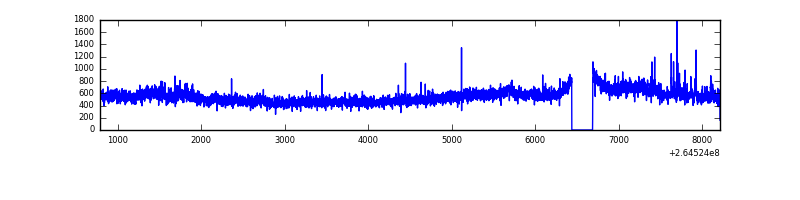 |
| D | 7426 | 7177 | 1545 | 1545 | 20.81% | 21.53% | 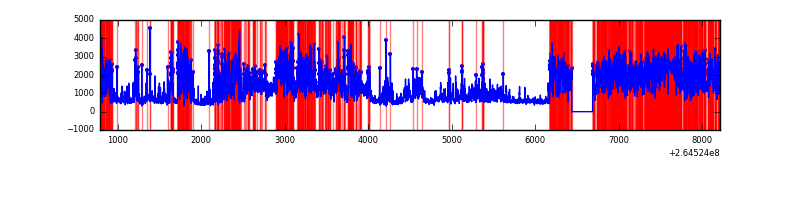 |
Top three noisy pixels from each quadrant. If the there are fewer than three noisy pixels in the level2.evt file, extra rows are filled as -1
| Pixel properties | Quadrant properties | ||||||
|---|---|---|---|---|---|---|---|
| Quadrant | DetID | PixID | Counts | Sigma | Mean | Median | Sigma |
| A | 12 | 189 | 218279 | 1259.77 | 845 | 829 | 172.6 |
| A | 8 | 15 | 170036 | 980.28 | 845 | 829 | 172.6 |
| A | 15 | 69 | 9212 | 48.57 | 845 | 829 | 172.6 |
| B | 0 | 229 | 362489 | 2257.49 | 833 | 811 | 160.2 |
| B | 0 | 182 | 234747 | 1460.16 | 833 | 811 | 160.2 |
| B | 10 | 245 | 39291 | 240.18 | 833 | 811 | 160.2 |
| C | 3 | 233 | 760559 | 4059.45 | 808 | 811 | 187.2 |
| C | 8 | 128 | 6808 | 32.04 | 808 | 811 | 187.2 |
| C | 13 | 61 | 5968 | 27.55 | 808 | 811 | 187.2 |
| D | 13 | 122 | 5127471 | 28851.97 | 741 | 720 | 177.7 |
| D | 5 | 222 | 1133912 | 6377.3 | 741 | 720 | 177.7 |
| D | 2 | 136 | 271391 | 1523.26 | 741 | 720 | 177.7 |
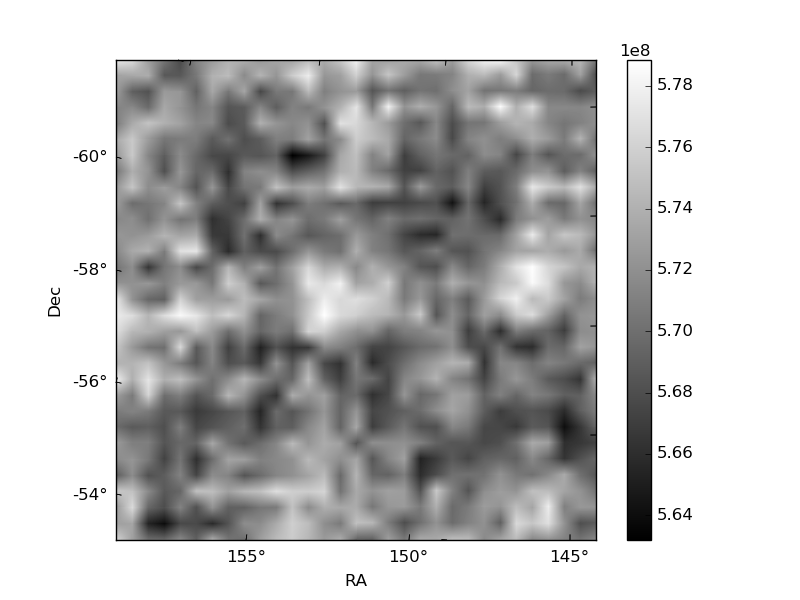
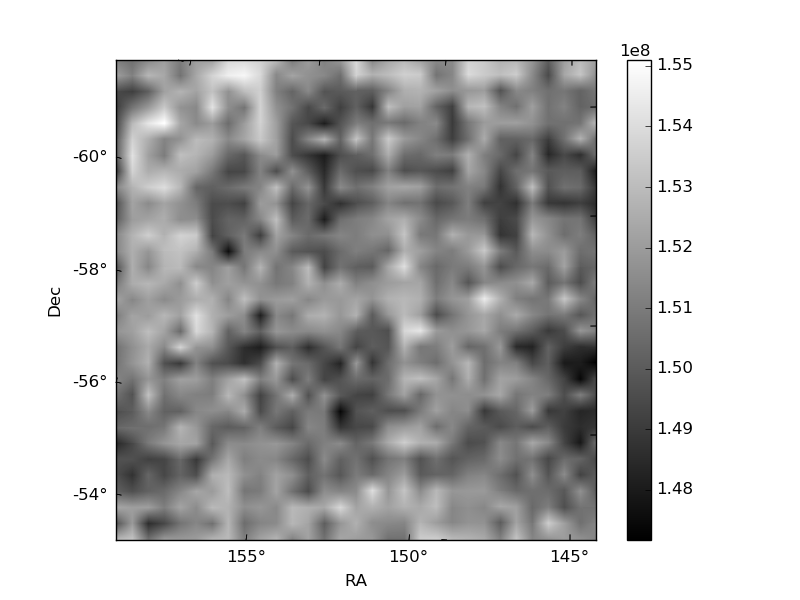
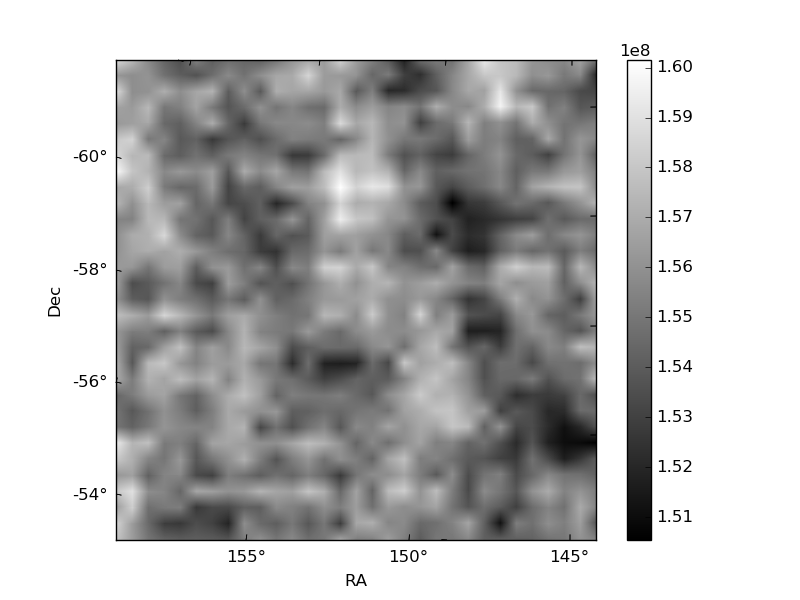
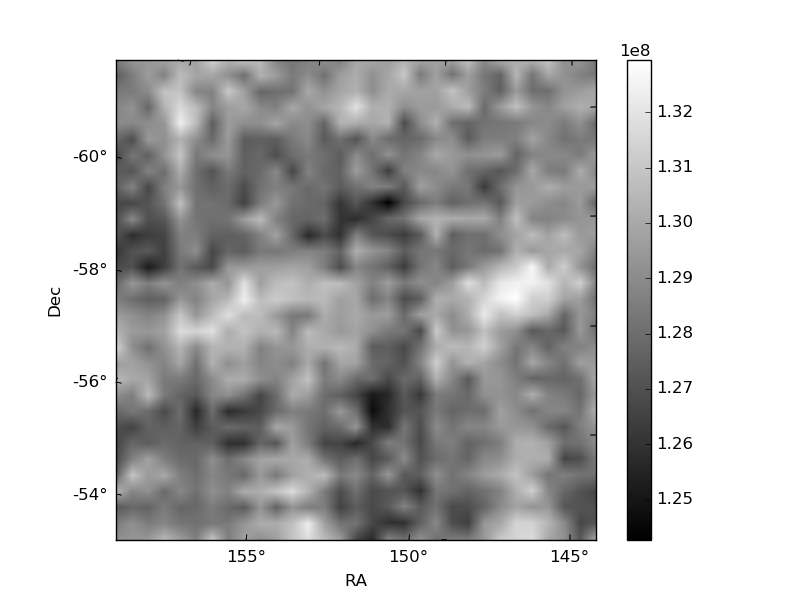
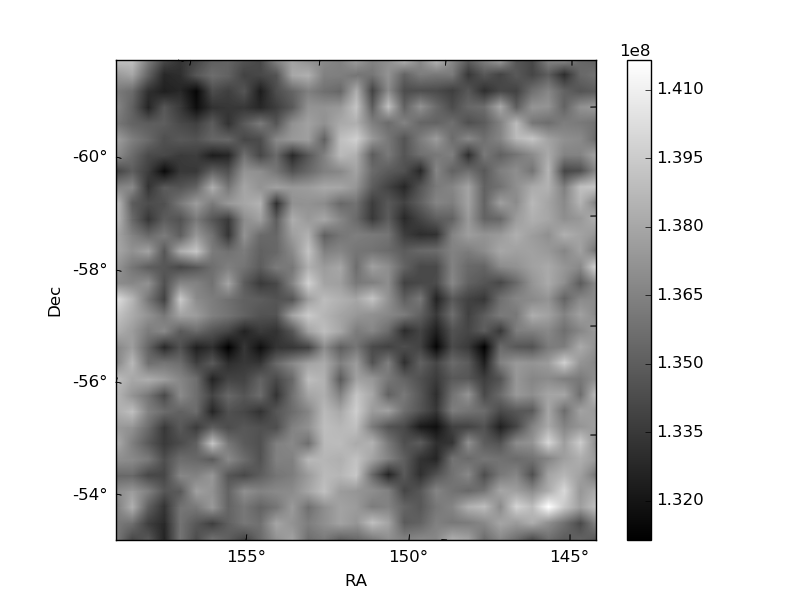
Histogram calculated using DETX and DETY for each event in the final _common_clean file
| Quadrant A | 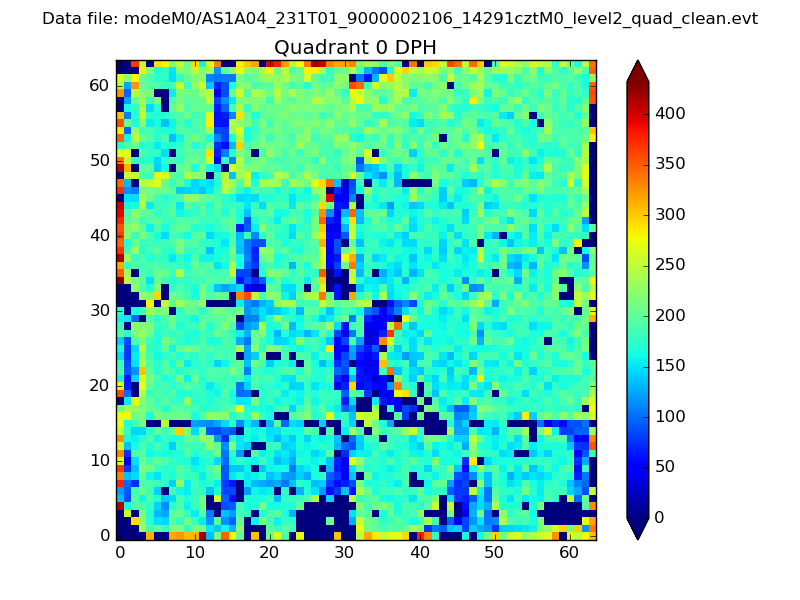 |
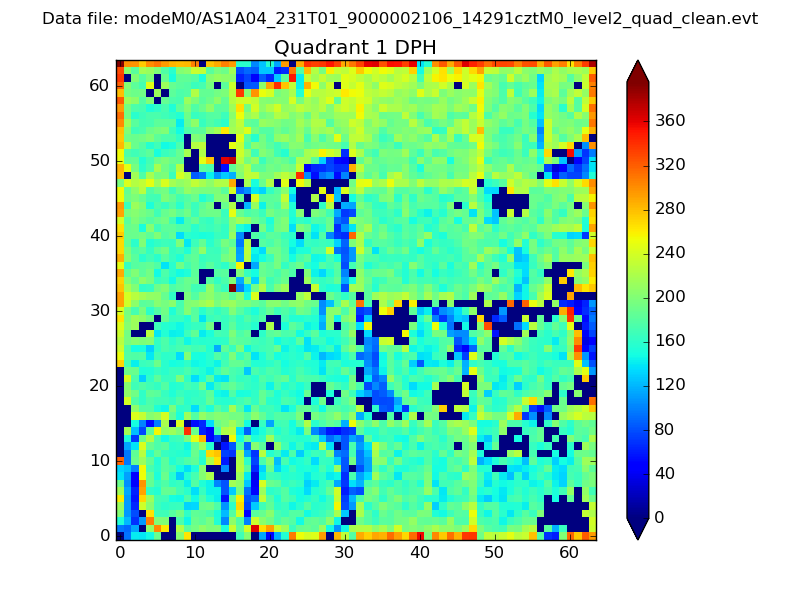 |
Quadrant B |
|---|---|---|---|
| Quadrant D | 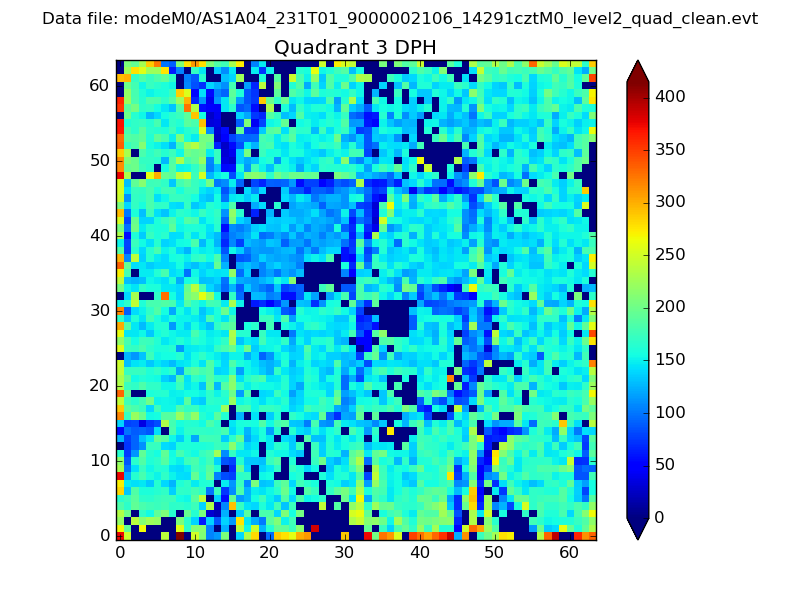 |
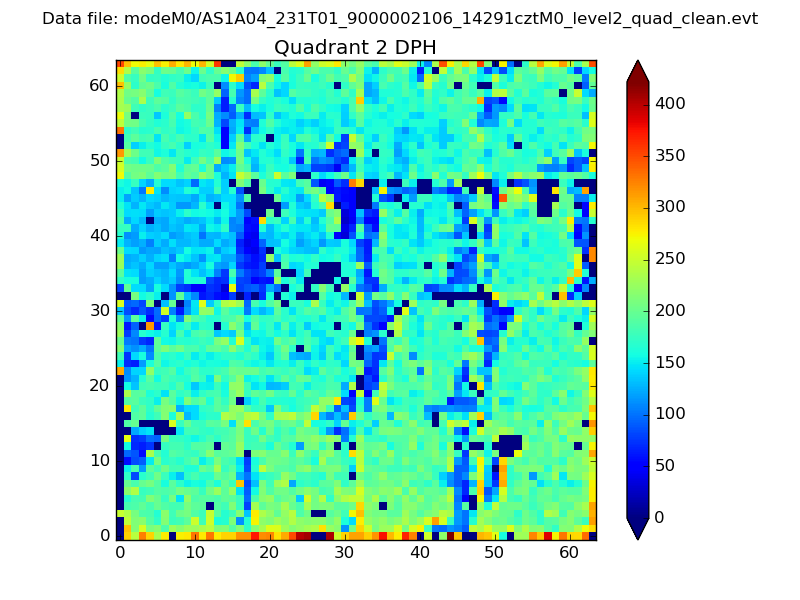 |
Quadrant C |
| Plot type | Count rate plots | Images |
|---|---|---|
| Comparison with Poisson distribution Blue bars denote a histogram of data divided into 1 sec bins. Red curve is a Poisson curve with rate = median count rate of data. |
 |
 |
| Quadrant-wise count rates Data is divided into 100 sec bins |
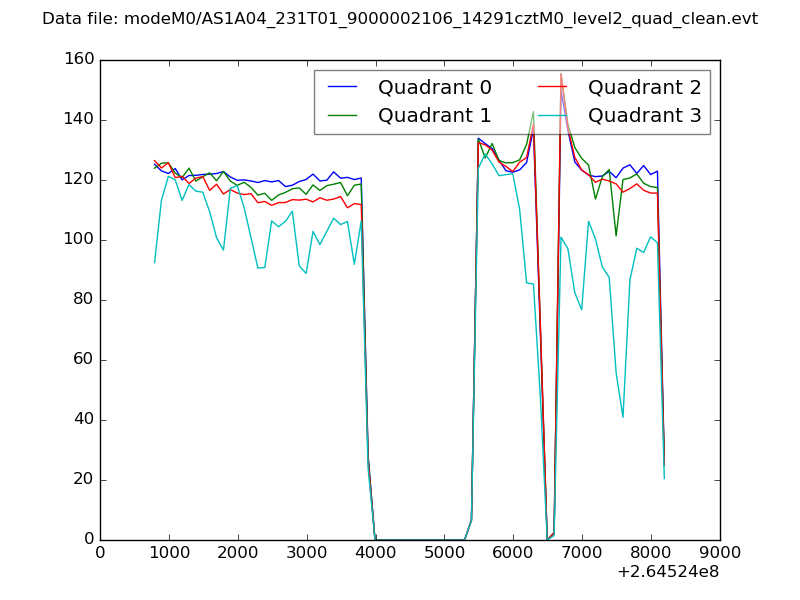 |
|
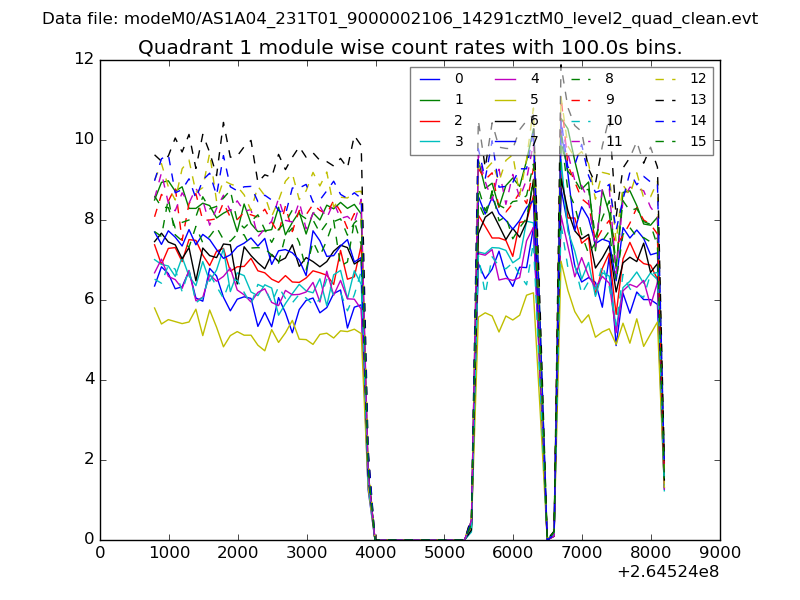
| Module-wise count rates for Quadrant A Data is divided into 100 sec bins |
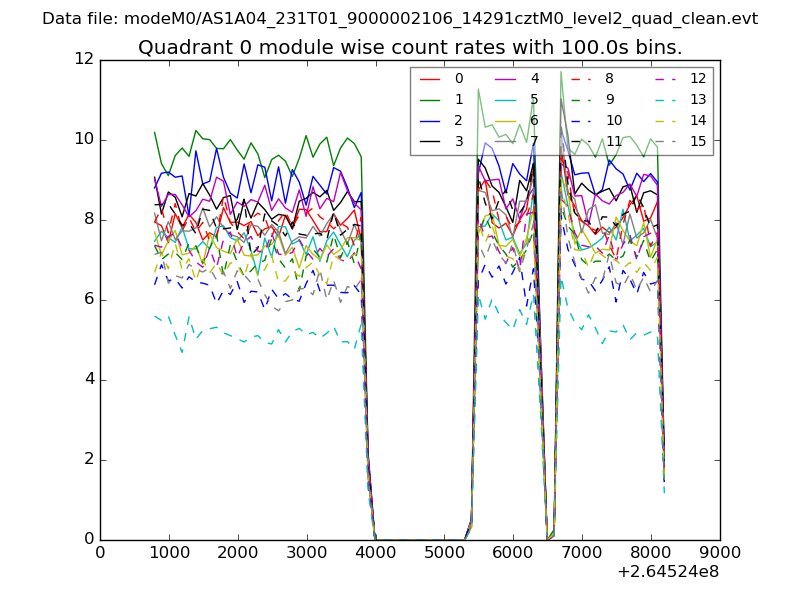 |
 |
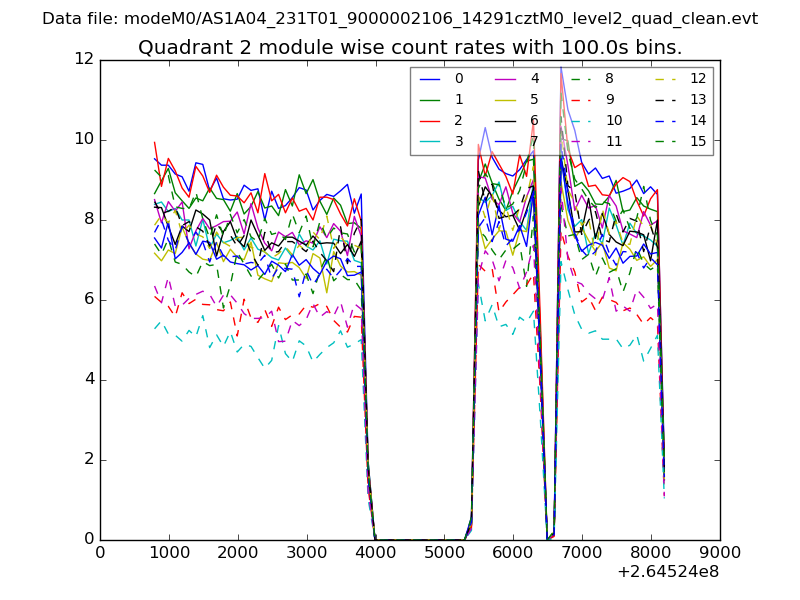
| Module-wise count rates for Quadrant B Data is divided into 100 sec bins |
 |
 |
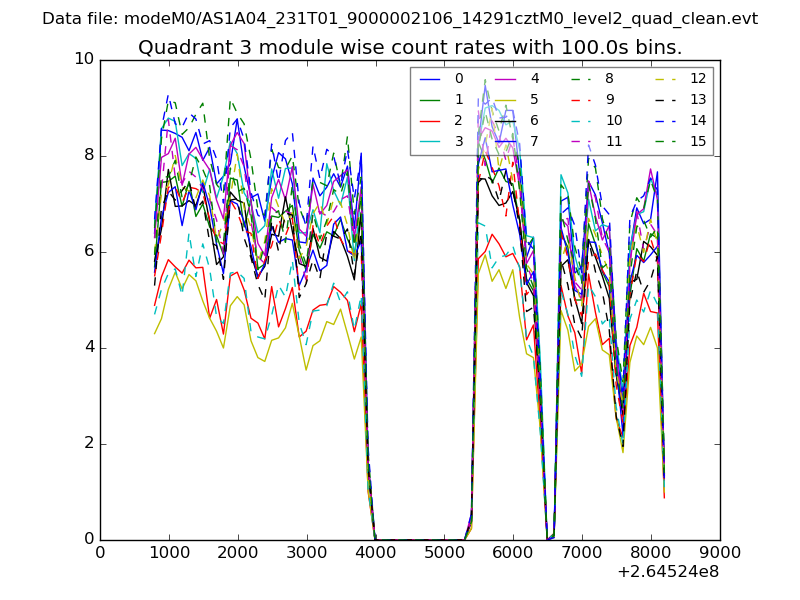
| Module-wise count rates for Quadrant C Data is divided into 100 sec bins |
 |
 |
| Module-wise count rates for Quadrant D Data is divided into 100 sec bins |
 |
 |
| Parameter | Plot |
|---|---|
| CZT HV Monitor | 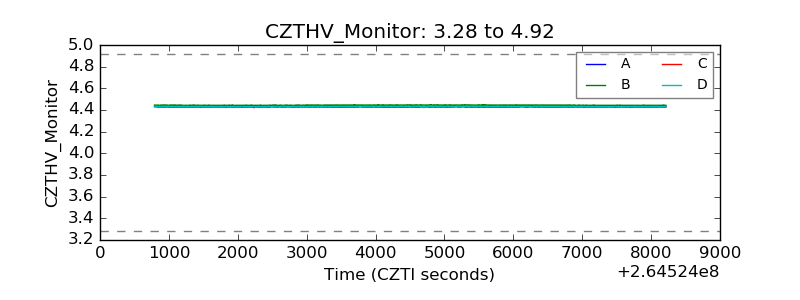 |
| D_VDD | 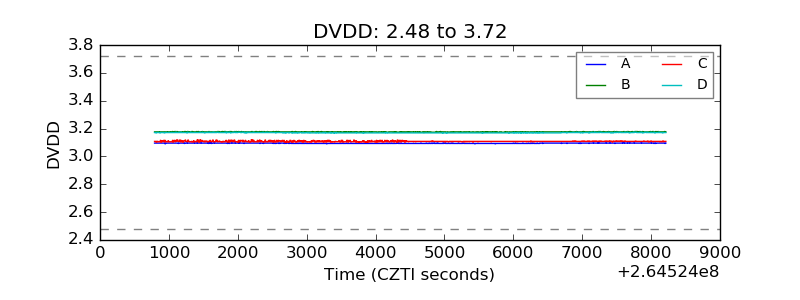 |
| Temperature 1 | 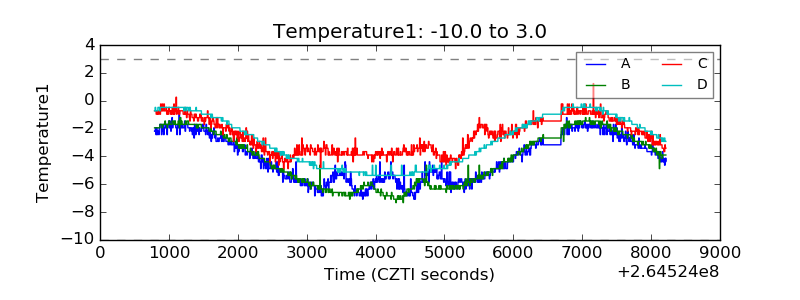 |
| Veto HV Monitor | 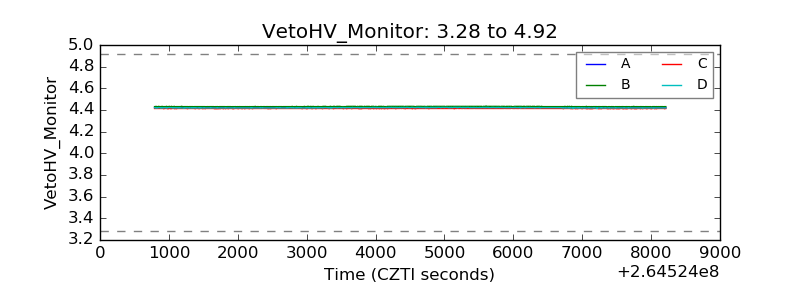 |
| Veto LLD | 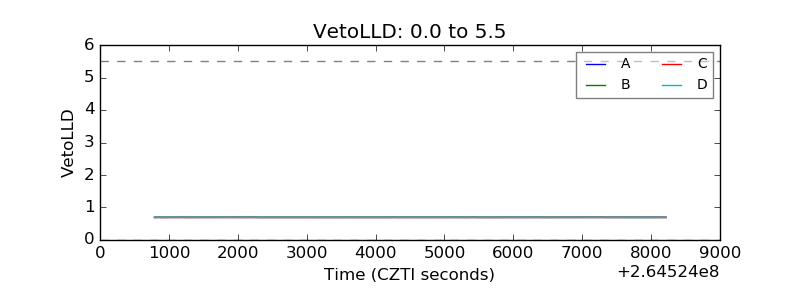 |
| Alpha Counter | 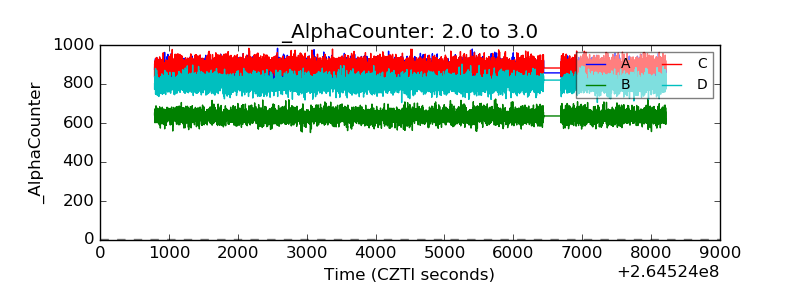 |
| _CPM_Rate |  |
| CZT Counter | 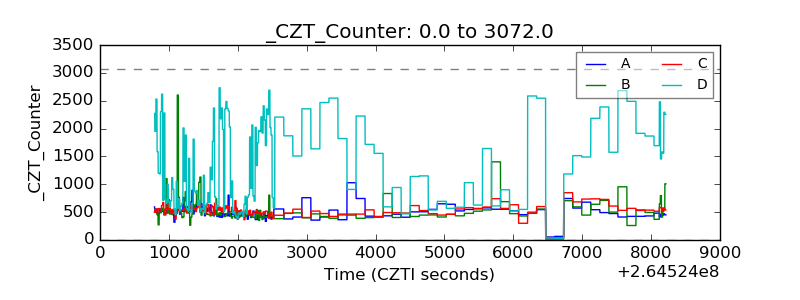 |
| +2.5 Volts monitor |  |
| +5 Volts monitor |  |
| _ROLL_ROT | 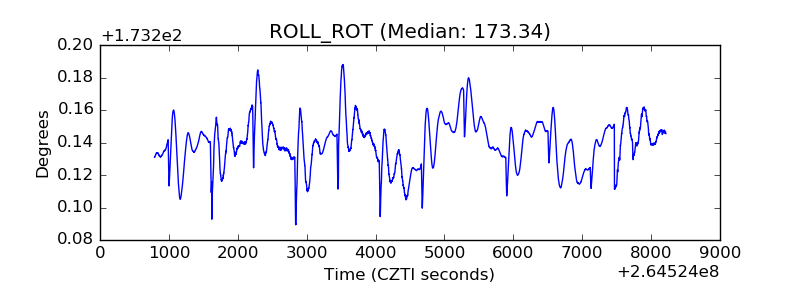 |
| _Roll_DEC | 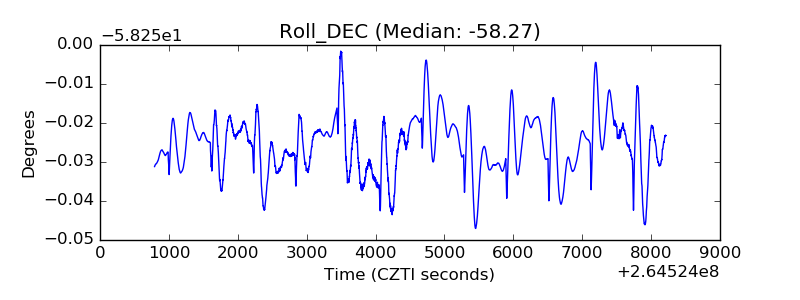 |
| _Roll_RA | 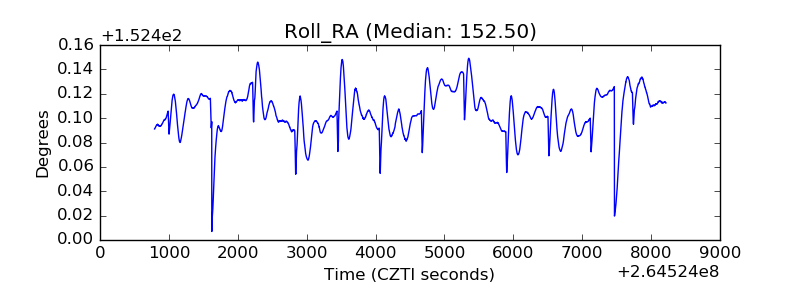 |
| Veto Counter | 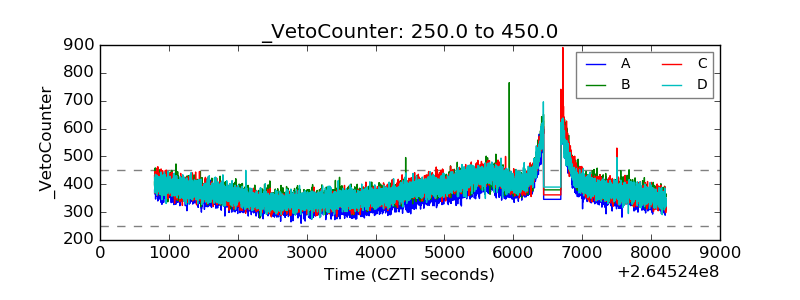 |