| Param | Original file | Final file |
|---|---|---|
| Filename | modeM0/AS1A04_231T01_9000002106_14299cztM0_level2.evt | modeM0/AS1A04_231T01_9000002106_14299cztM0_level2_quad_clean.evt |
| Size (bytes) | 522,083,520 | 76,017,600 |
| Size | 497.9 MB | 72.5 MB |
| Events in quadrant A | 3,316,663 | 469,468 |
| Events in quadrant B | 3,803,078 | 470,288 |
| Events in quadrant C | 3,794,105 | 471,155 |
| Events in quadrant D | 4,461,704 | 442,462 |
| Mode SS | |||
|---|---|---|---|
| Quadrant | BADHDUFLAG | Total packets | Discarded packets |
| A | 0 | 130 | 0 |
| B | 0 | 130 | 0 |
| C | 0 | 130 | 0 |
| D | 0 | 130 | 0 |
| Mode M0 | |||
|---|---|---|---|
| Quadrant | BADHDUFLAG | Total packets | Discarded packets |
| A | 0 | 13648 | 3 |
| B | 0 | 15313 | 2 |
| C | 0 | 15556 | 2 |
| D | 0 | 17335 | 2 |
| Mode M9 | |||
|---|---|---|---|
| Quadrant | BADHDUFLAG | Total packets | Discarded packets |
| A | 0 | 15 | 0 |
| B | 0 | 15 | 0 |
| C | 0 | 15 | 0 |
| D | 0 | 16 | 0 |
| Quadrant | Total seconds | Saturated seconds | Saturation percentage |
|---|---|---|---|
| A | 6429 | 41 | 0.637735% |
| B | 6429 | 130 | 2.022087% |
| C | 6429 | 53 | 0.824389% |
| D | 6429 | 348 | 5.412972% |
Noise dominated data is calculated using 1-second bins in cleaned event files. If a bin has >2000 counts, and if more than 50% of those come from <1% of pixels, then it is considered to be noise-dominated and hence unusable.
| Quadrant | # 1 sec bins | Bins with >0 counts | Bins with >2000 counts | High rate bins dominated by noise | Noise dominated (total time) | Noise dominated (detector-on time) | Marked lightcurve |
|---|---|---|---|---|---|---|---|
| A | 7700 | 6431 | 0 | 0 | 0.00% | 0.00% | 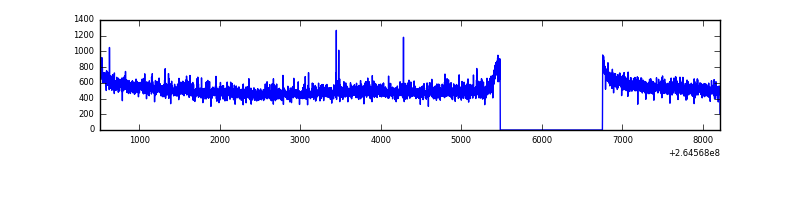 |
| B | 7700 | 6431 | 41 | 41 | 0.53% | 0.64% | 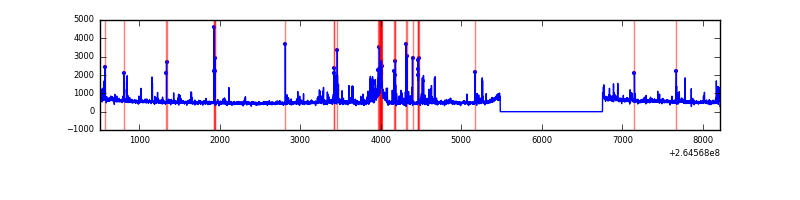 |
| C | 7700 | 6431 | 0 | 0 | 0.00% | 0.00% | 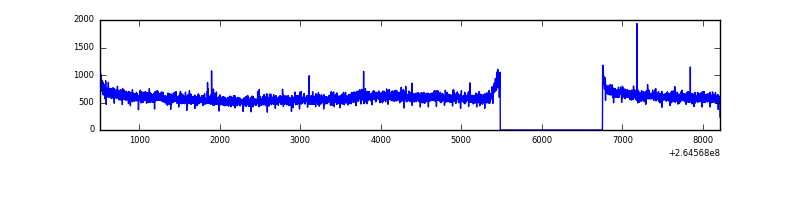 |
| D | 7700 | 6430 | 291 | 291 | 3.78% | 4.53% | 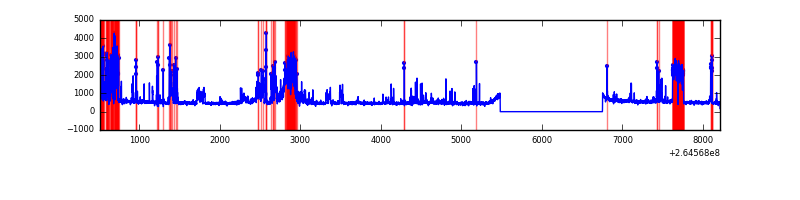 |
Top three noisy pixels from each quadrant. If the there are fewer than three noisy pixels in the level2.evt file, extra rows are filled as -1
| Pixel properties | Quadrant properties | ||||||
|---|---|---|---|---|---|---|---|
| Quadrant | DetID | PixID | Counts | Sigma | Mean | Median | Sigma |
| A | 12 | 189 | 59200 | 349.44 | 840 | 826 | 167.0 |
| A | 8 | 15 | 15860 | 90.0 | 840 | 826 | 167.0 |
| A | 0 | 226 | 7573 | 40.39 | 840 | 826 | 167.0 |
| B | 0 | 229 | 329151 | 2137.44 | 835 | 816 | 153.6 |
| B | 10 | 245 | 81407 | 524.64 | 835 | 816 | 153.6 |
| B | 10 | 244 | 48574 | 310.9 | 835 | 816 | 153.6 |
| C | 3 | 233 | 563396 | 3039.45 | 826 | 831 | 185.1 |
| C | 13 | 61 | 6022 | 28.05 | 826 | 831 | 185.1 |
| C | 14 | 234 | 5455 | 24.98 | 826 | 831 | 185.1 |
| D | 5 | 222 | 425006 | 2238.04 | 807 | 789 | 189.5 |
| D | 12 | 110 | 417255 | 2197.15 | 807 | 789 | 189.5 |
| D | 2 | 14 | 402597 | 2119.82 | 807 | 789 | 189.5 |
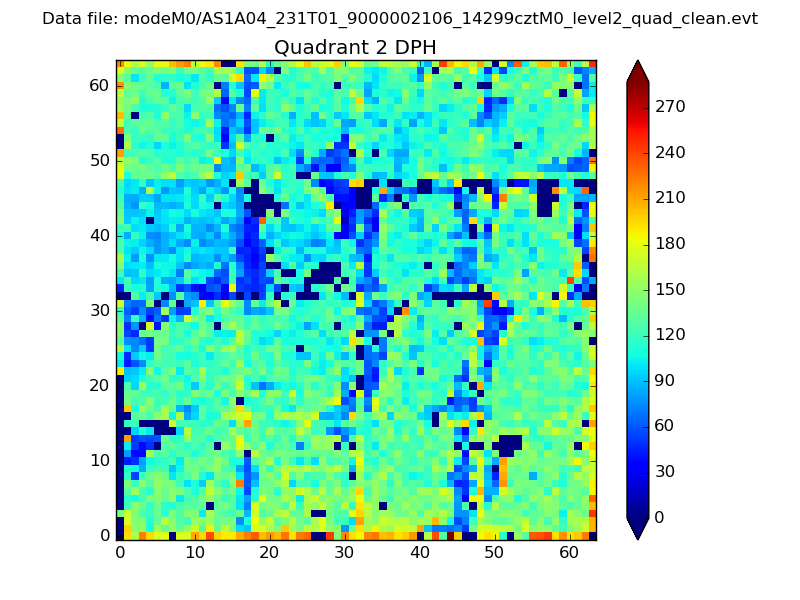
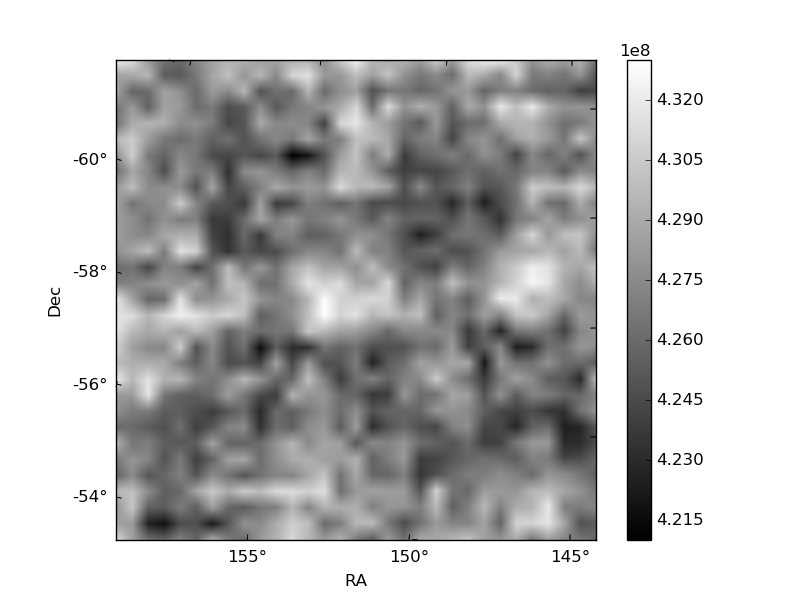
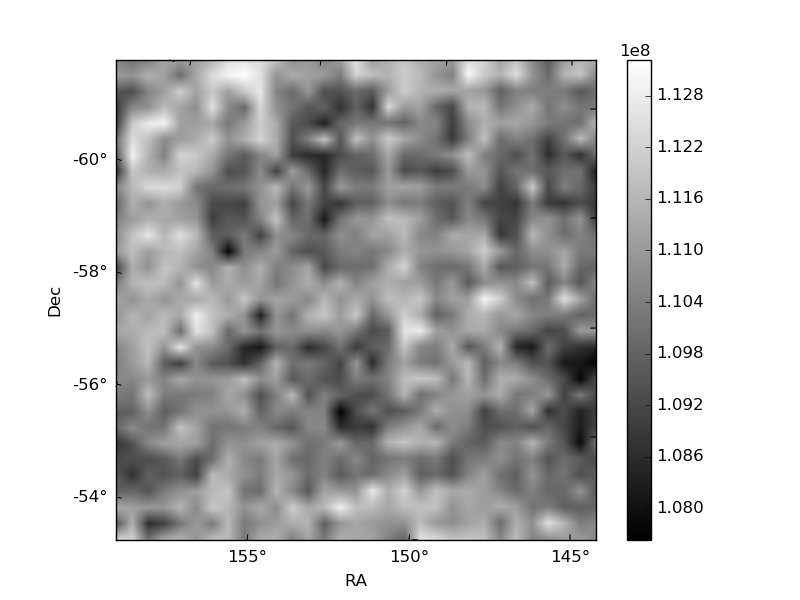
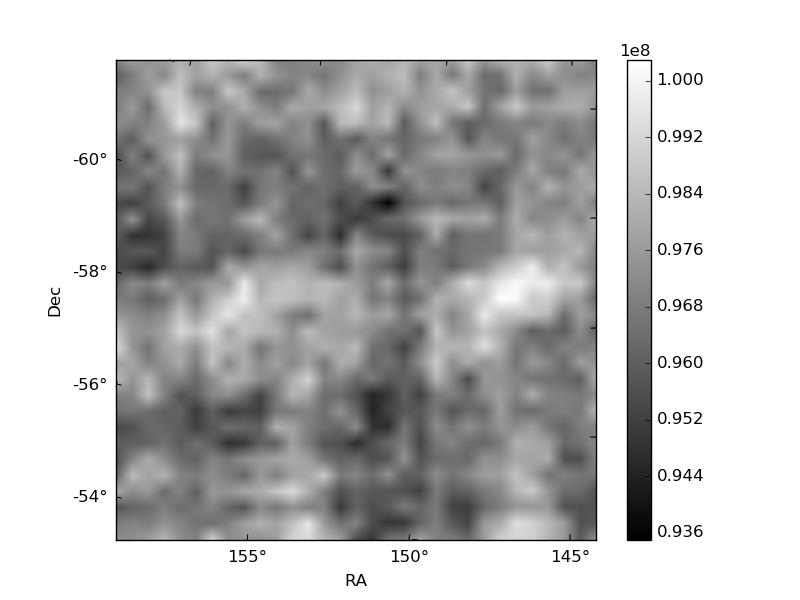
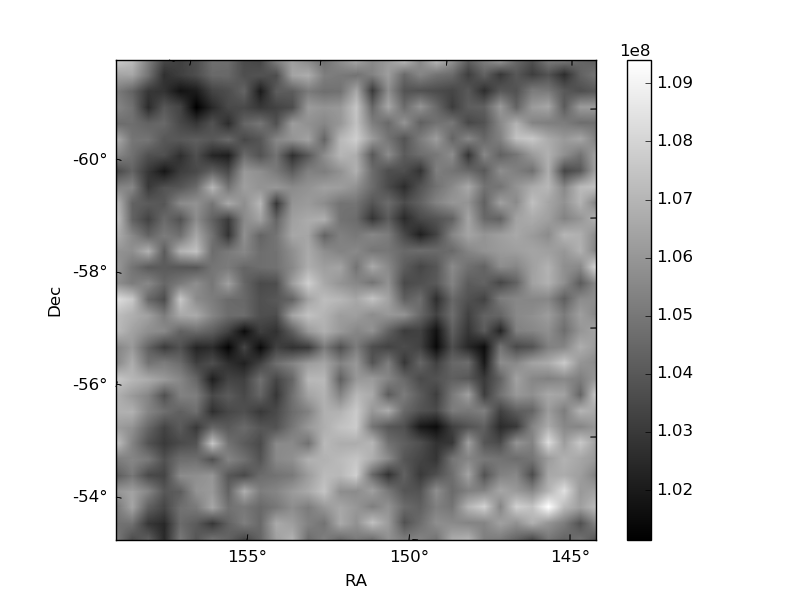
Histogram calculated using DETX and DETY for each event in the final _common_clean file
| Quadrant A | 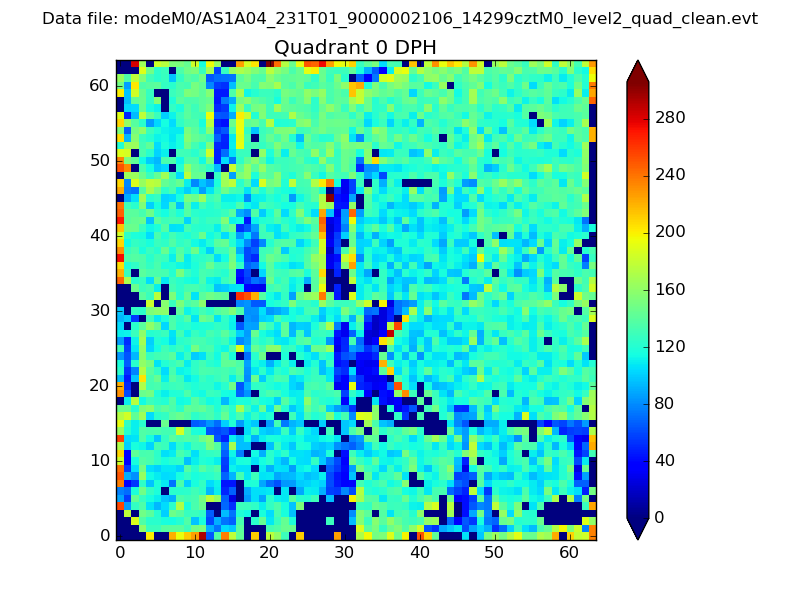 |
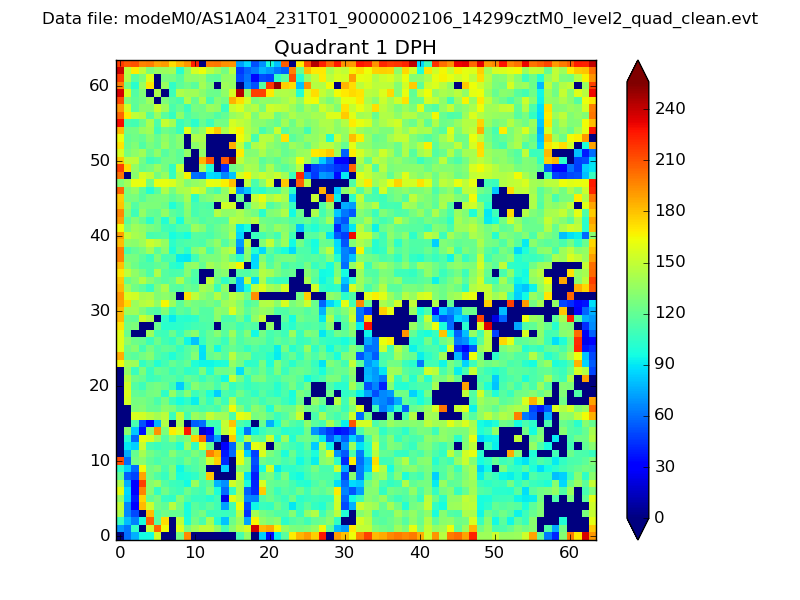 |
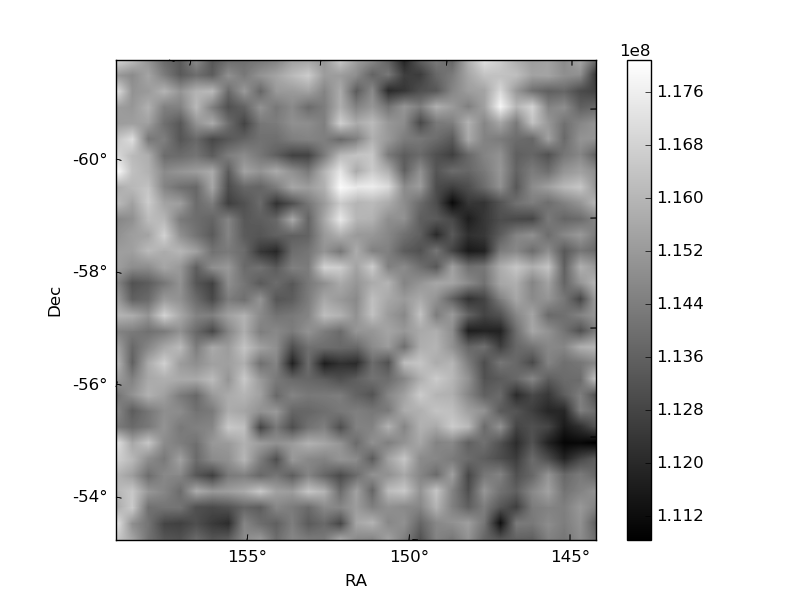
Quadrant B |
|---|---|---|---|
| Quadrant D | 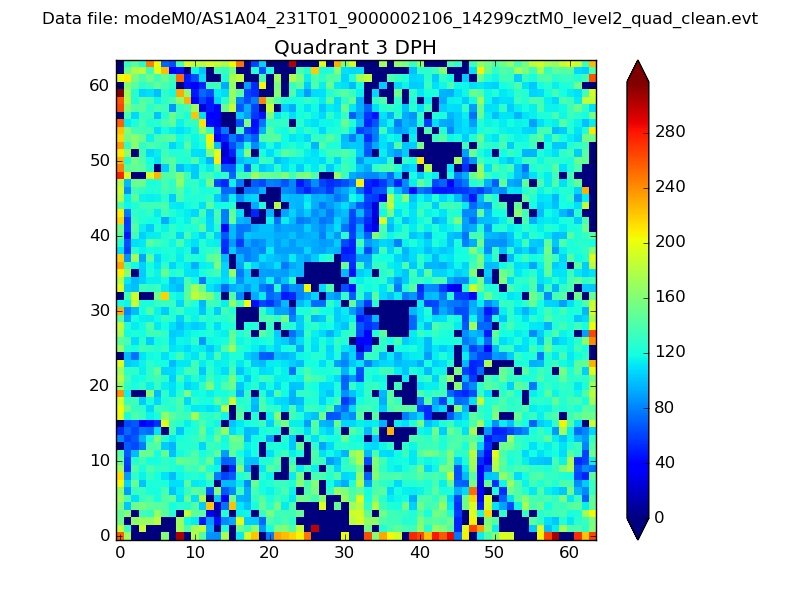 |
 |
Quadrant C |
| Plot type | Count rate plots | Images |
|---|---|---|
| Comparison with Poisson distribution Blue bars denote a histogram of data divided into 1 sec bins. Red curve is a Poisson curve with rate = median count rate of data. |
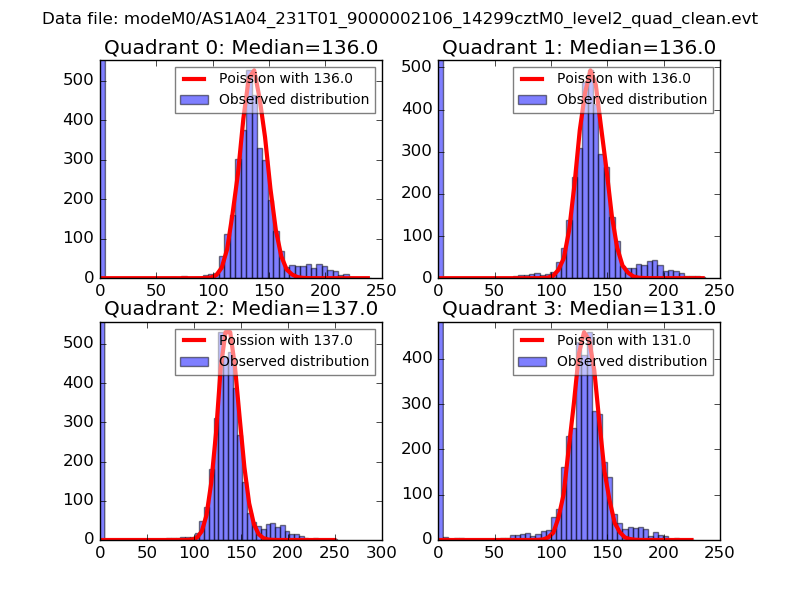 |
 |
| Quadrant-wise count rates Data is divided into 100 sec bins |
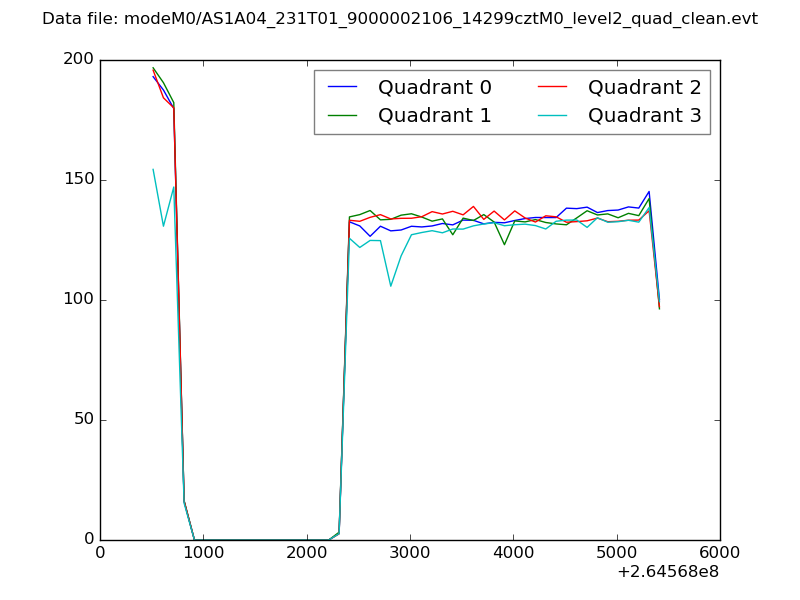 |
|
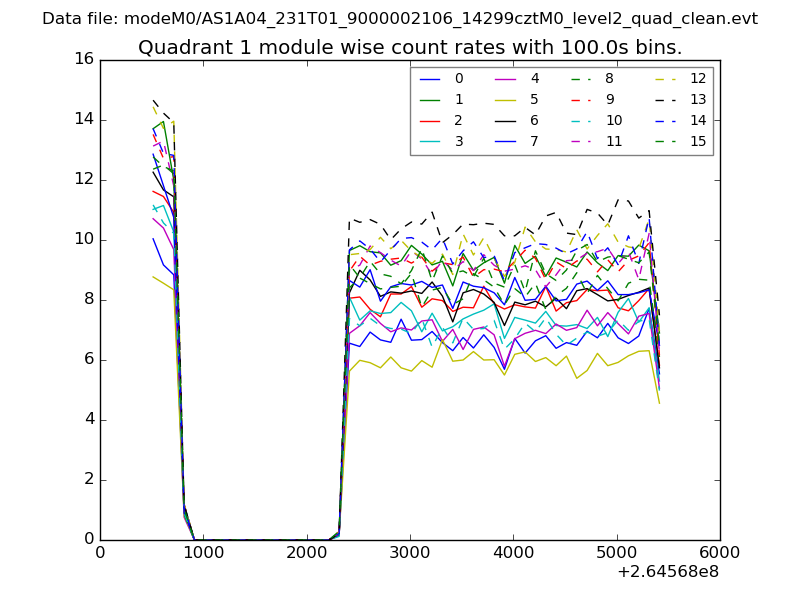
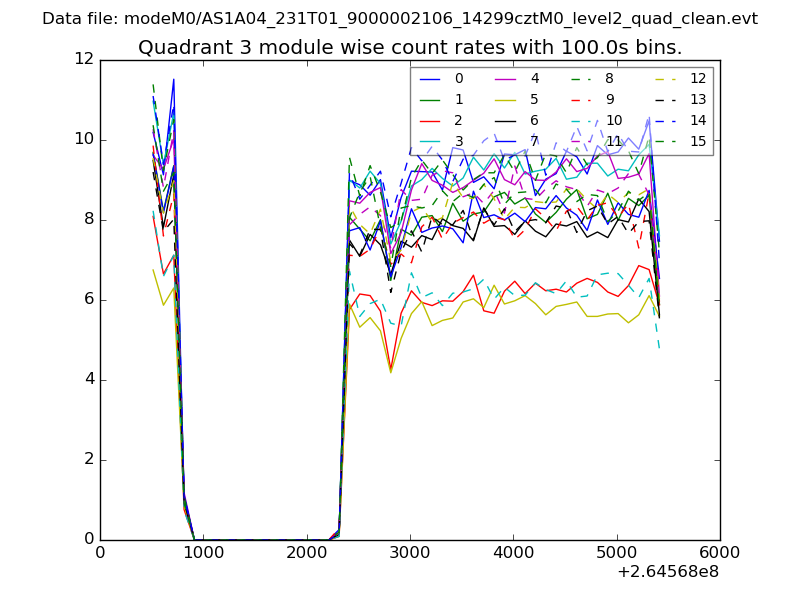
| Module-wise count rates for Quadrant A Data is divided into 100 sec bins |
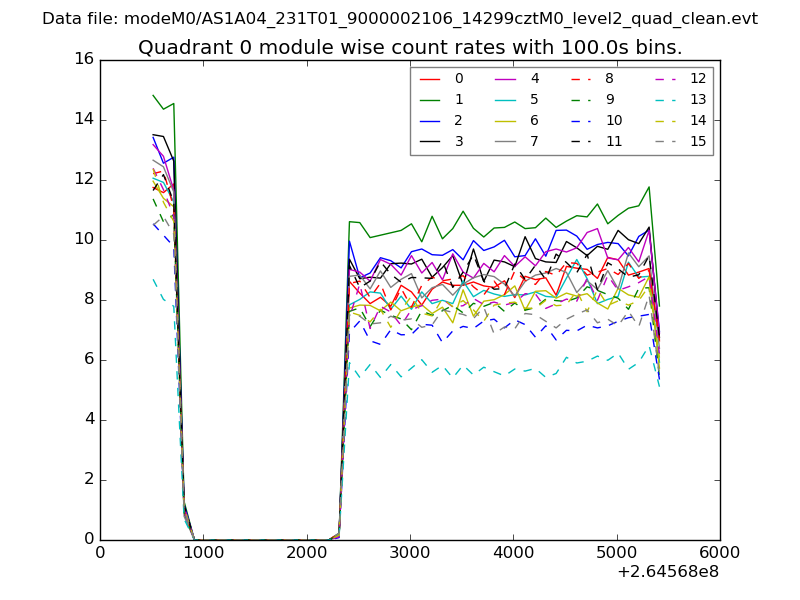 |
 |
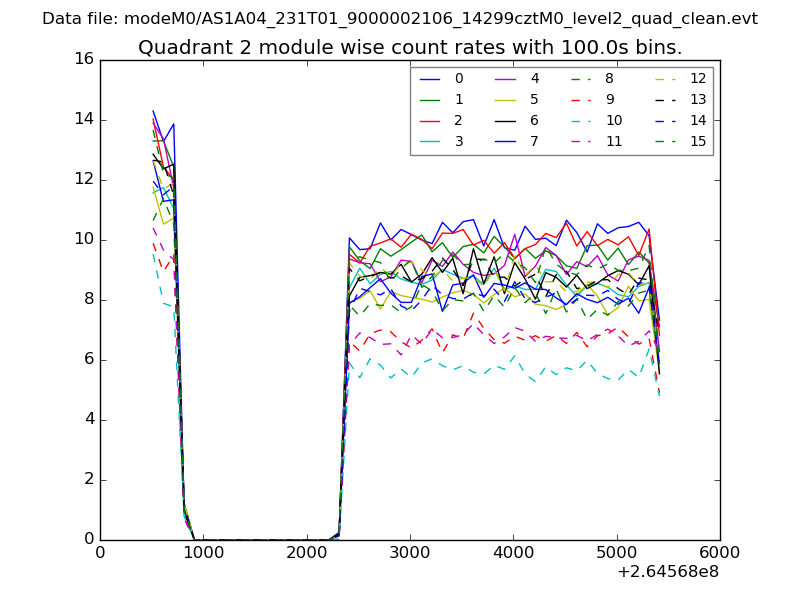
| Module-wise count rates for Quadrant B Data is divided into 100 sec bins |
 |
 |
| Module-wise count rates for Quadrant C Data is divided into 100 sec bins |
 |
 |
| Module-wise count rates for Quadrant D Data is divided into 100 sec bins |
 |
 |
| Parameter | Plot |
|---|---|
| CZT HV Monitor | 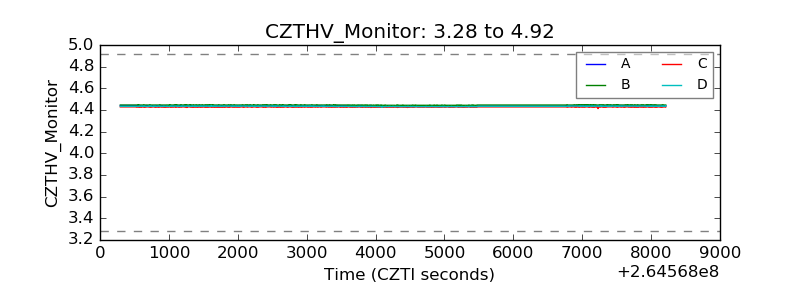 |
| D_VDD | 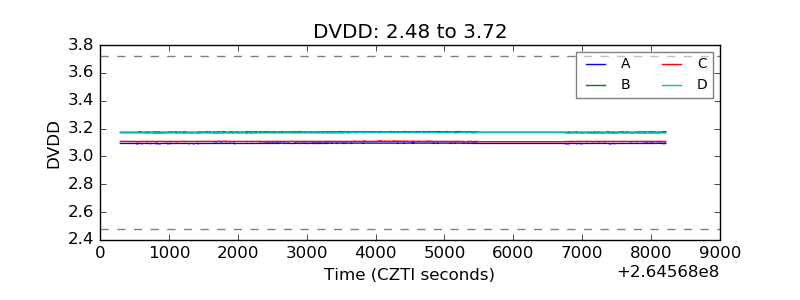 |
| Temperature 1 | 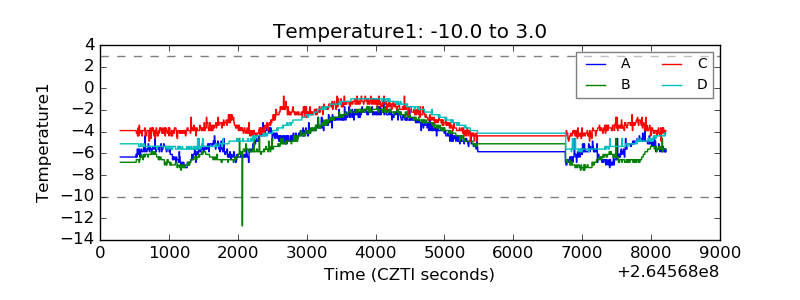 |
| Veto HV Monitor | 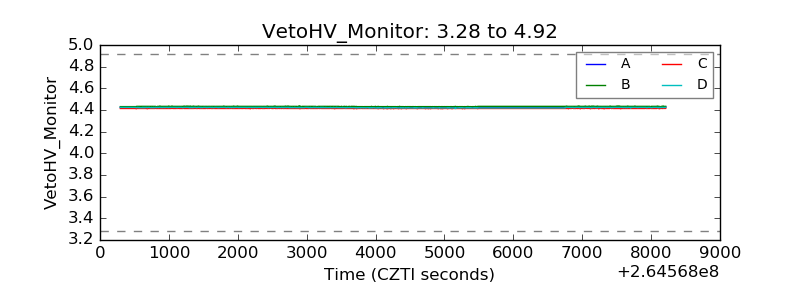 |
| Veto LLD | 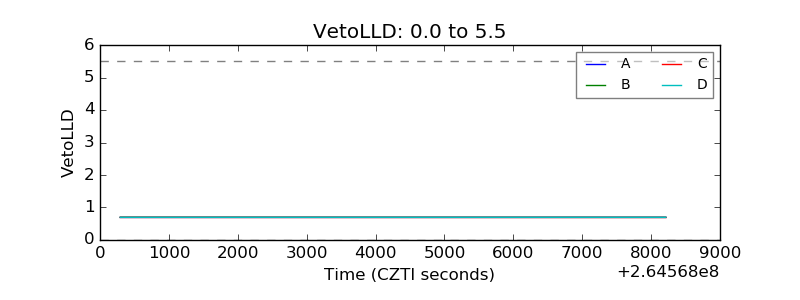 |
| Alpha Counter | 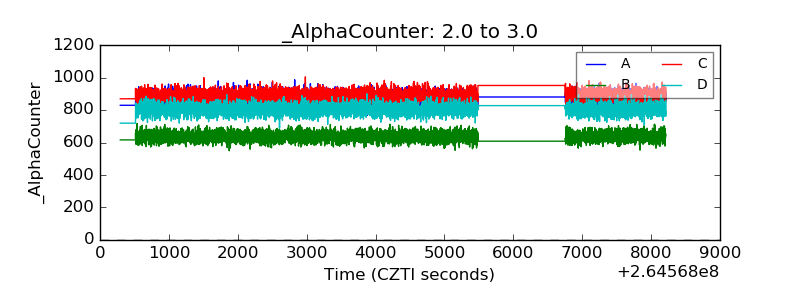 |
| _CPM_Rate | 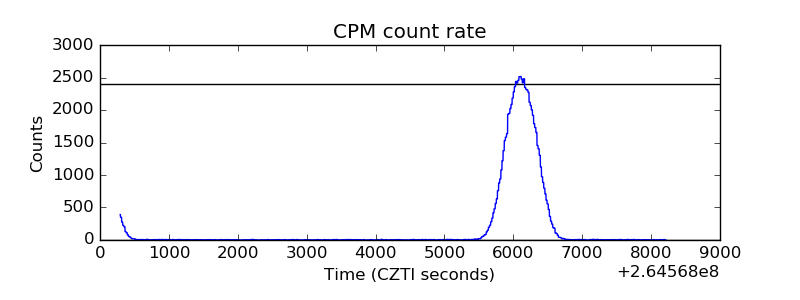 |
| CZT Counter | 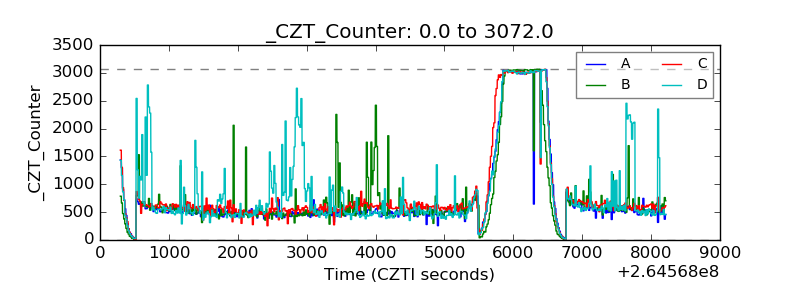 |
| +2.5 Volts monitor |  |
| +5 Volts monitor | 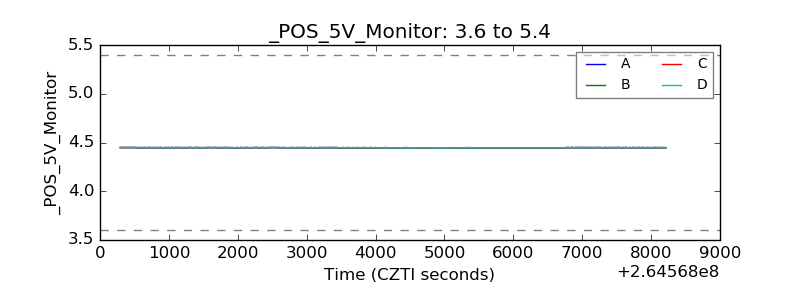 |
| _ROLL_ROT | 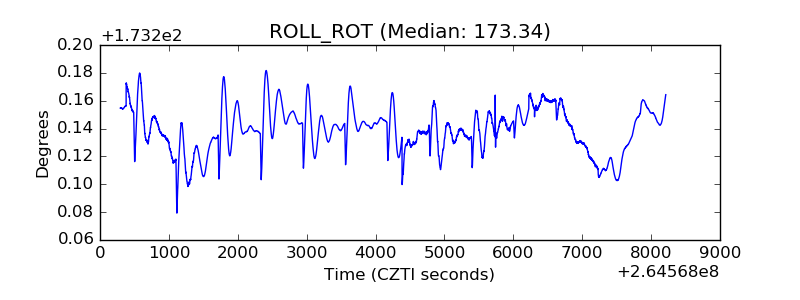 |
| _Roll_DEC | 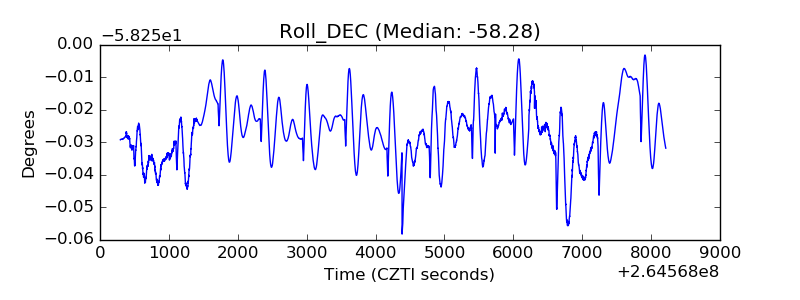 |
| _Roll_RA | 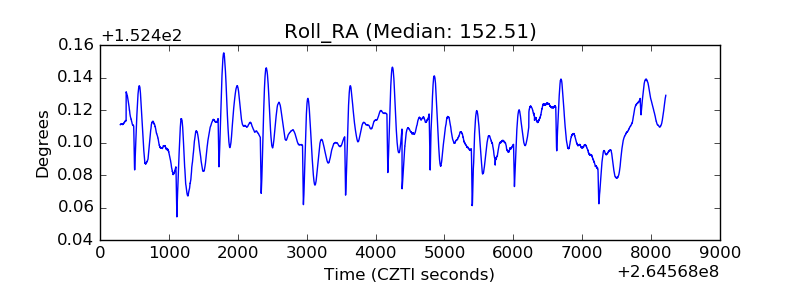 |
| Veto Counter | 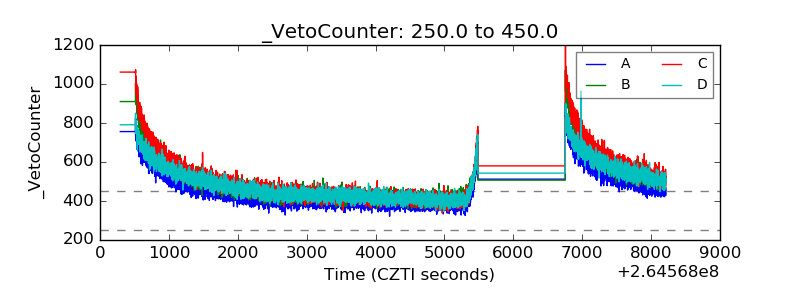 |