| Param | Original file | Final file |
|---|---|---|
| Filename | modeM0/AS1A04_231T01_9000002106_14301cztM0_level2.evt | modeM0/AS1A04_231T01_9000002106_14301cztM0_level2_quad_clean.evt |
| Size (bytes) | 200,208,960 | 34,557,120 |
| Size | 190.9 MB | 33.0 MB |
| Events in quadrant A | 1,391,795 | 211,659 |
| Events in quadrant B | 1,510,675 | 218,222 |
| Events in quadrant C | 1,557,240 | 218,180 |
| Events in quadrant D | 1,422,808 | 209,288 |
| Mode SS | |||
|---|---|---|---|
| Quadrant | BADHDUFLAG | Total packets | Discarded packets |
| A | 0 | 54 | 0 |
| B | 0 | 54 | 0 |
| C | 0 | 54 | 0 |
| D | 0 | 54 | 0 |
| Mode M0 | |||
|---|---|---|---|
| Quadrant | BADHDUFLAG | Total packets | Discarded packets |
| A | 0 | 5662 | 1 |
| B | 0 | 6096 | 1 |
| C | 0 | 6356 | 1 |
| D | 0 | 5784 | 1 |
| Mode M9 | |||
|---|---|---|---|
| Quadrant | BADHDUFLAG | Total packets | Discarded packets |
| A | 0 | 5 | 0 |
| B | 0 | 5 | 0 |
| C | 0 | 5 | 0 |
| D | 0 | 6 | 0 |
| Quadrant | Total seconds | Saturated seconds | Saturation percentage |
|---|---|---|---|
| A | 2626 | 10 | 0.380807% |
| B | 2626 | 27 | 1.028180% |
| C | 2626 | 13 | 0.495050% |
| D | 2626 | 7 | 0.266565% |
Noise dominated data is calculated using 1-second bins in cleaned event files. If a bin has >2000 counts, and if more than 50% of those come from <1% of pixels, then it is considered to be noise-dominated and hence unusable.
| Quadrant | # 1 sec bins | Bins with >0 counts | Bins with >2000 counts | High rate bins dominated by noise | Noise dominated (total time) | Noise dominated (detector-on time) | Marked lightcurve |
|---|---|---|---|---|---|---|---|
| A | 2627 | 2627 | 0 | 0 | 0.00% | 0.00% | 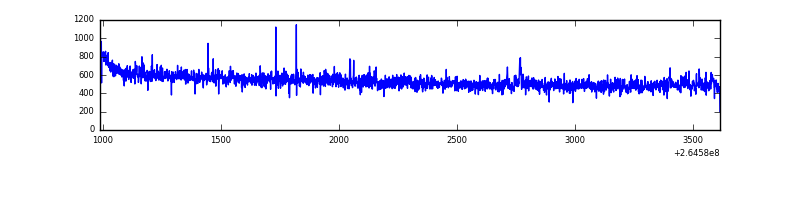 |
| B | 2627 | 2627 | 3 | 3 | 0.11% | 0.11% | 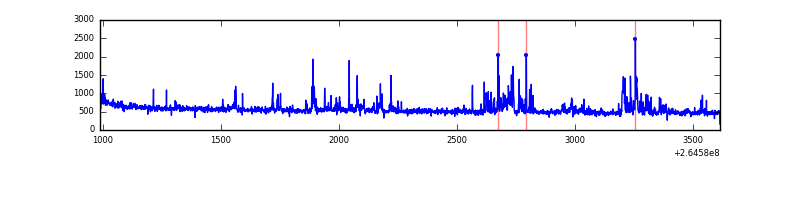 |
| C | 2627 | 2627 | 0 | 0 | 0.00% | 0.00% | 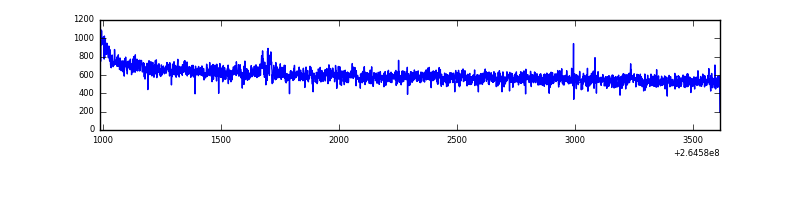 |
| D | 2627 | 2627 | 1 | 1 | 0.04% | 0.04% | 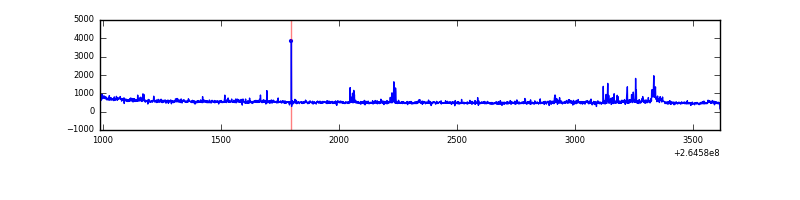 |
Top three noisy pixels from each quadrant. If the there are fewer than three noisy pixels in the level2.evt file, extra rows are filled as -1
| Pixel properties | Quadrant properties | ||||||
|---|---|---|---|---|---|---|---|
| Quadrant | DetID | PixID | Counts | Sigma | Mean | Median | Sigma |
| A | 12 | 189 | 20035 | 274.91 | 353 | 346 | 71.6 |
| A | 8 | 15 | 15210 | 207.54 | 353 | 346 | 71.6 |
| A | 0 | 226 | 3217 | 40.09 | 353 | 346 | 71.6 |
| B | 0 | 229 | 104102 | 1571.56 | 349 | 341 | 66.0 |
| B | 0 | 189 | 34533 | 517.87 | 349 | 341 | 66.0 |
| B | 12 | 111 | 7002 | 100.89 | 349 | 341 | 66.0 |
| C | 3 | 233 | 200240 | 2540.35 | 347 | 349 | 78.7 |
| C | 13 | 61 | 2526 | 27.67 | 347 | 349 | 78.7 |
| C | 3 | 203 | 814 | 5.91 | 347 | 349 | 78.7 |
| D | 5 | 222 | 68448 | 824.96 | 346 | 339 | 82.6 |
| D | 1 | 52 | 16759 | 198.88 | 346 | 339 | 82.6 |
| D | 10 | 70 | 11397 | 133.94 | 346 | 339 | 82.6 |
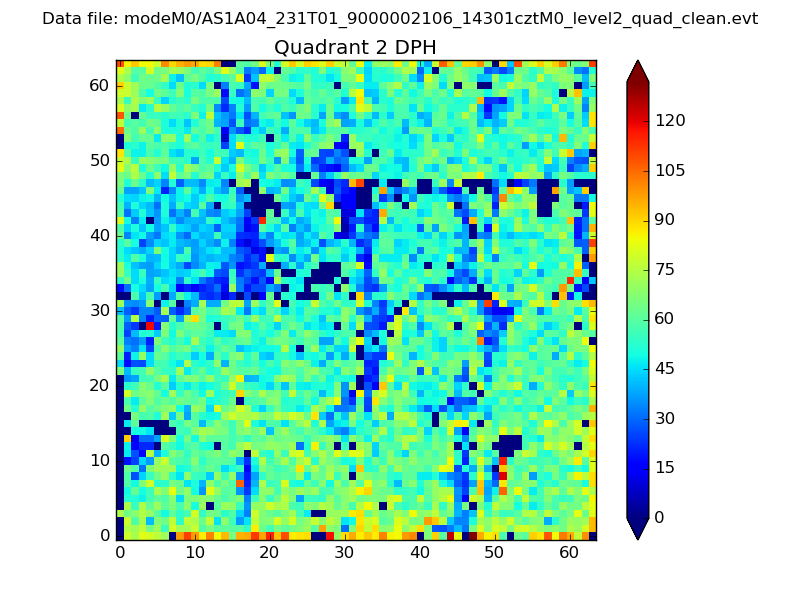
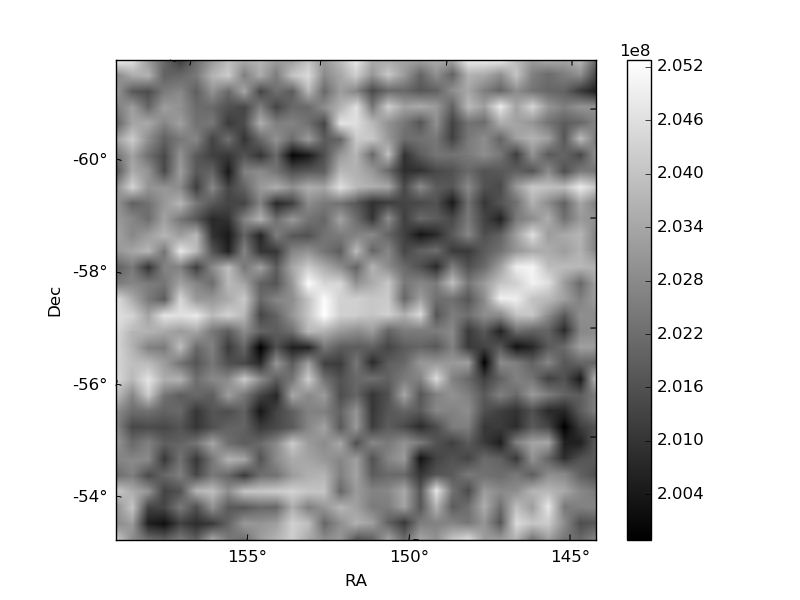
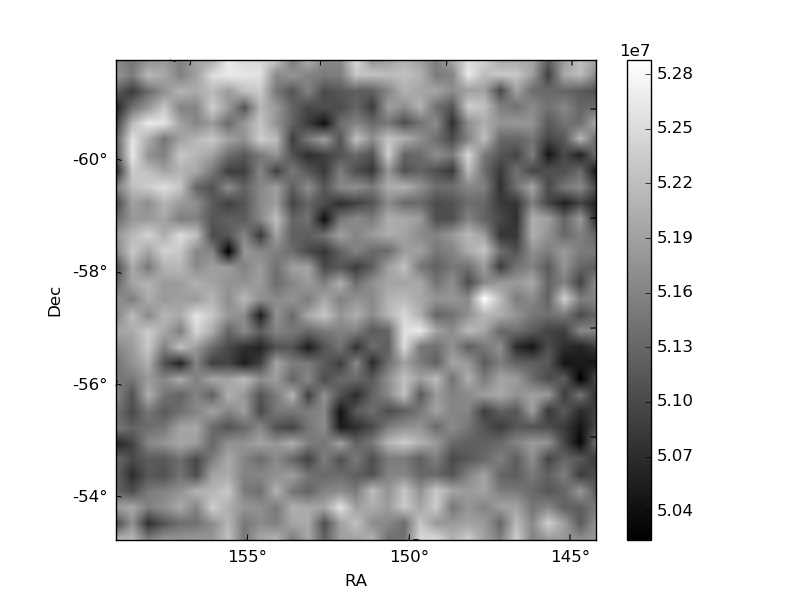
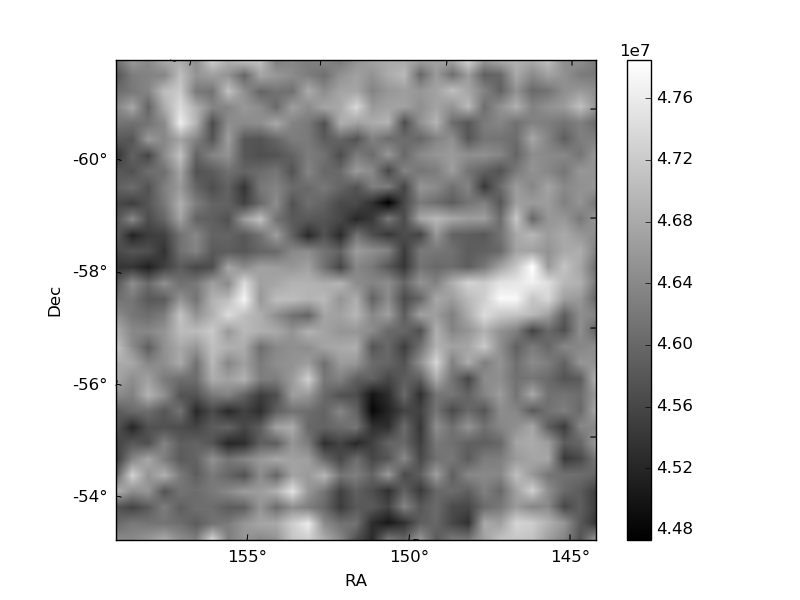
Histogram calculated using DETX and DETY for each event in the final _common_clean file
| Quadrant A | 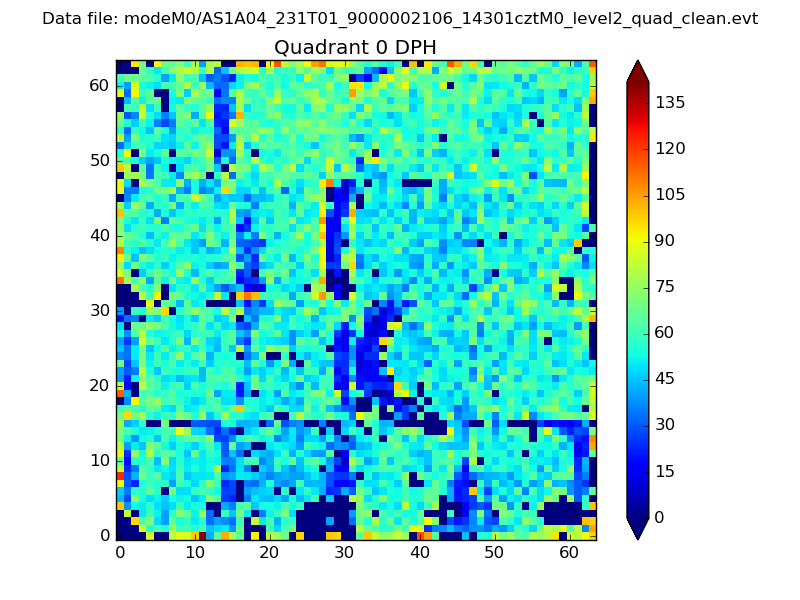 |
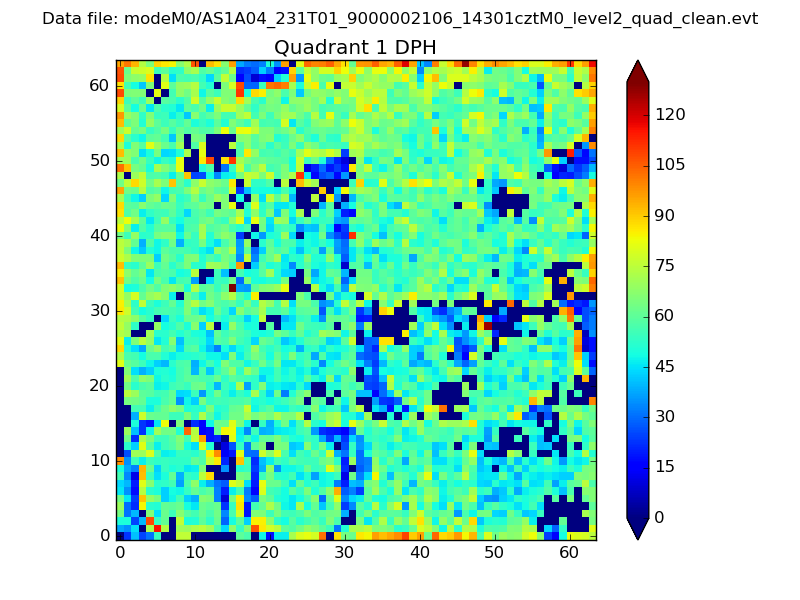 |
Quadrant B |
|---|---|---|---|
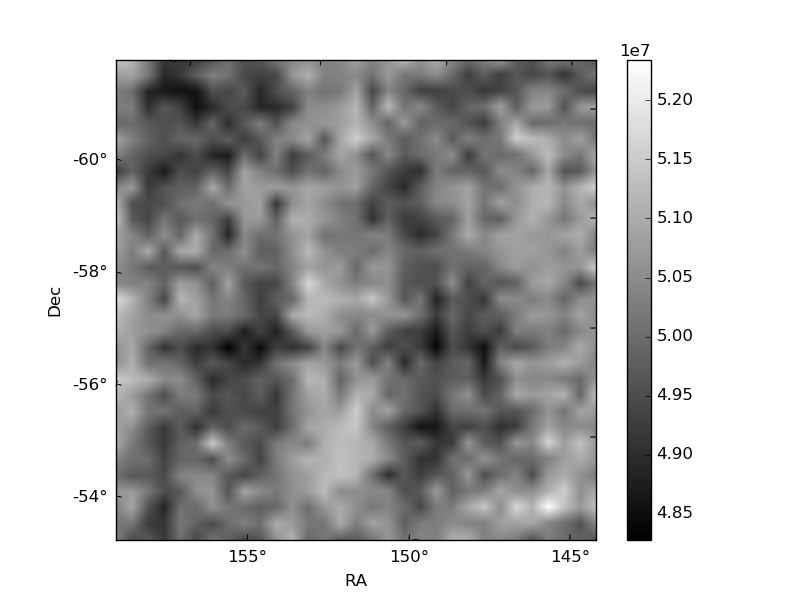
| Quadrant D | 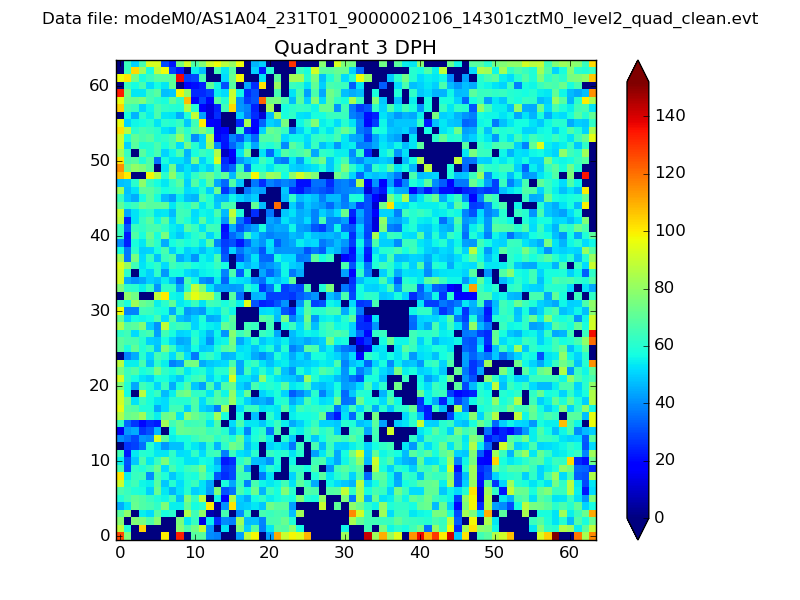 |
 |
Quadrant C |
| Plot type | Count rate plots | Images |
|---|---|---|
| Comparison with Poisson distribution Blue bars denote a histogram of data divided into 1 sec bins. Red curve is a Poisson curve with rate = median count rate of data. |
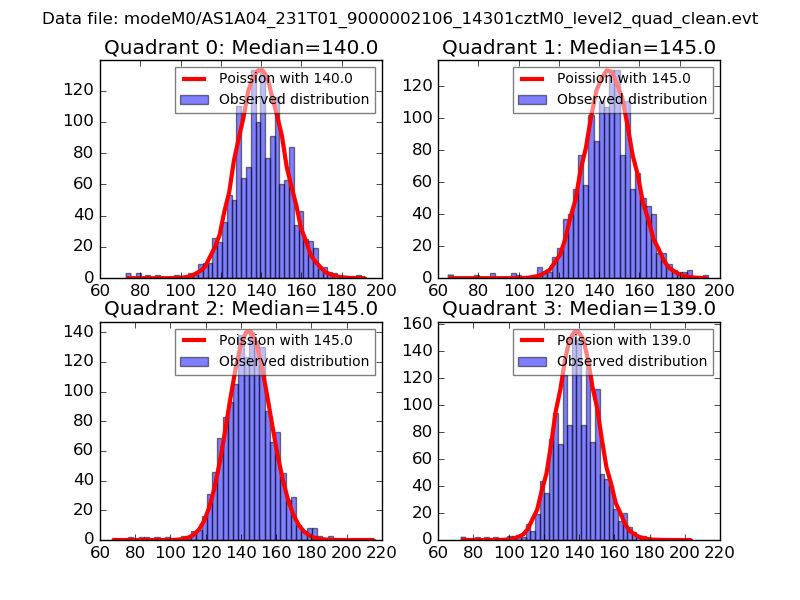 |
 |
| Quadrant-wise count rates Data is divided into 100 sec bins |
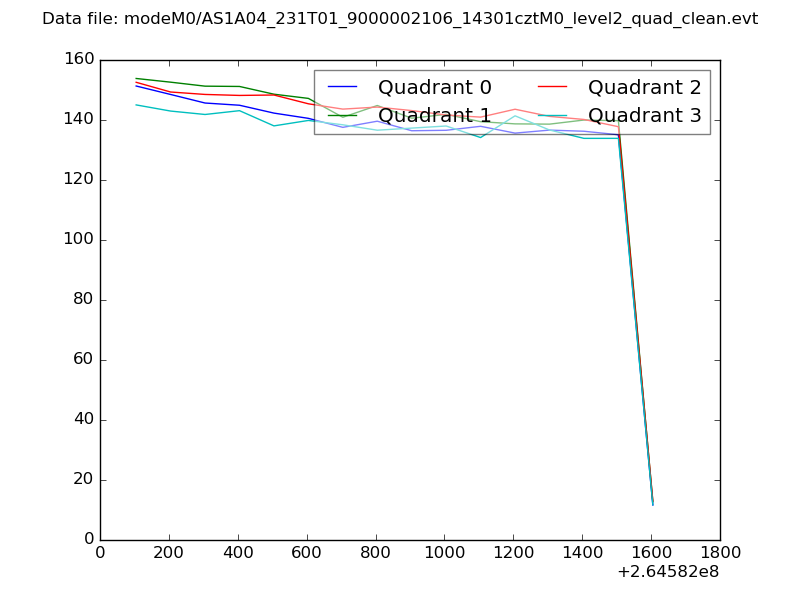 |
|
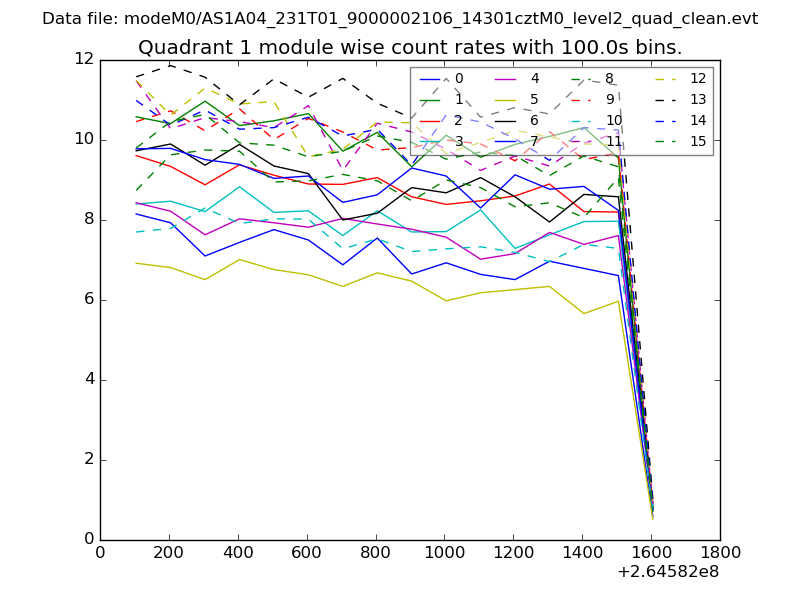
| Module-wise count rates for Quadrant A Data is divided into 100 sec bins |
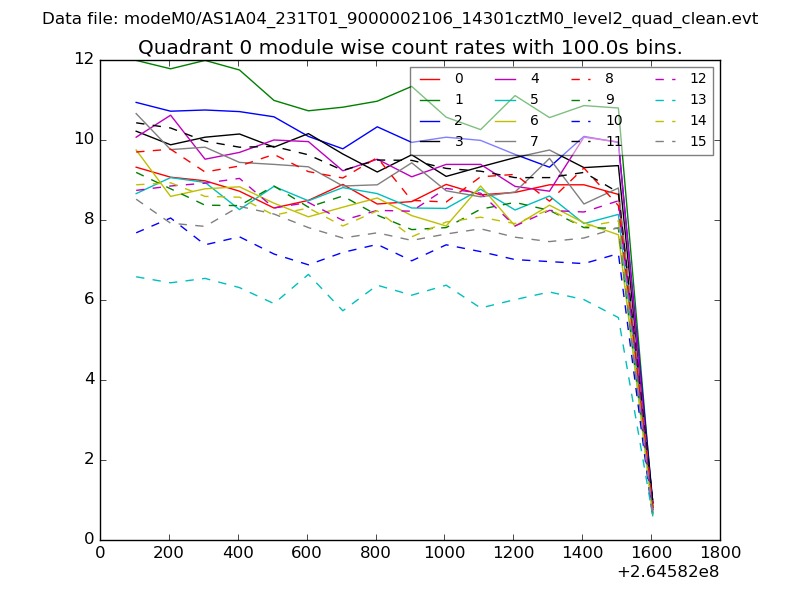 |
 |
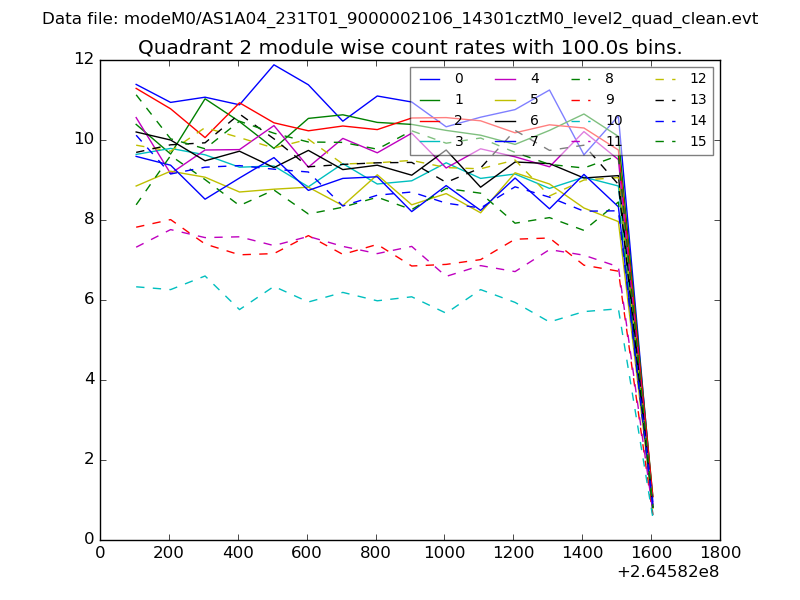
| Module-wise count rates for Quadrant B Data is divided into 100 sec bins |
 |
 |
| Module-wise count rates for Quadrant C Data is divided into 100 sec bins |
 |
 |
| Module-wise count rates for Quadrant D Data is divided into 100 sec bins |
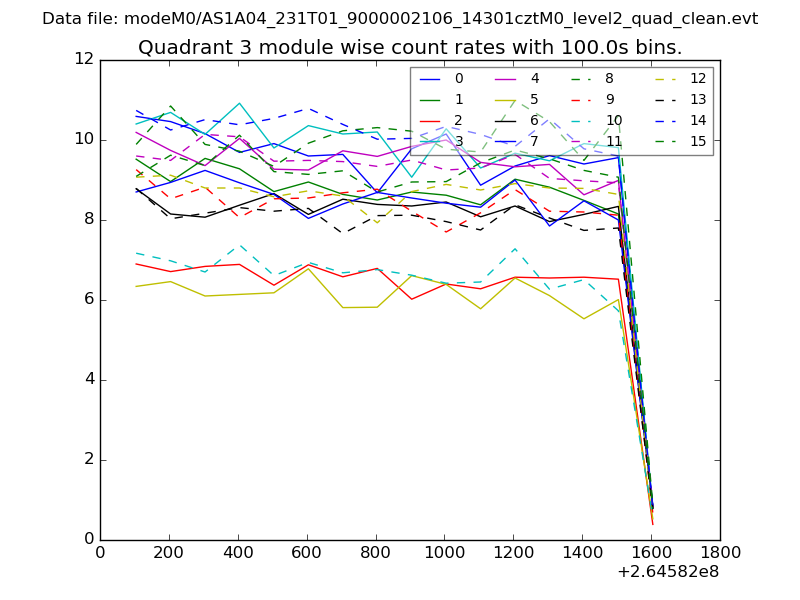 |
 |
| Parameter | Plot |
|---|---|
| CZT HV Monitor | 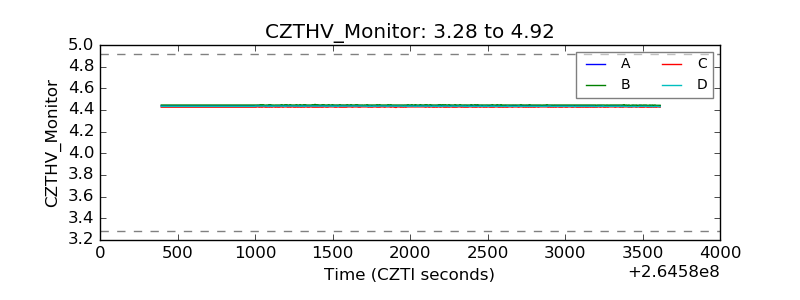 |
| D_VDD | 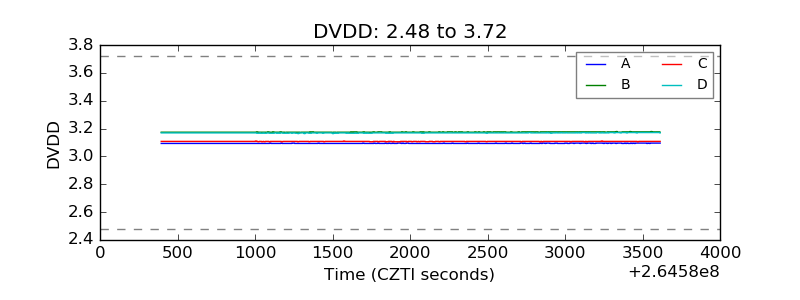 |
| Temperature 1 |  |
| Veto HV Monitor | 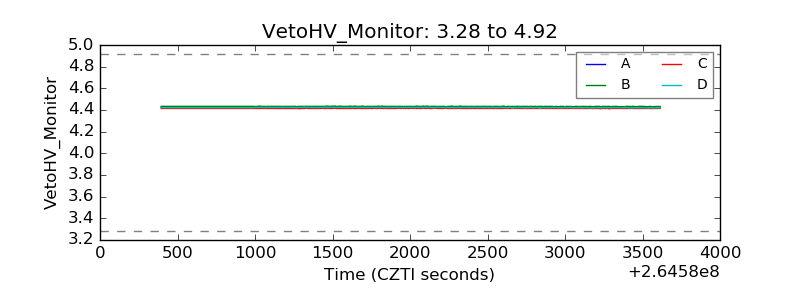 |
| Veto LLD | 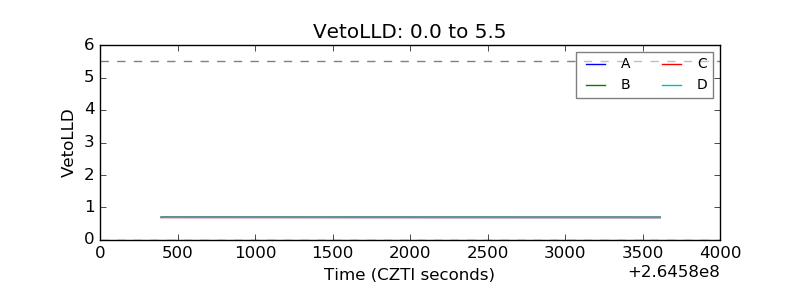 |
| Alpha Counter | 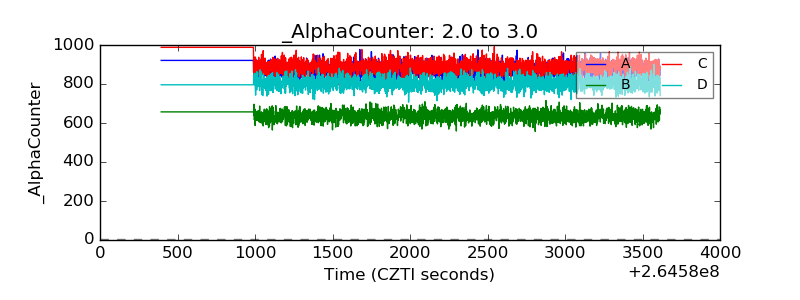 |
| _CPM_Rate | 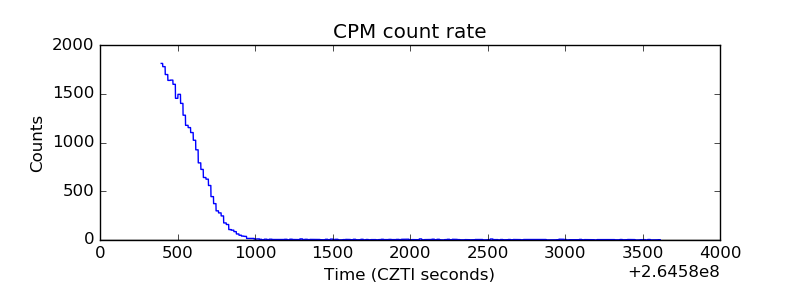 |
| CZT Counter | 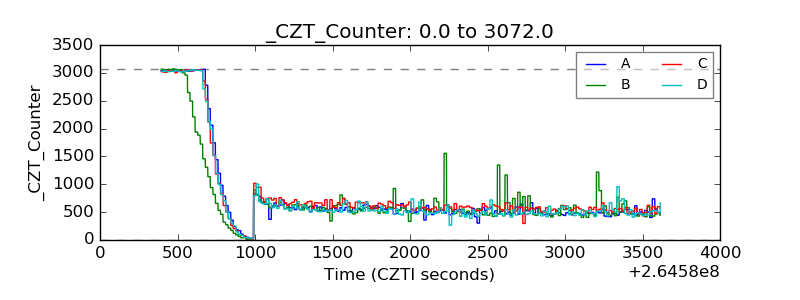 |
| +2.5 Volts monitor |  |
| +5 Volts monitor |  |
| _ROLL_ROT | 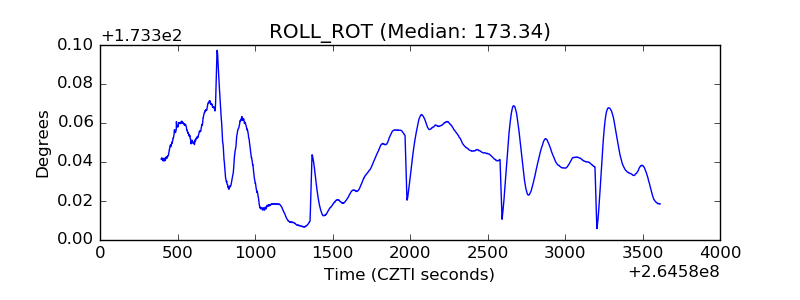 |
| _Roll_DEC | 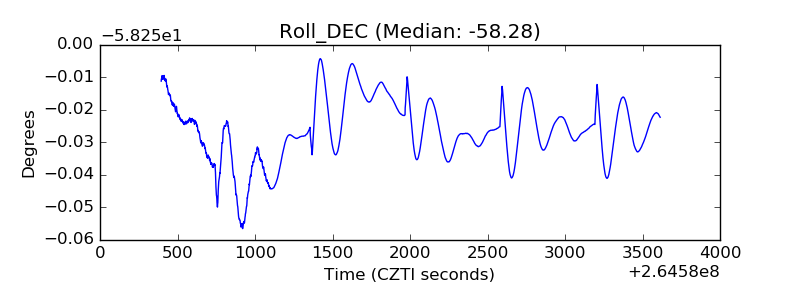 |
| _Roll_RA | 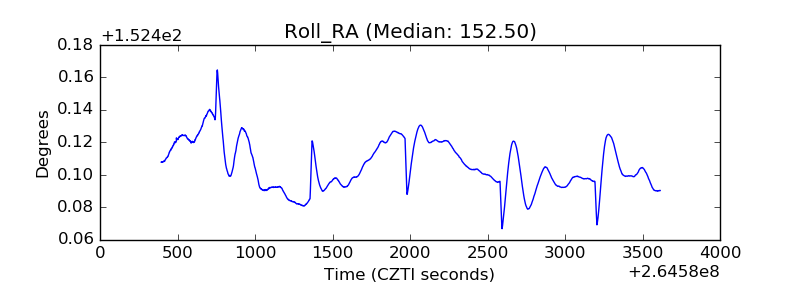 |
| Veto Counter | 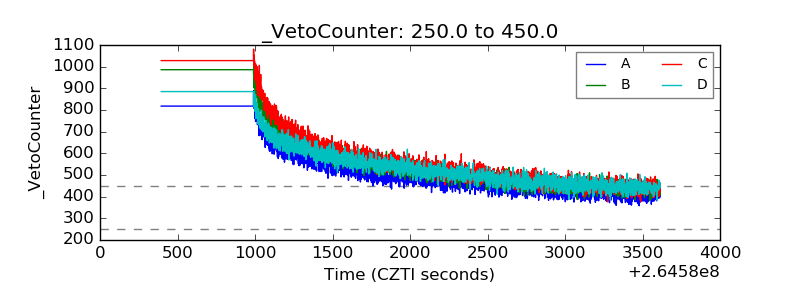 |