| Param | Original file | Final file |
|---|---|---|
| Filename | modeM0/AS1A04_231T01_9000002106_14305cztM0_level2.evt | modeM0/AS1A04_231T01_9000002106_14305cztM0_level2_quad_clean.evt |
| Size (bytes) | 1,544,345,280 | 297,794,880 |
| Size | 1.4 GB | 284.0 MB |
| Events in quadrant A | 10,153,062 | 1,921,787 |
| Events in quadrant B | 11,673,075 | 1,932,827 |
| Events in quadrant C | 11,469,012 | 1,927,765 |
| Events in quadrant D | 12,122,899 | 1,856,796 |
| Mode SS | |||
|---|---|---|---|
| Quadrant | BADHDUFLAG | Total packets | Discarded packets |
| A | 0 | 410 | 0 |
| B | 0 | 410 | 0 |
| C | 0 | 410 | 0 |
| D | 0 | 410 | 0 |
| Mode M0 | |||
|---|---|---|---|
| Quadrant | BADHDUFLAG | Total packets | Discarded packets |
| A | 0 | 42145 | 4 |
| B | 0 | 47225 | 4 |
| C | 0 | 46531 | 4 |
| D | 0 | 48810 | 4 |
| Mode M9 | |||
|---|---|---|---|
| Quadrant | BADHDUFLAG | Total packets | Discarded packets |
| A | 0 | 49 | 0 |
| B | 0 | 49 | 0 |
| C | 0 | 49 | 0 |
| D | 0 | 49 | 0 |
| Quadrant | Total seconds | Saturated seconds | Saturation percentage |
|---|---|---|---|
| A | 20048 | 139 | 0.693336% |
| B | 20048 | 439 | 2.189745% |
| C | 20048 | 155 | 0.773144% |
| D | 20048 | 493 | 2.459098% |
Noise dominated data is calculated using 1-second bins in cleaned event files. If a bin has >2000 counts, and if more than 50% of those come from <1% of pixels, then it is considered to be noise-dominated and hence unusable.
| Quadrant | # 1 sec bins | Bins with >0 counts | Bins with >2000 counts | High rate bins dominated by noise | Noise dominated (total time) | Noise dominated (detector-on time) | Marked lightcurve |
|---|---|---|---|---|---|---|---|
| A | 24954 | 20053 | 2 | 2 | 0.01% | 0.01% | 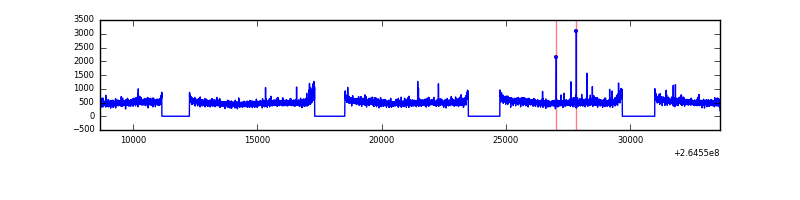 |
| B | 24954 | 20053 | 167 | 167 | 0.67% | 0.83% | 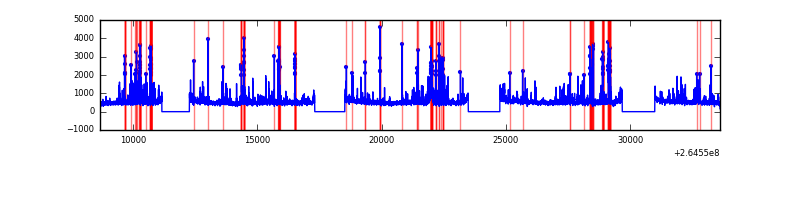 |
| C | 24954 | 20053 | 0 | 0 | 0.00% | 0.00% | 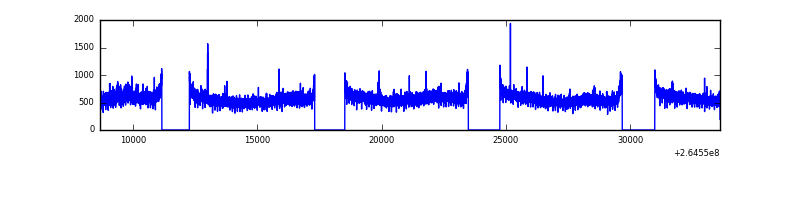 |
| D | 24954 | 20052 | 378 | 378 | 1.51% | 1.89% | 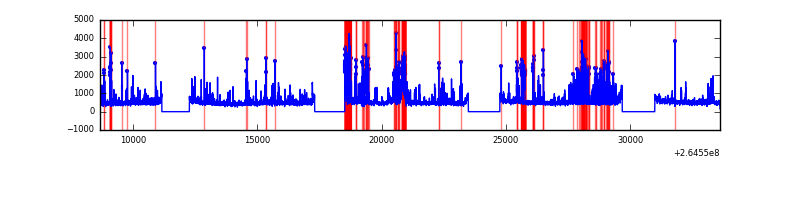 |
Top three noisy pixels from each quadrant. If the there are fewer than three noisy pixels in the level2.evt file, extra rows are filled as -1
| Pixel properties | Quadrant properties | ||||||
|---|---|---|---|---|---|---|---|
| Quadrant | DetID | PixID | Counts | Sigma | Mean | Median | Sigma |
| A | 12 | 189 | 175319 | 345.62 | 2536 | 2489 | 500.1 |
| A | 8 | 15 | 114253 | 223.51 | 2536 | 2489 | 500.1 |
| A | 0 | 23 | 86199 | 167.4 | 2536 | 2489 | 500.1 |
| B | 0 | 229 | 791030 | 1715.22 | 2511 | 2452 | 459.8 |
| B | 10 | 245 | 470009 | 1016.97 | 2511 | 2452 | 459.8 |
| B | 10 | 244 | 149988 | 320.9 | 2511 | 2452 | 459.8 |
| C | 3 | 233 | 1807414 | 3250.26 | 2474 | 2489 | 555.3 |
| C | 13 | 61 | 18012 | 27.95 | 2474 | 2489 | 555.3 |
| C | 14 | 234 | 9491 | 12.61 | 2474 | 2489 | 555.3 |
| D | 5 | 222 | 1329944 | 2301.71 | 2462 | 2406 | 576.8 |
| D | 12 | 110 | 530321 | 915.31 | 2462 | 2406 | 576.8 |
| D | 2 | 14 | 424203 | 731.32 | 2462 | 2406 | 576.8 |
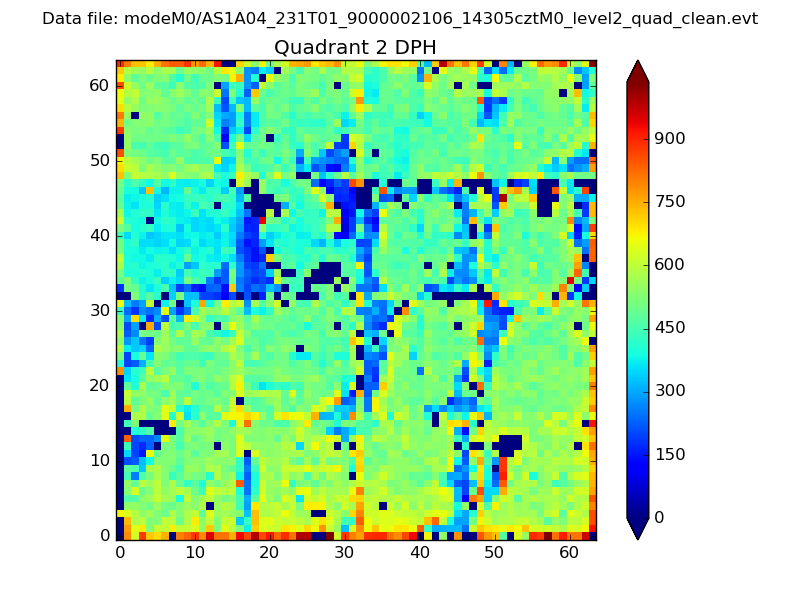
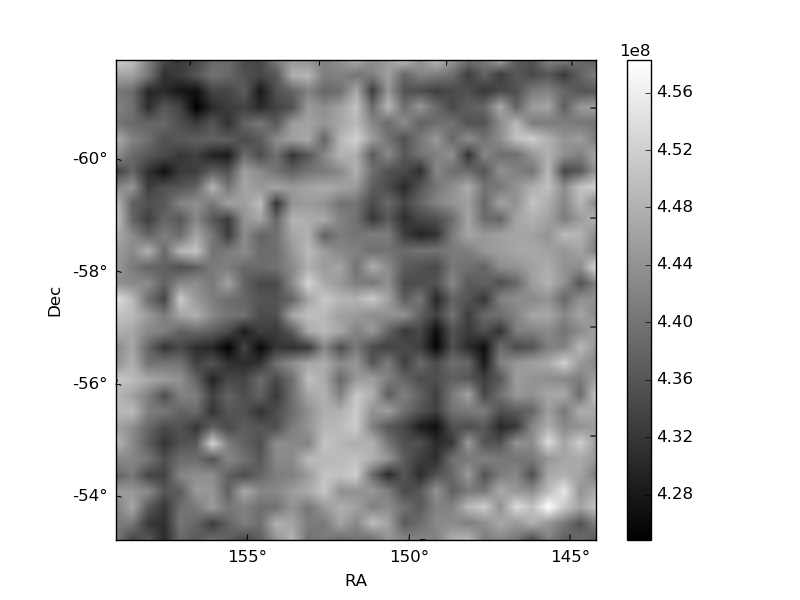
Histogram calculated using DETX and DETY for each event in the final _common_clean file
| Quadrant A | 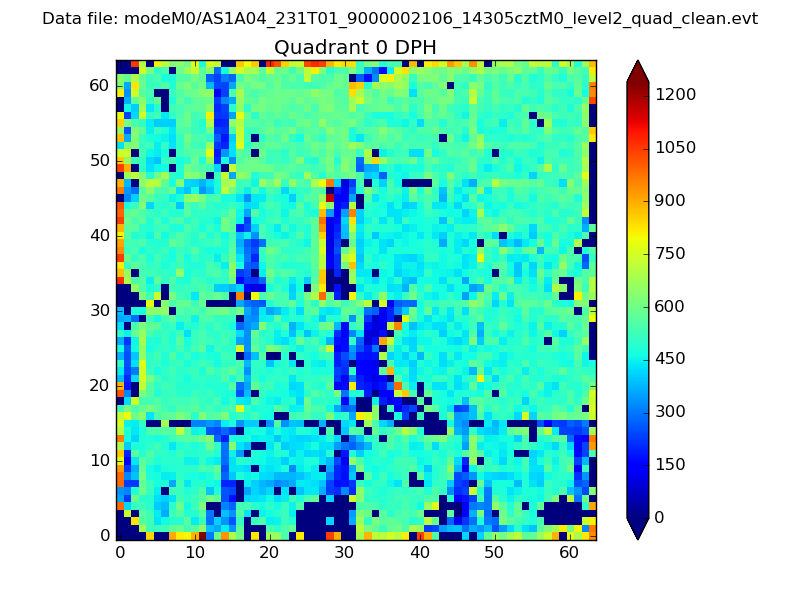 |
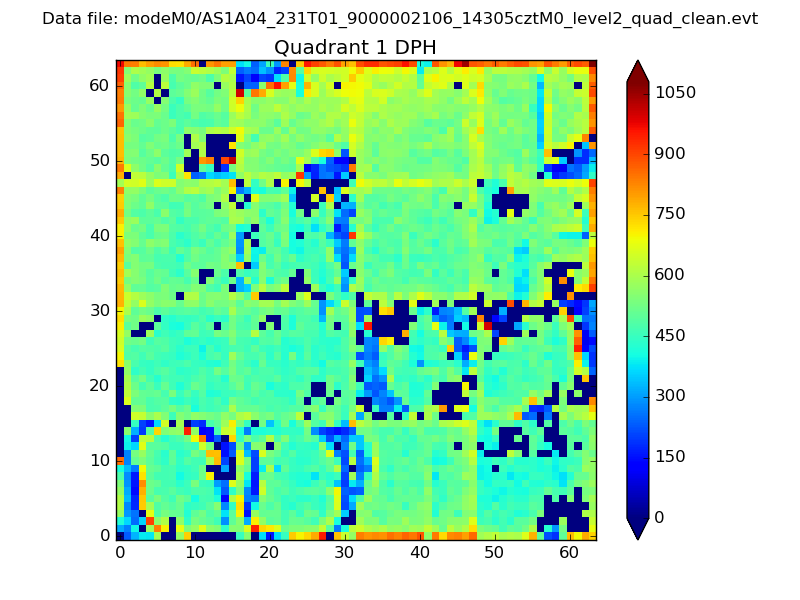 |
Quadrant B |
|---|---|---|---|
| Quadrant D | 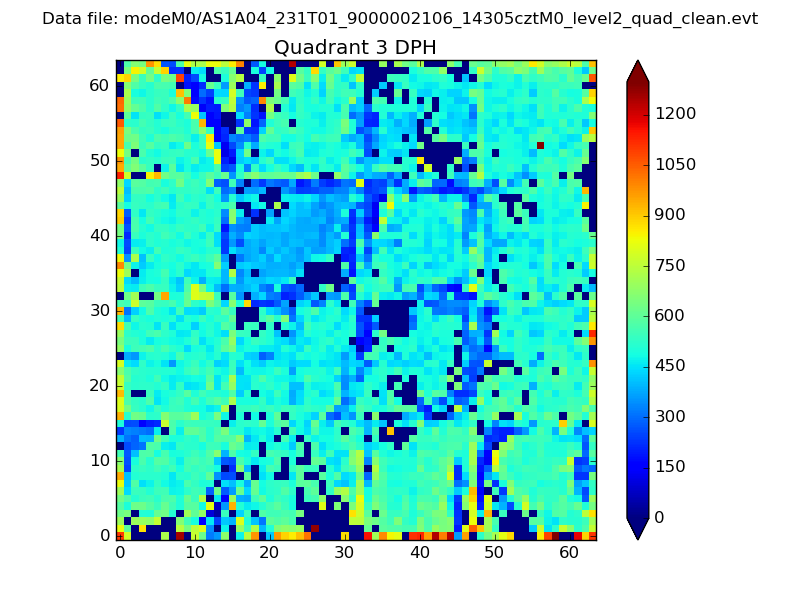 |
 |
Quadrant C |
| Plot type | Count rate plots | Images |
|---|---|---|
| Comparison with Poisson distribution Blue bars denote a histogram of data divided into 1 sec bins. Red curve is a Poisson curve with rate = median count rate of data. |
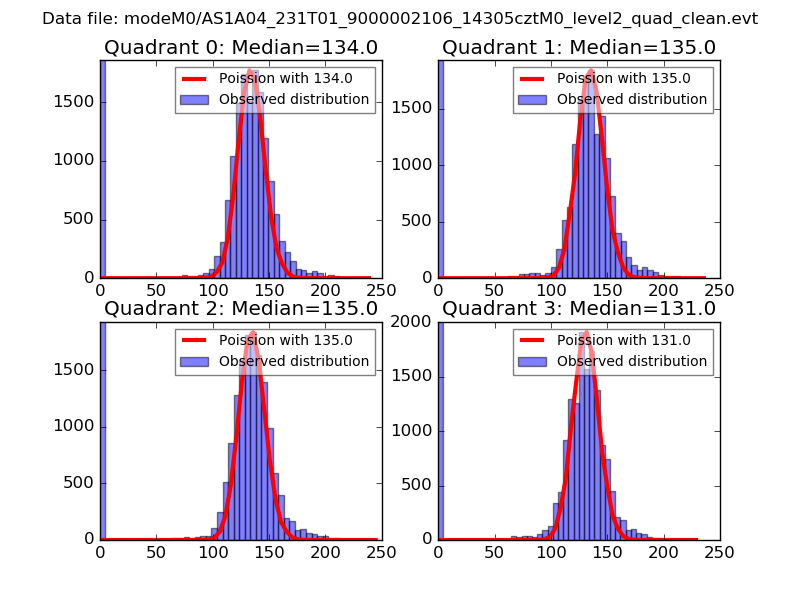 |
 |
| Quadrant-wise count rates Data is divided into 100 sec bins |
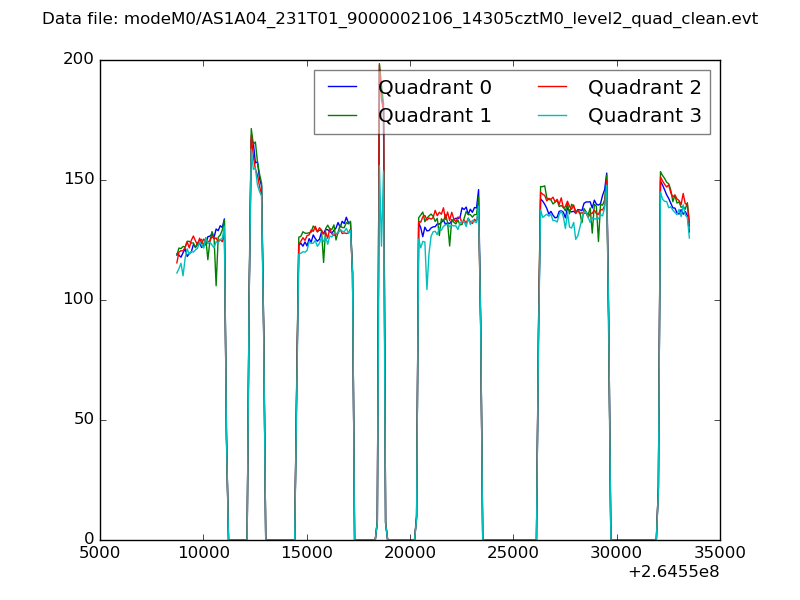 |
|
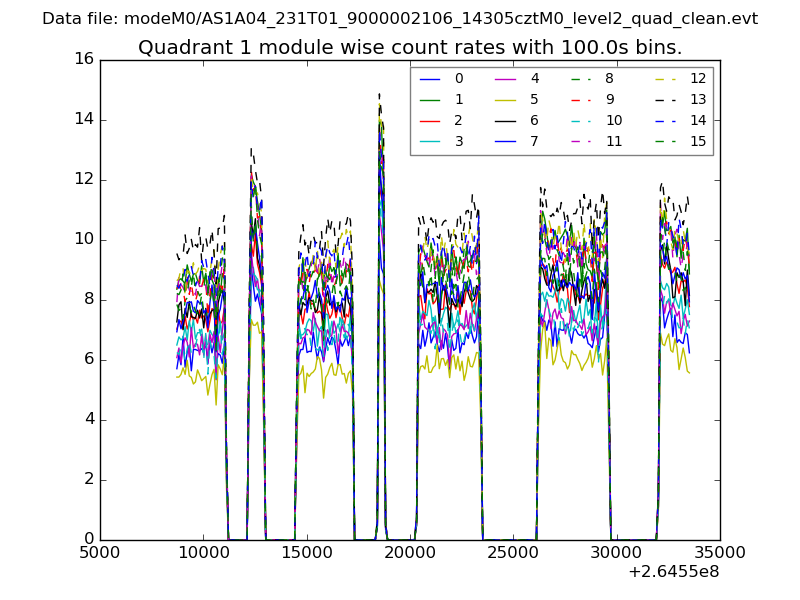
| Module-wise count rates for Quadrant A Data is divided into 100 sec bins |
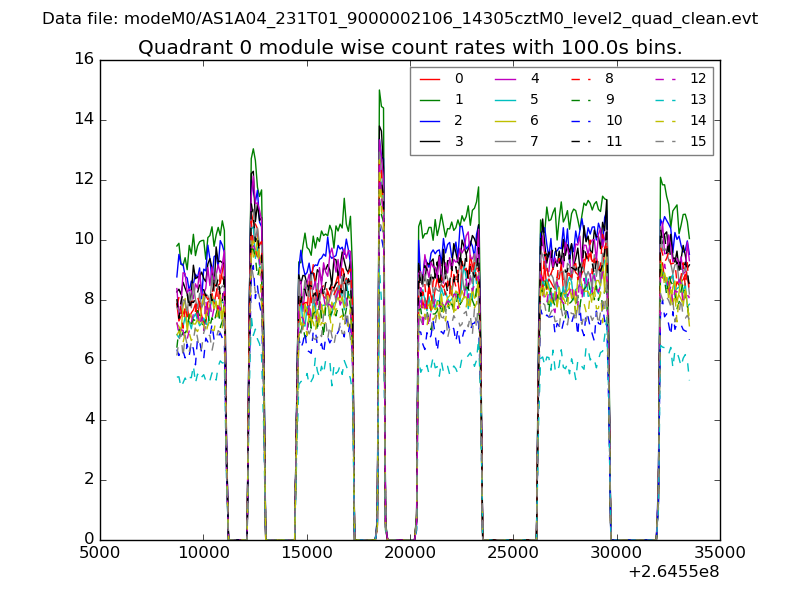 |
 |
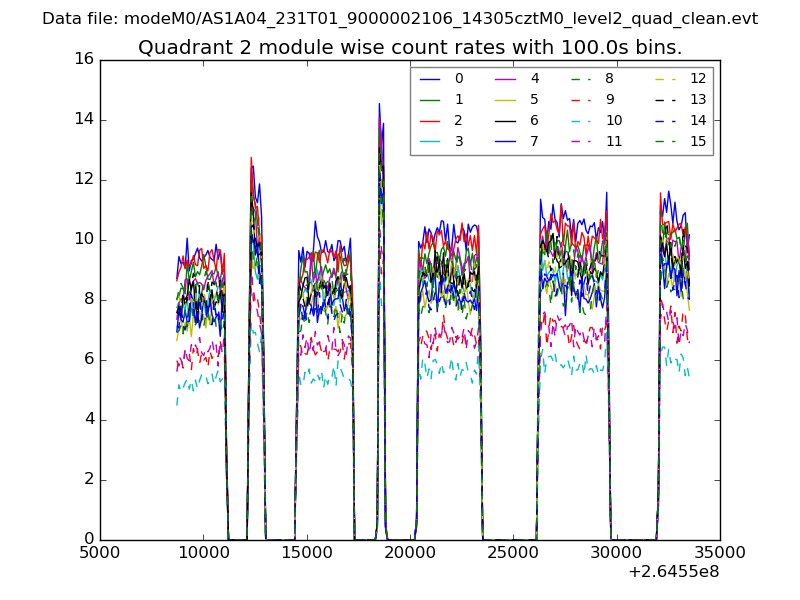
| Module-wise count rates for Quadrant B Data is divided into 100 sec bins |
 |
 |
| Module-wise count rates for Quadrant C Data is divided into 100 sec bins |
 |
 |
| Module-wise count rates for Quadrant D Data is divided into 100 sec bins |
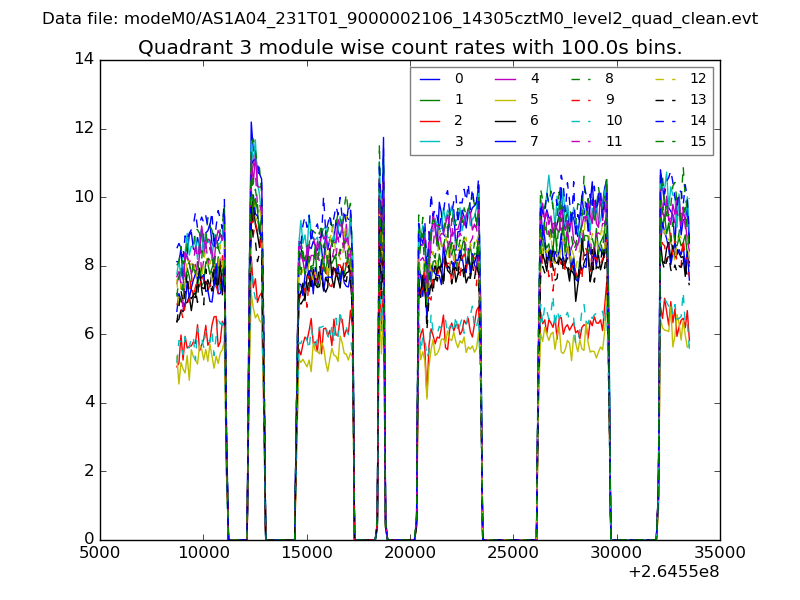 |
 |
| Parameter | Plot |
|---|---|
| CZT HV Monitor | 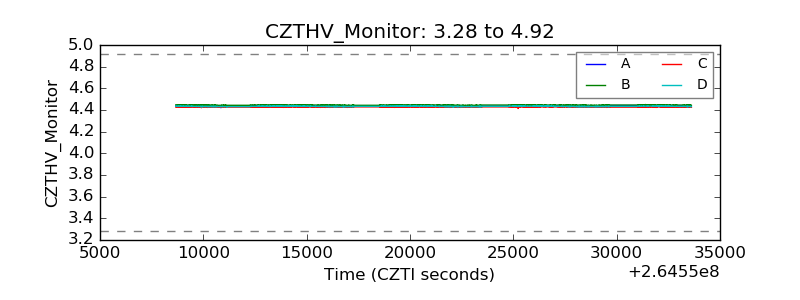 |
| D_VDD | 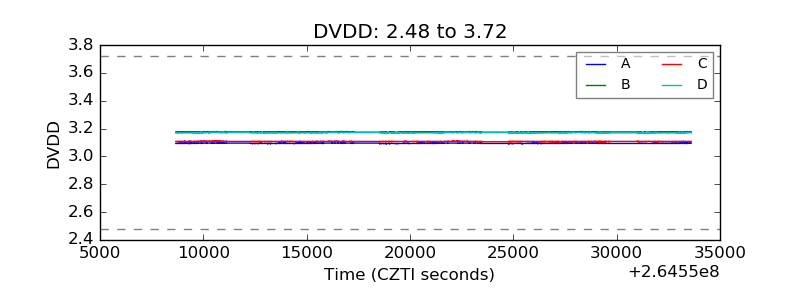 |
| Temperature 1 | 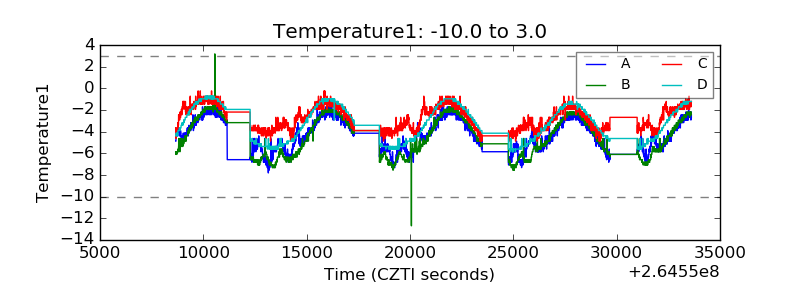 |
| Veto HV Monitor |  |
| Veto LLD | 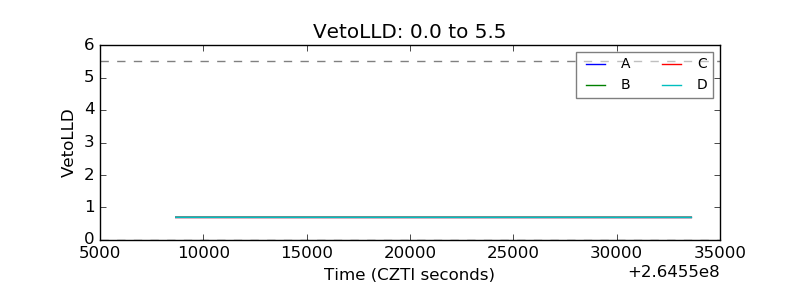 |
| Alpha Counter | 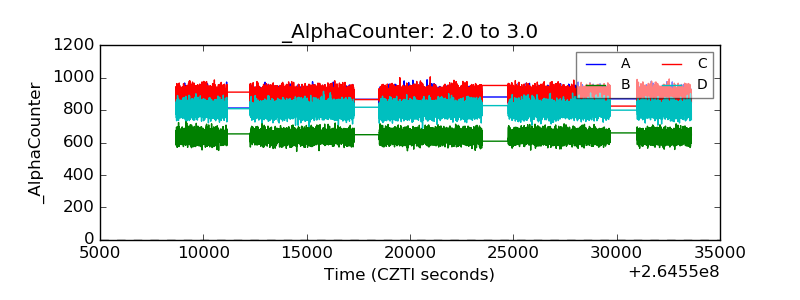 |
| _CPM_Rate | 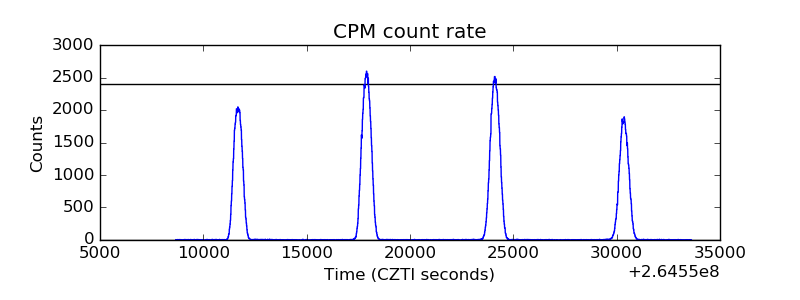 |
| CZT Counter | 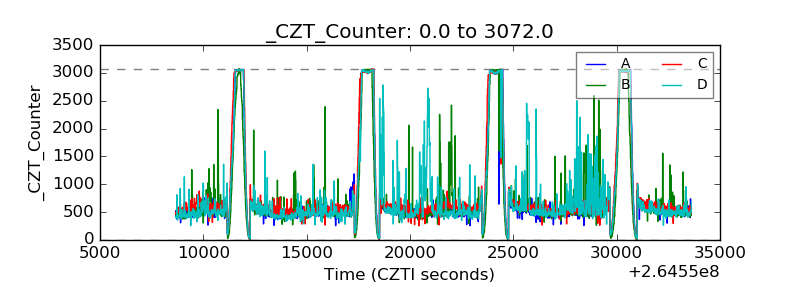 |
| +2.5 Volts monitor |  |
| +5 Volts monitor | 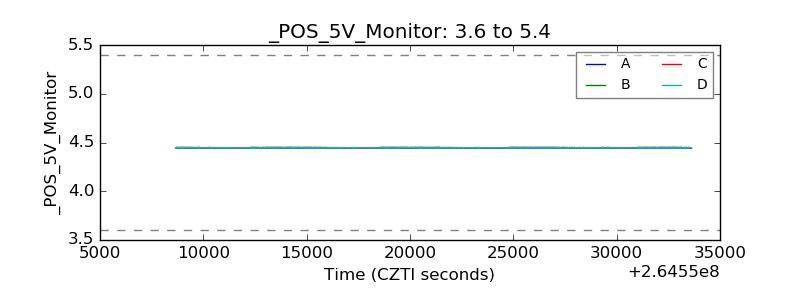 |
| _ROLL_ROT | 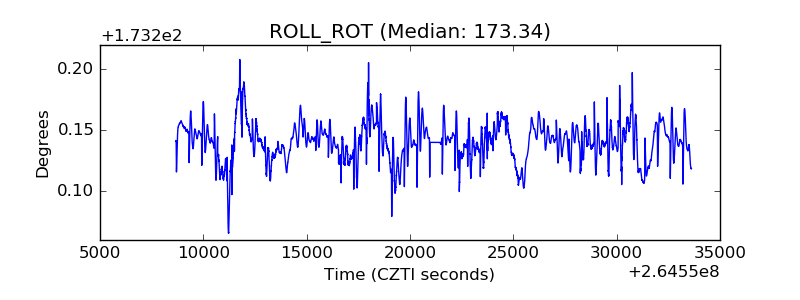 |
| _Roll_DEC | 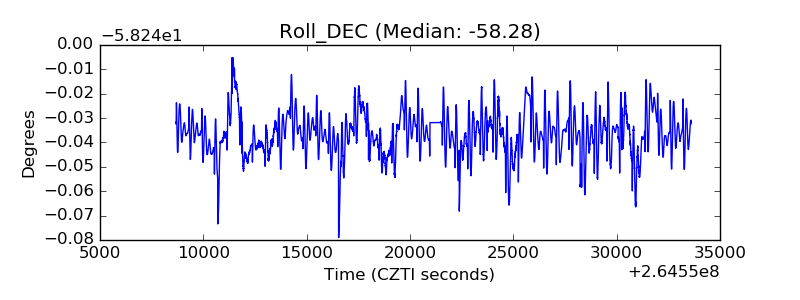 |
| _Roll_RA |  |
| Veto Counter | 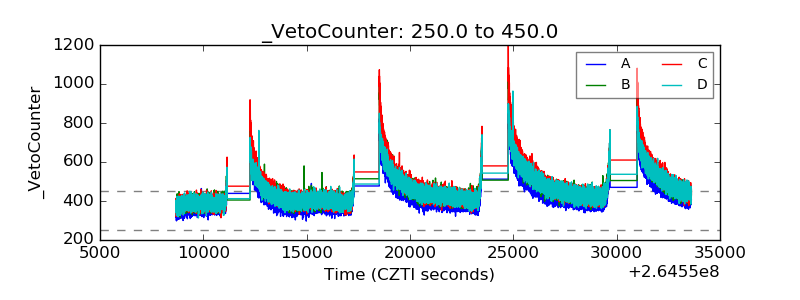 |