| Param | Original file | Final file |
|---|---|---|
| Filename | modeM0/AS1A04_231T01_9000002106_14306cztM0_level2.evt | modeM0/AS1A04_231T01_9000002106_14306cztM0_level2_quad_clean.evt |
| Size (bytes) | 152,784,000 | 33,292,800 |
| Size | 145.7 MB | 31.8 MB |
| Events in quadrant A | 1,053,073 | 211,678 |
| Events in quadrant B | 1,167,159 | 218,274 |
| Events in quadrant C | 1,177,928 | 218,238 |
| Events in quadrant D | 1,085,715 | 209,354 |
| Mode SS | |||
|---|---|---|---|
| Quadrant | BADHDUFLAG | Total packets | Discarded packets |
| A | 0 | 42 | 0 |
| B | 0 | 42 | 0 |
| C | 0 | 42 | 0 |
| D | 0 | 42 | 0 |
| Mode M0 | |||
|---|---|---|---|
| Quadrant | BADHDUFLAG | Total packets | Discarded packets |
| A | 0 | 4266 | 0 |
| B | 0 | 4674 | 0 |
| C | 0 | 4734 | 0 |
| D | 0 | 4416 | 0 |
| Quadrant | Total seconds | Saturated seconds | Saturation percentage |
|---|---|---|---|
| A | 2068 | 2 | 0.096712% |
| B | 2068 | 8 | 0.386847% |
| C | 2068 | 3 | 0.145068% |
| D | 2068 | 3 | 0.145068% |
Noise dominated data is calculated using 1-second bins in cleaned event files. If a bin has >2000 counts, and if more than 50% of those come from <1% of pixels, then it is considered to be noise-dominated and hence unusable.
| Quadrant | # 1 sec bins | Bins with >0 counts | Bins with >2000 counts | High rate bins dominated by noise | Noise dominated (total time) | Noise dominated (detector-on time) | Marked lightcurve |
|---|---|---|---|---|---|---|---|
| A | 2069 | 2069 | 0 | 0 | 0.00% | 0.00% |  |
| B | 2069 | 2069 | 3 | 3 | 0.14% | 0.14% |  |
| C | 2069 | 2069 | 0 | 0 | 0.00% | 0.00% |  |
| D | 2069 | 2069 | 1 | 1 | 0.05% | 0.05% |  |
Top three noisy pixels from each quadrant. If the there are fewer than three noisy pixels in the level2.evt file, extra rows are filled as -1
| Pixel properties | Quadrant properties | ||||||
|---|---|---|---|---|---|---|---|
| Quadrant | DetID | PixID | Counts | Sigma | Mean | Median | Sigma |
| A | 12 | 189 | 19103 | 344.33 | 265 | 261 | 54.7 |
| A | 8 | 15 | 11946 | 213.54 | 265 | 261 | 54.7 |
| A | 0 | 226 | 2464 | 40.26 | 265 | 261 | 54.7 |
| B | 0 | 229 | 101711 | 2028.94 | 261 | 256 | 50.0 |
| B | 0 | 189 | 34385 | 682.53 | 261 | 256 | 50.0 |
| B | 12 | 111 | 5295 | 100.77 | 261 | 256 | 50.0 |
| C | 3 | 233 | 156187 | 2596.11 | 261 | 263 | 60.1 |
| C | 13 | 61 | 1905 | 27.34 | 261 | 263 | 60.1 |
| C | 10 | 22 | 726 | 7.71 | 261 | 263 | 60.1 |
| D | 5 | 222 | 54347 | 867.88 | 261 | 256 | 62.3 |
| D | 1 | 52 | 16592 | 262.11 | 261 | 256 | 62.3 |
| D | 10 | 70 | 11318 | 177.49 | 261 | 256 | 62.3 |
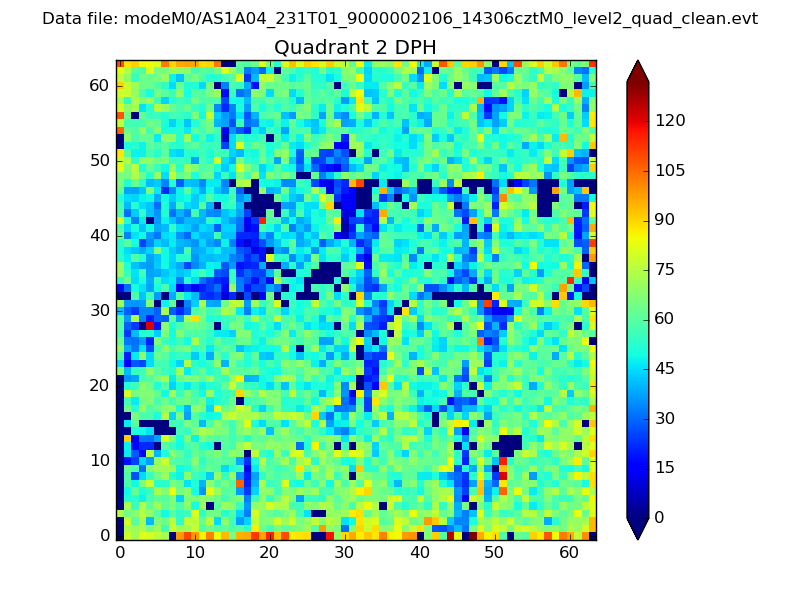
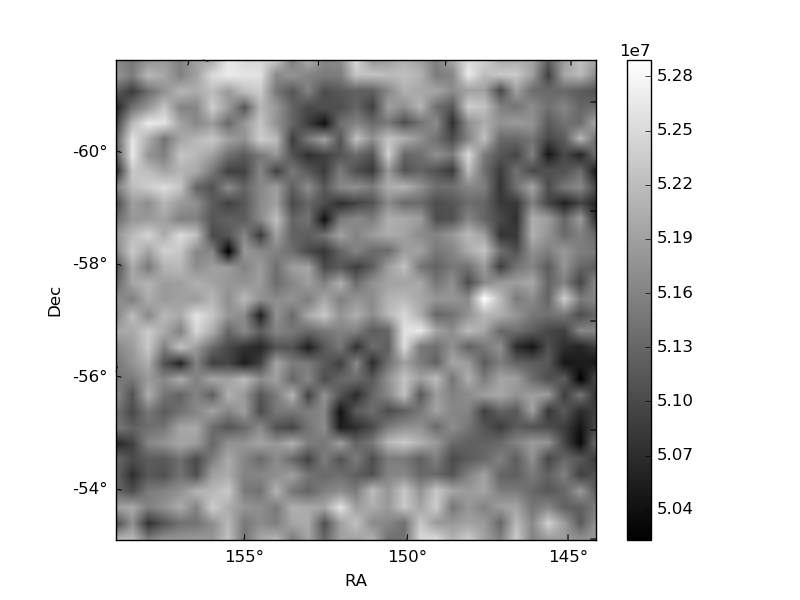
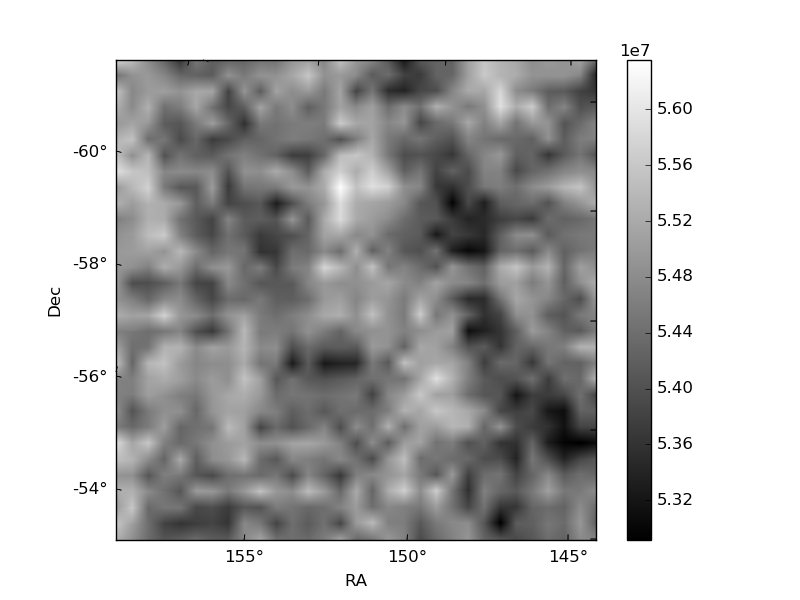
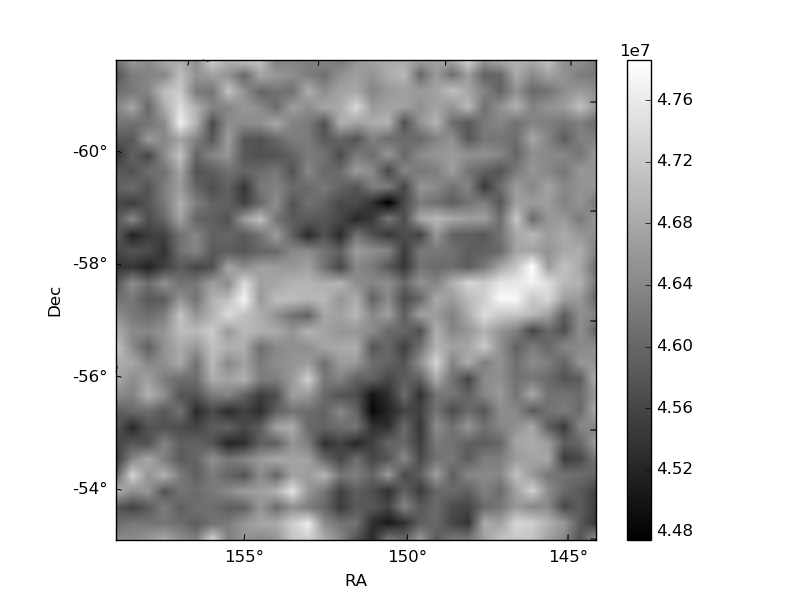
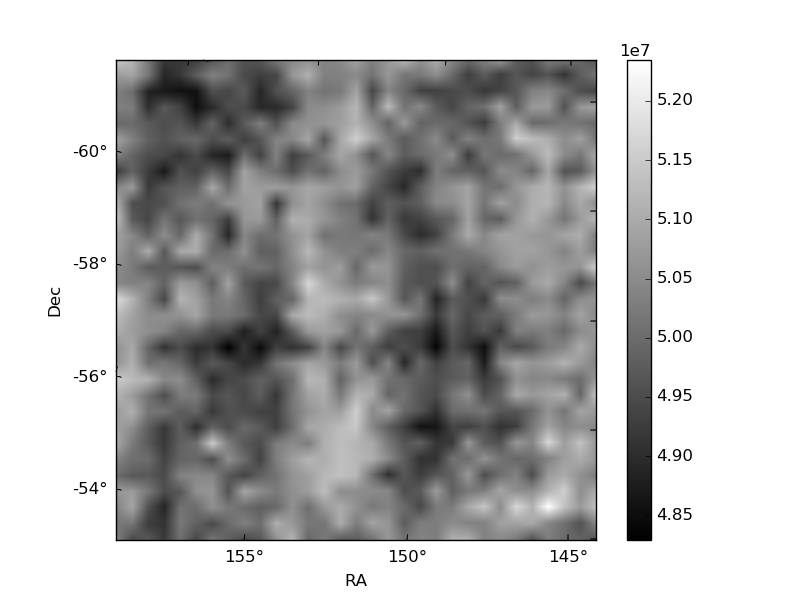
Histogram calculated using DETX and DETY for each event in the final _common_clean file
| Quadrant A | 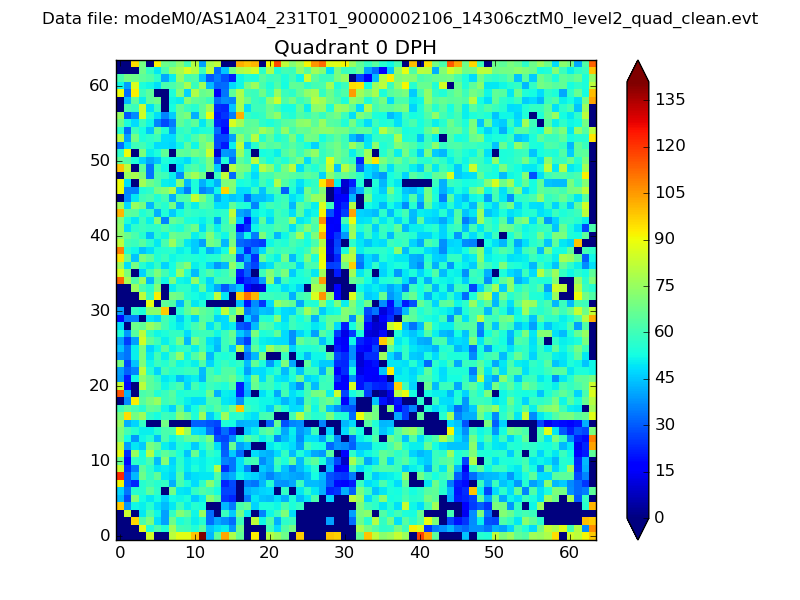 |
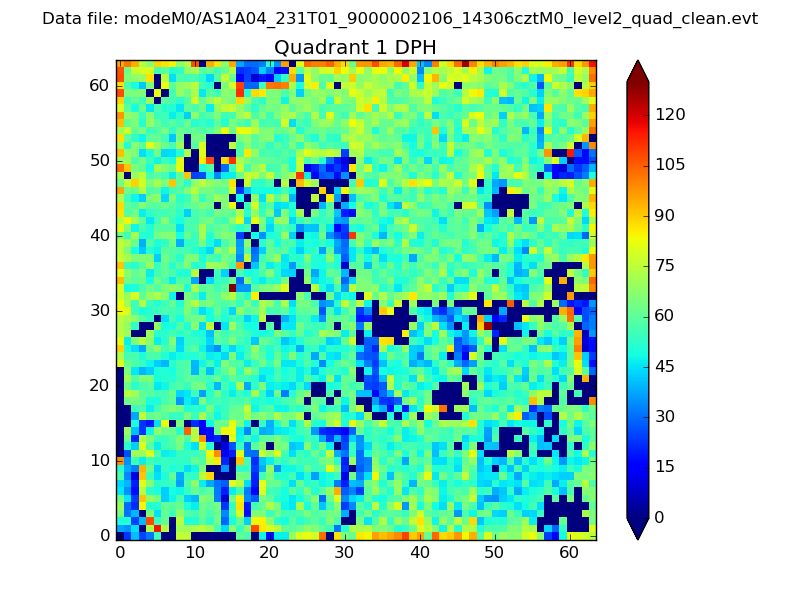 |
Quadrant B |
|---|---|---|---|
| Quadrant D | 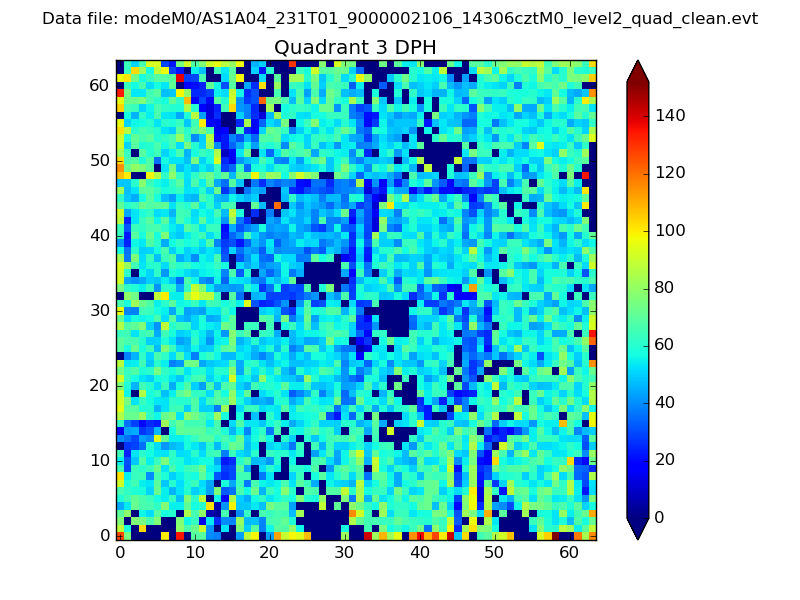 |
 |
Quadrant C |
| Plot type | Count rate plots | Images |
|---|---|---|
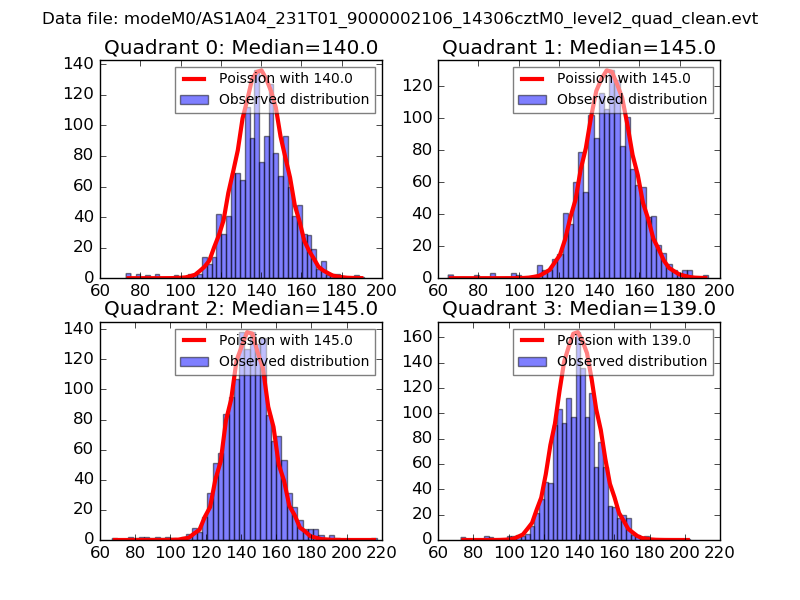
| Comparison with Poisson distribution Blue bars denote a histogram of data divided into 1 sec bins. Red curve is a Poisson curve with rate = median count rate of data. |
 |
 |
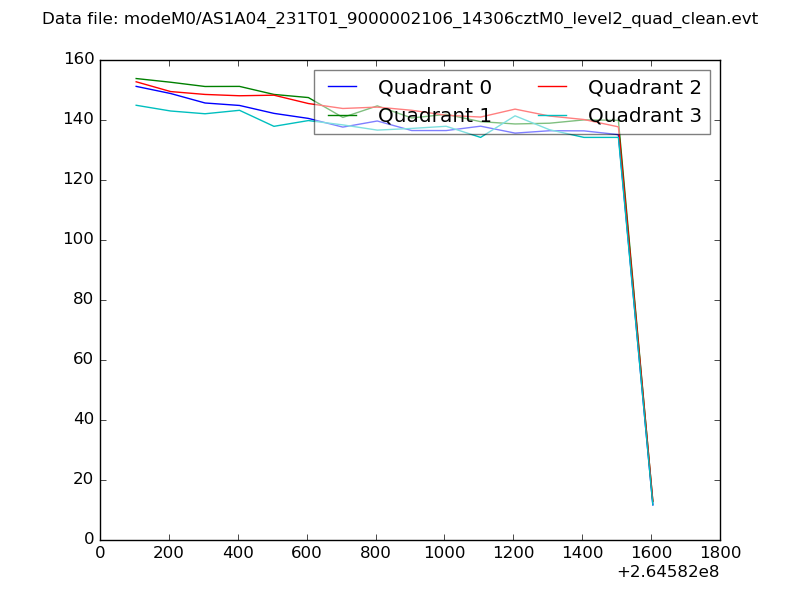
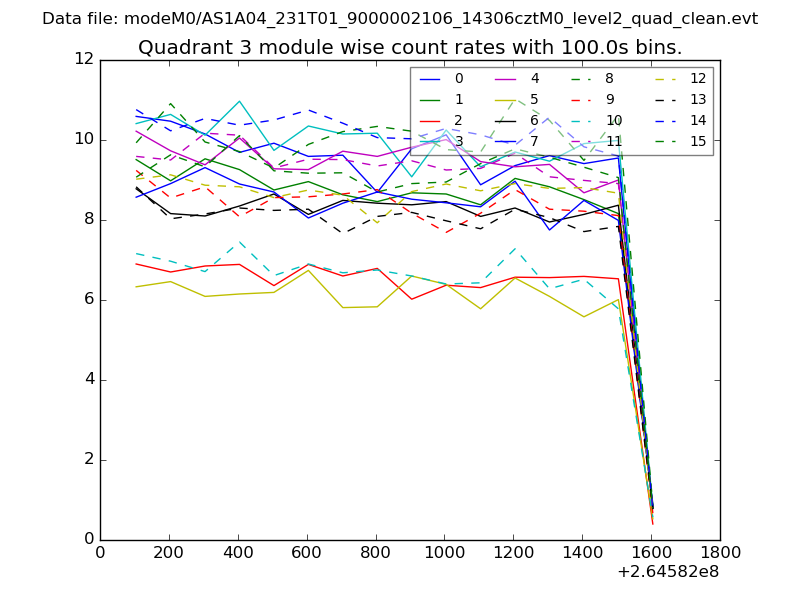
| Quadrant-wise count rates Data is divided into 100 sec bins |
 |
|
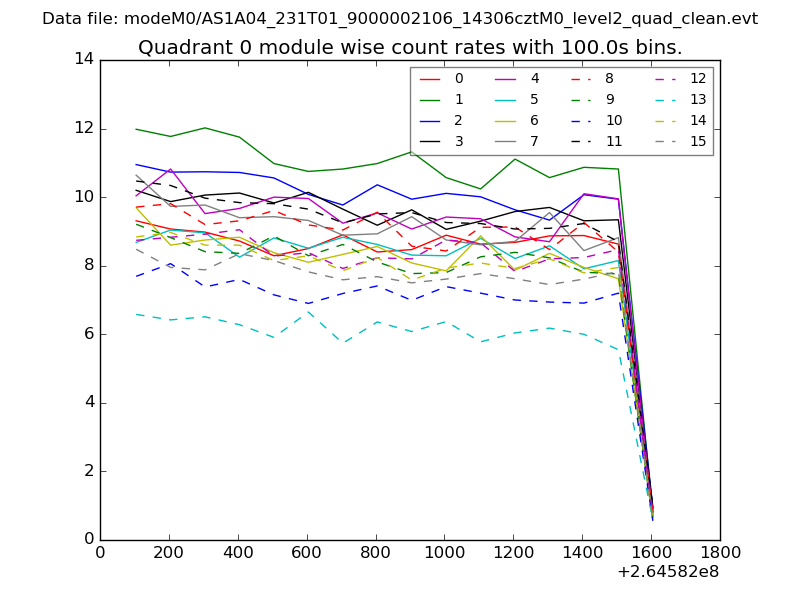
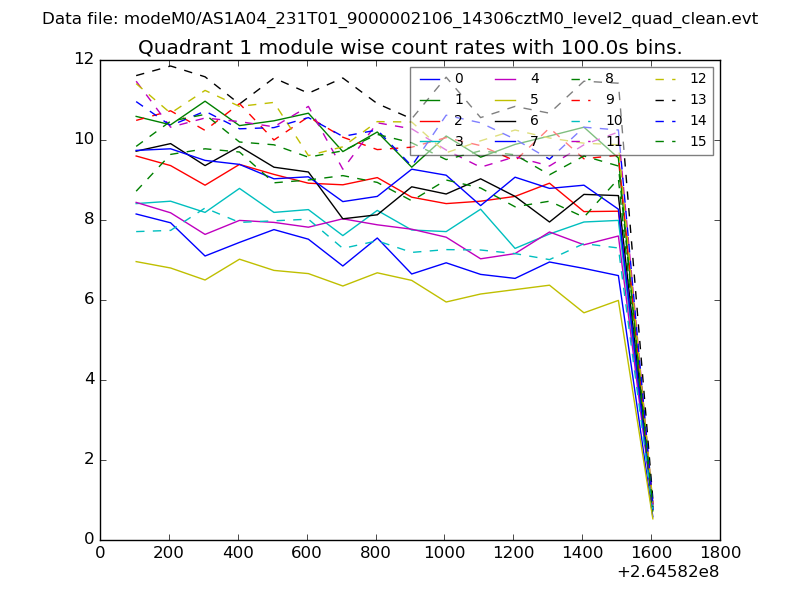
| Module-wise count rates for Quadrant A Data is divided into 100 sec bins |
 |
 |
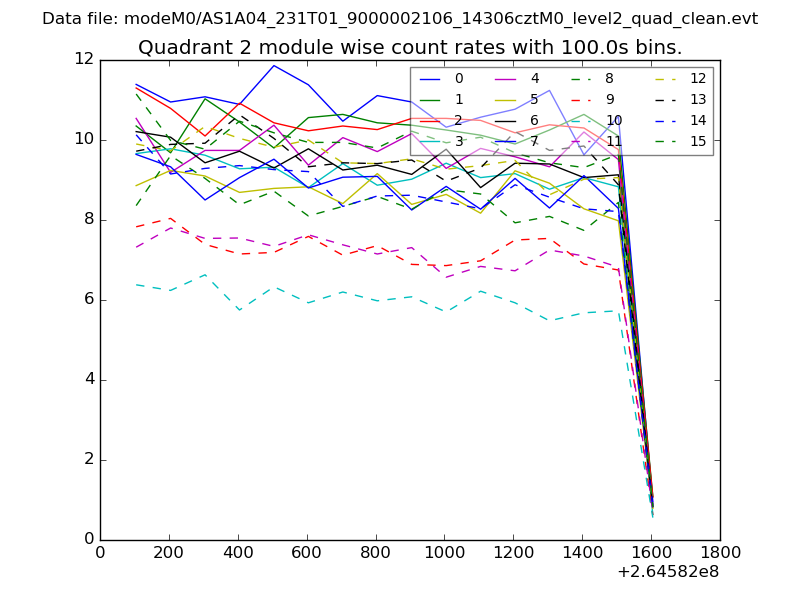
| Module-wise count rates for Quadrant B Data is divided into 100 sec bins |
 |
 |
| Module-wise count rates for Quadrant C Data is divided into 100 sec bins |
 |
 |
| Module-wise count rates for Quadrant D Data is divided into 100 sec bins |
 |
 |
| Parameter | Plot |
|---|---|
| CZT HV Monitor | 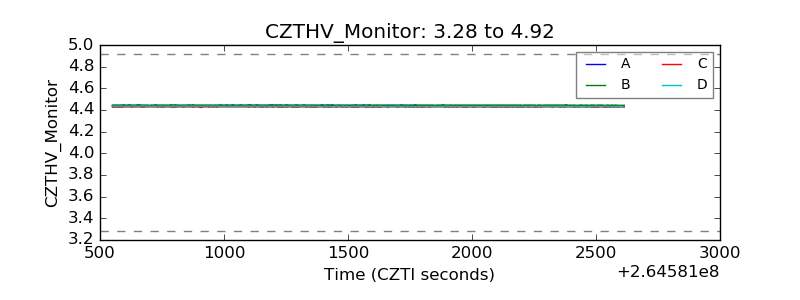 |
| D_VDD | 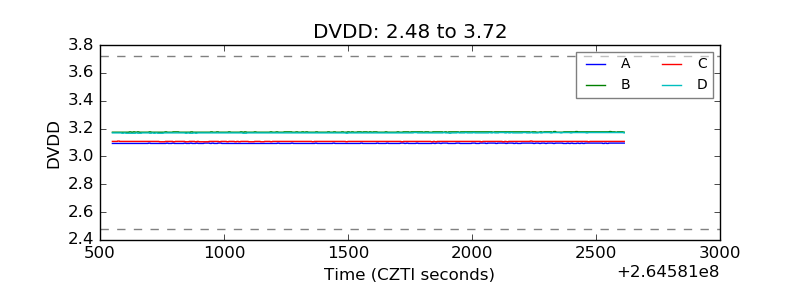 |
| Temperature 1 | 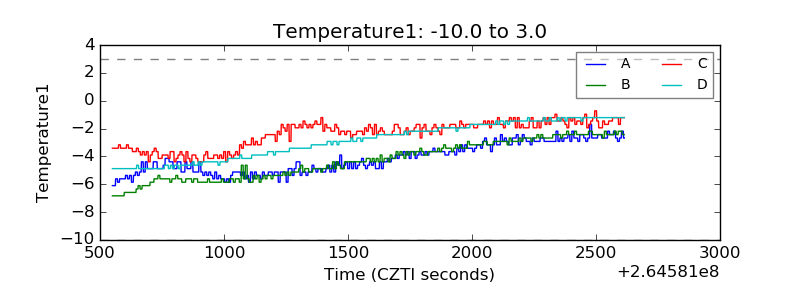 |
| Veto HV Monitor | 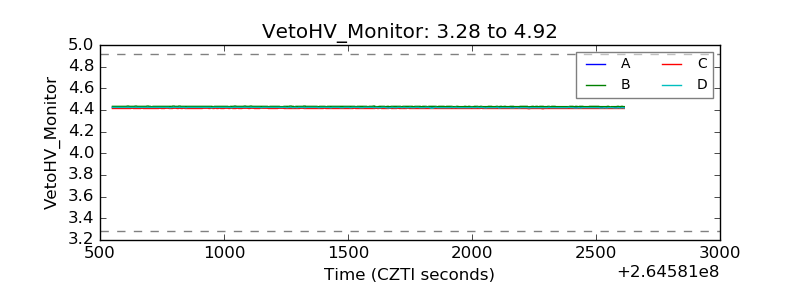 |
| Veto LLD | 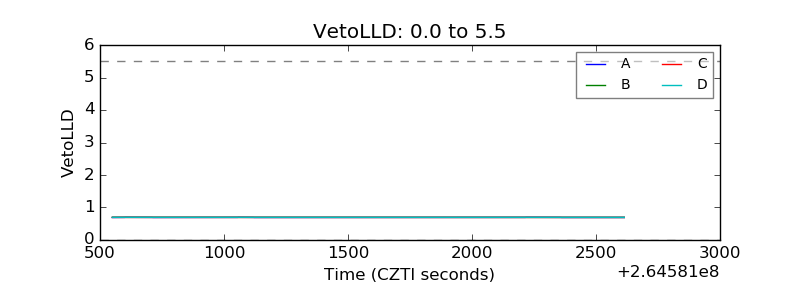 |
| Alpha Counter | 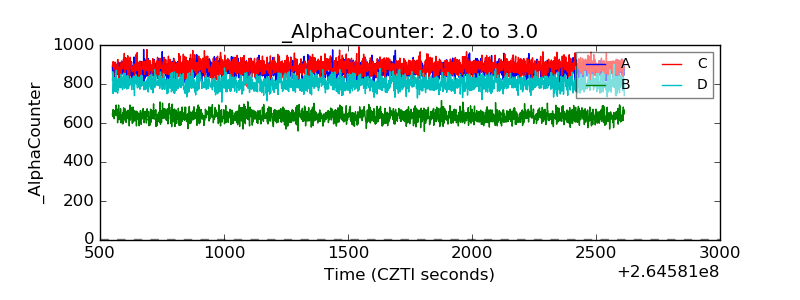 |
| _CPM_Rate | 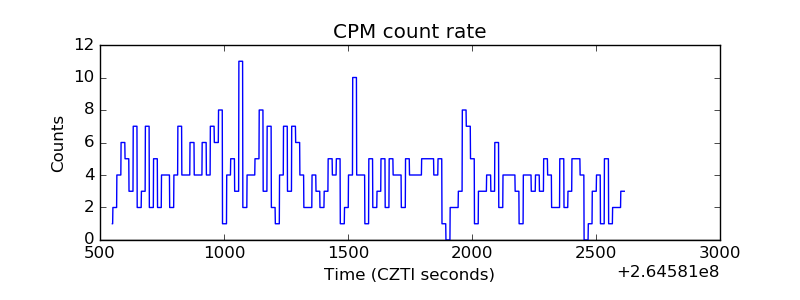 |
| CZT Counter | 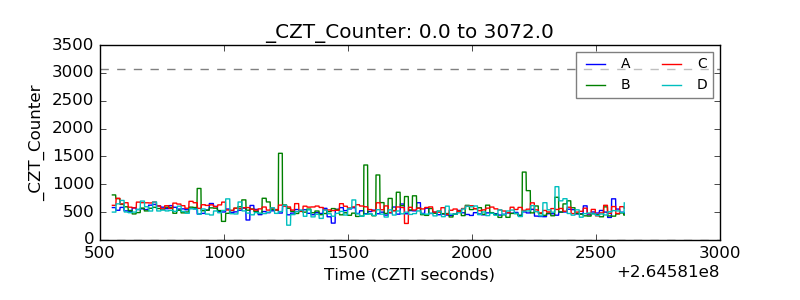 |
| +2.5 Volts monitor |  |
| +5 Volts monitor |  |
| _ROLL_ROT | 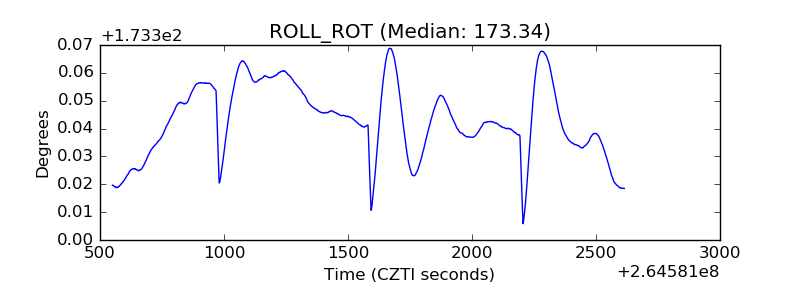 |
| _Roll_DEC | 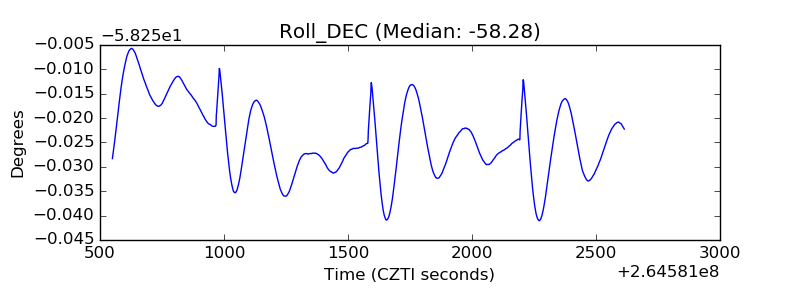 |
| _Roll_RA | 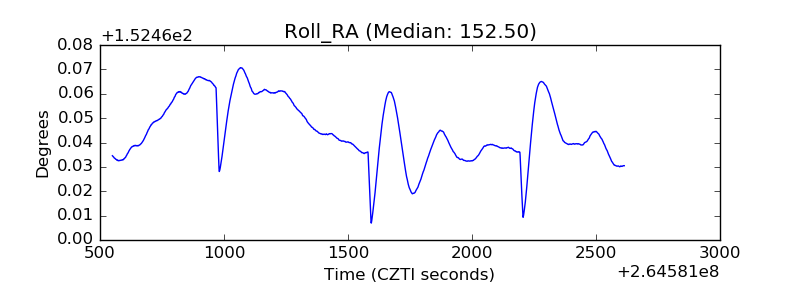 |
| Veto Counter | 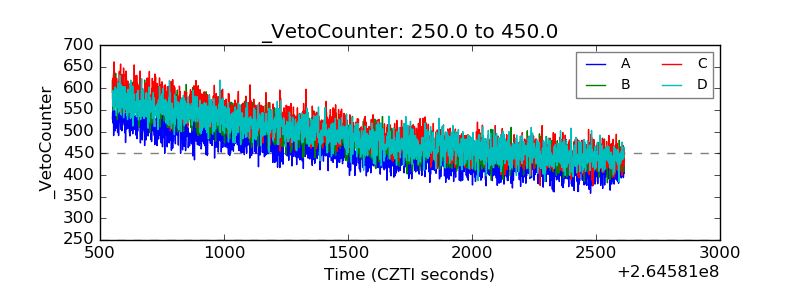 |