| Param | Original file | Final file |
|---|---|---|
| Filename | modeM0/AS1A04_130T03_9000002108_14301cztM0_level2.evt | modeM0/AS1A04_130T03_9000002108_14301cztM0_level2_quad_clean.evt |
| Size (bytes) | 235,128,960 | 54,558,720 |
| Size | 224.2 MB | 52.0 MB |
| Events in quadrant A | 1,643,946 | 365,338 |
| Events in quadrant B | 1,782,642 | 368,160 |
| Events in quadrant C | 1,743,212 | 354,088 |
| Events in quadrant D | 1,745,116 | 350,088 |
| Mode M9 | |||
|---|---|---|---|
| Quadrant | BADHDUFLAG | Total packets | Discarded packets |
| A | 0 | 13 | 0 |
| B | 0 | 13 | 0 |
| C | 0 | 13 | 0 |
| D | 0 | 13 | 0 |
| Mode SS | |||
|---|---|---|---|
| Quadrant | BADHDUFLAG | Total packets | Discarded packets |
| A | 0 | 60 | 0 |
| B | 0 | 60 | 0 |
| C | 0 | 60 | 0 |
| D | 0 | 60 | 0 |
| Mode M0 | |||
|---|---|---|---|
| Quadrant | BADHDUFLAG | Total packets | Discarded packets |
| A | 0 | 6601 | 2 |
| B | 0 | 7108 | 1 |
| C | 0 | 6882 | 1 |
| D | 0 | 7004 | 1 |
| Quadrant | Total seconds | Saturated seconds | Saturation percentage |
|---|---|---|---|
| A | 3014 | 65 | 2.156603% |
| B | 3014 | 90 | 2.986065% |
| C | 3014 | 50 | 1.658925% |
| D | 3014 | 62 | 2.057067% |
Noise dominated data is calculated using 1-second bins in cleaned event files. If a bin has >2000 counts, and if more than 50% of those come from <1% of pixels, then it is considered to be noise-dominated and hence unusable.
| Quadrant | # 1 sec bins | Bins with >0 counts | Bins with >2000 counts | High rate bins dominated by noise | Noise dominated (total time) | Noise dominated (detector-on time) | Marked lightcurve |
|---|---|---|---|---|---|---|---|
| A | 4270 | 3016 | 1 | 1 | 0.02% | 0.03% | 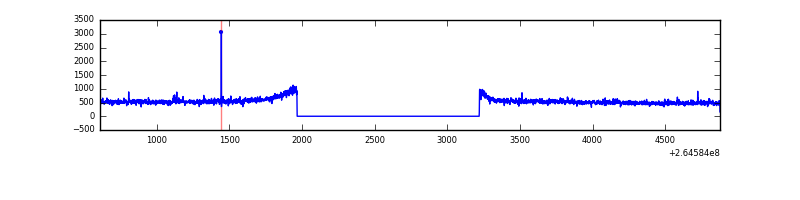 |
| B | 4270 | 3016 | 10 | 10 | 0.23% | 0.33% | 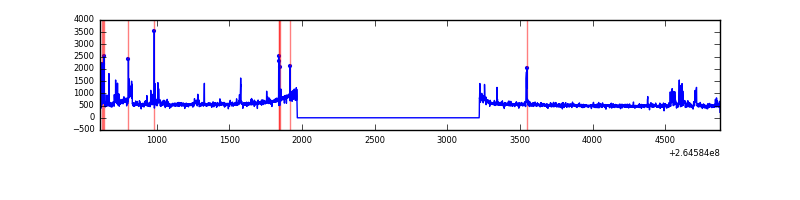 |
| C | 4270 | 3016 | 0 | 0 | 0.00% | 0.00% | 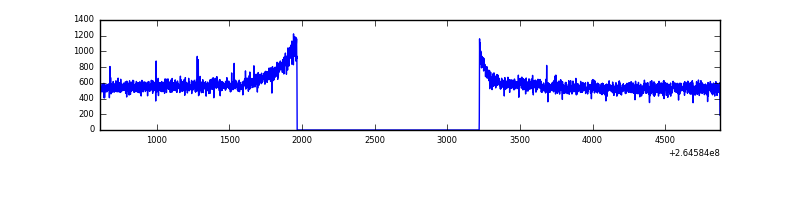 |
| D | 4270 | 3016 | 14 | 14 | 0.33% | 0.46% | 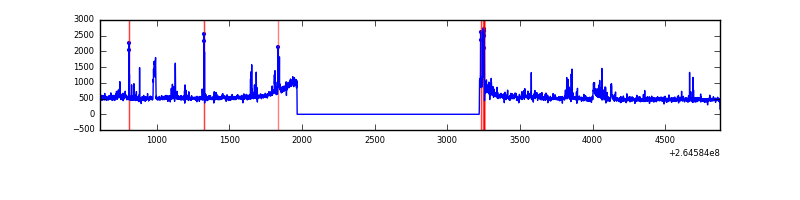 |
Top three noisy pixels from each quadrant. If the there are fewer than three noisy pixels in the level2.evt file, extra rows are filled as -1
| Pixel properties | Quadrant properties | ||||||
|---|---|---|---|---|---|---|---|
| Quadrant | DetID | PixID | Counts | Sigma | Mean | Median | Sigma |
| A | 12 | 189 | 26700 | 307.74 | 417 | 409 | 85.4 |
| A | 8 | 15 | 9089 | 101.6 | 417 | 409 | 85.4 |
| A | 0 | 226 | 3817 | 39.89 | 417 | 409 | 85.4 |
| B | 0 | 229 | 66977 | 829.01 | 412 | 402 | 80.3 |
| B | 10 | 245 | 38412 | 473.31 | 412 | 402 | 80.3 |
| B | 0 | 189 | 21415 | 261.66 | 412 | 402 | 80.3 |
| C | 3 | 233 | 167861 | 1782.04 | 403 | 405 | 94.0 |
| C | 13 | 61 | 2793 | 25.41 | 403 | 405 | 94.0 |
| C | 10 | 22 | 2778 | 25.25 | 403 | 405 | 94.0 |
| D | 5 | 222 | 54700 | 557.58 | 406 | 397 | 97.4 |
| D | 10 | 199 | 52245 | 532.37 | 406 | 397 | 97.4 |
| D | 12 | 110 | 31903 | 323.5 | 406 | 397 | 97.4 |
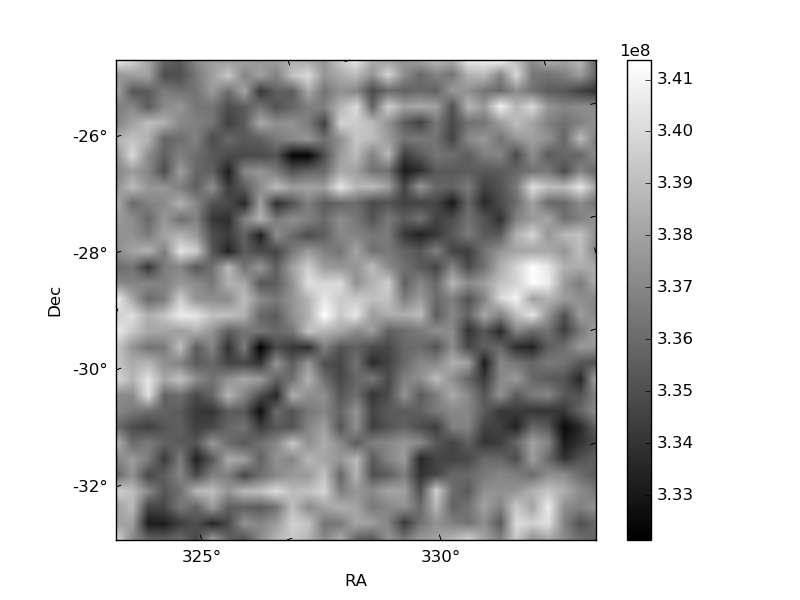
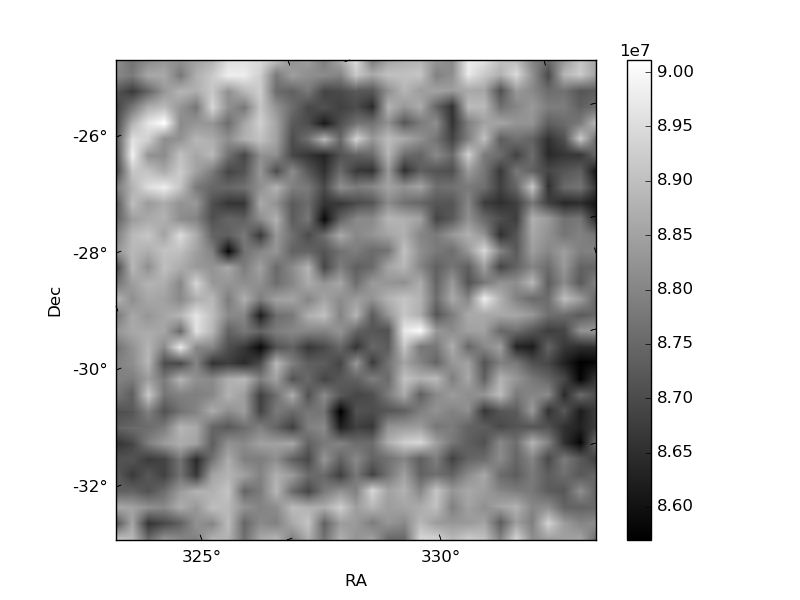
Histogram calculated using DETX and DETY for each event in the final _common_clean file
| Quadrant A | 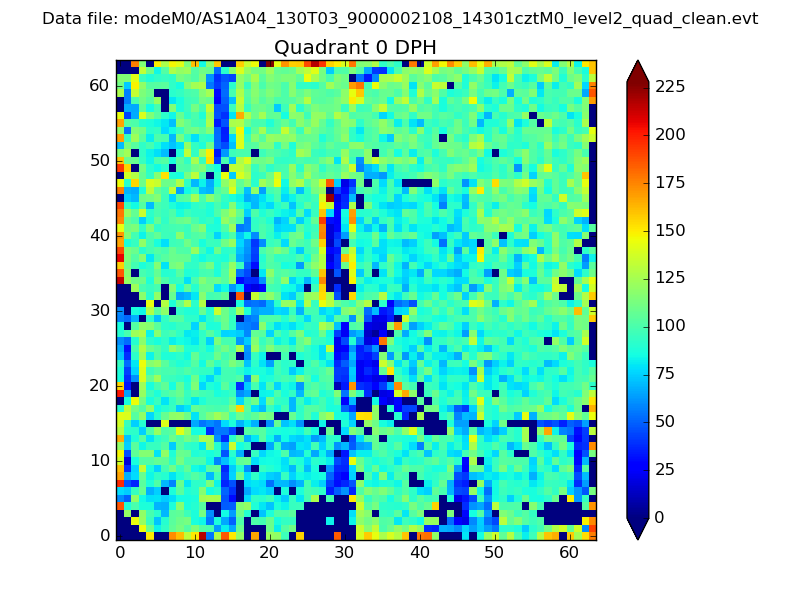 |
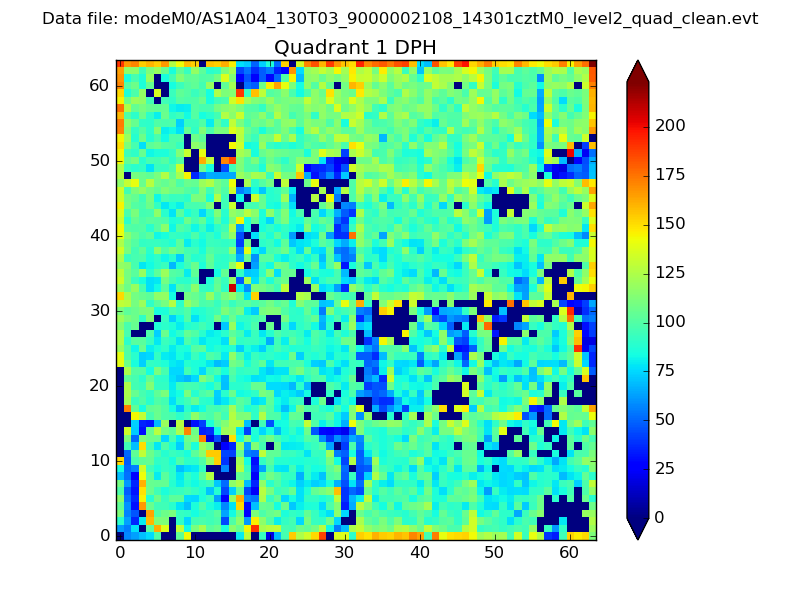 |
Quadrant B |
|---|---|---|---|
| Quadrant D | 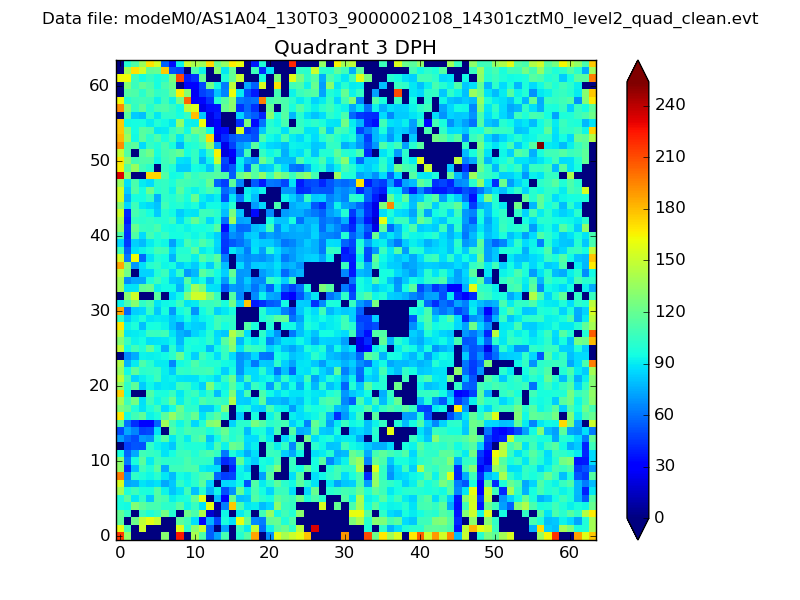 |
 |
Quadrant C |
| Plot type | Count rate plots | Images |
|---|---|---|
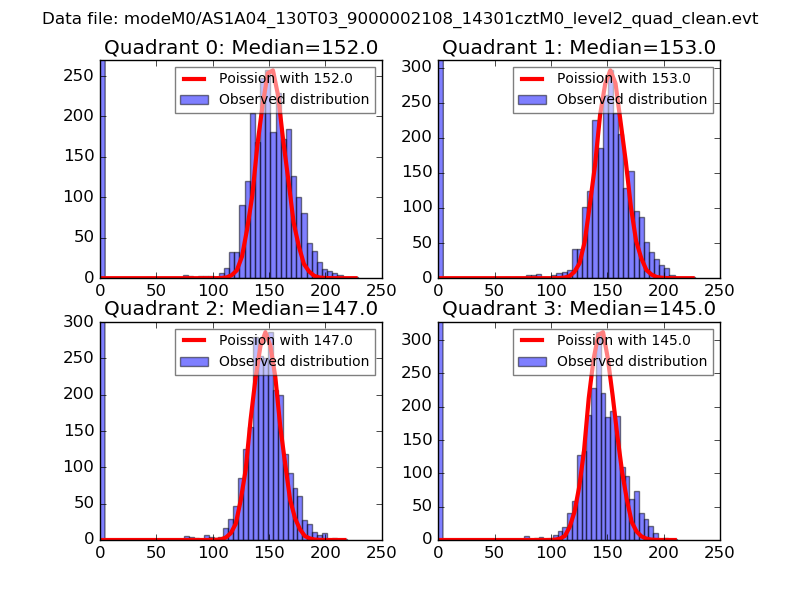
| Comparison with Poisson distribution Blue bars denote a histogram of data divided into 1 sec bins. Red curve is a Poisson curve with rate = median count rate of data. |
 |
 |
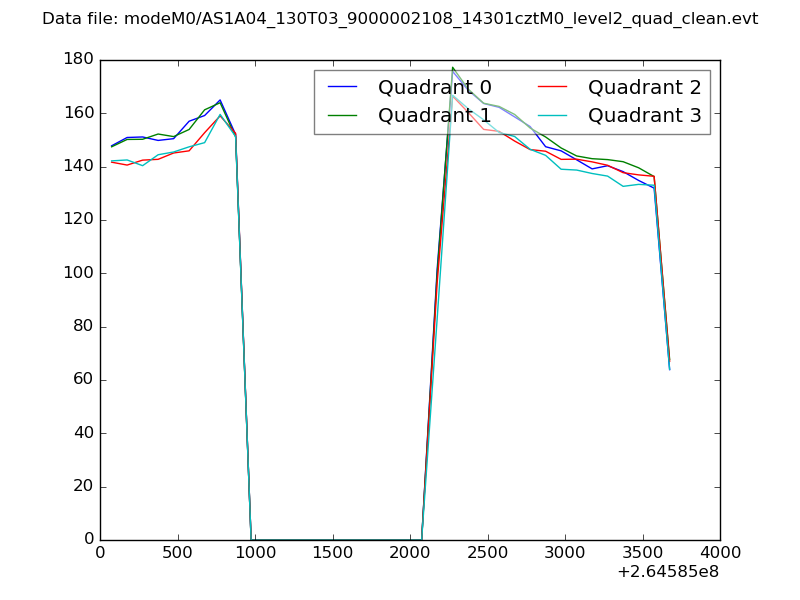
| Quadrant-wise count rates Data is divided into 100 sec bins |
 |
|
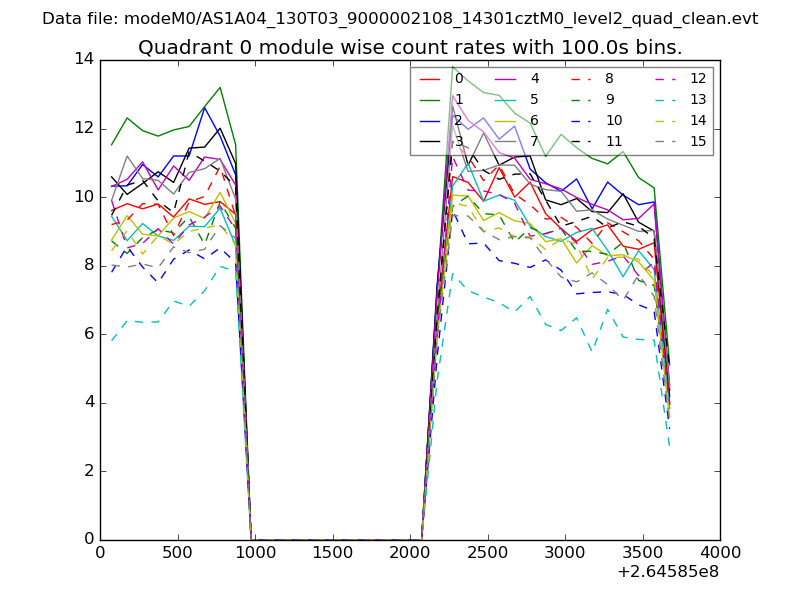
| Module-wise count rates for Quadrant A Data is divided into 100 sec bins |
 |
 |
| Module-wise count rates for Quadrant B Data is divided into 100 sec bins |
 |
 |
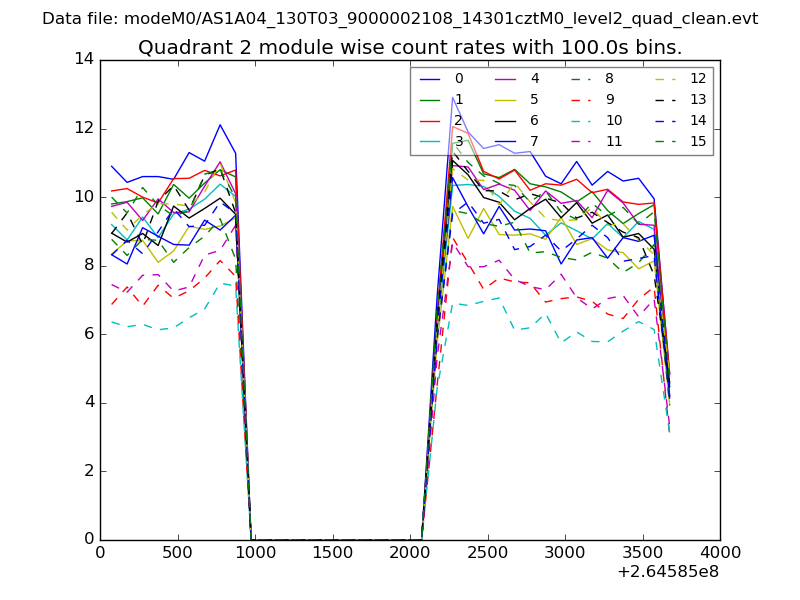
| Module-wise count rates for Quadrant C Data is divided into 100 sec bins |
 |
 |
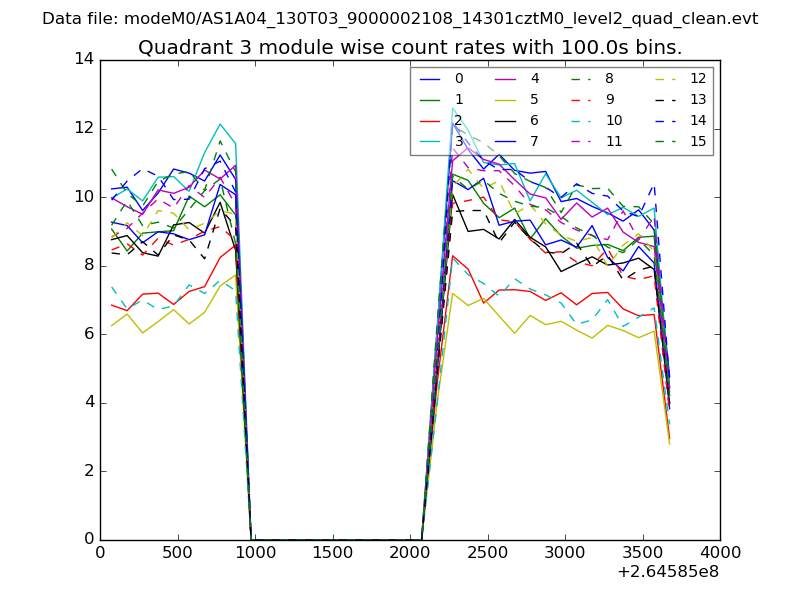
| Module-wise count rates for Quadrant D Data is divided into 100 sec bins |
 |
 |
| Parameter | Plot |
|---|---|
| CZT HV Monitor | 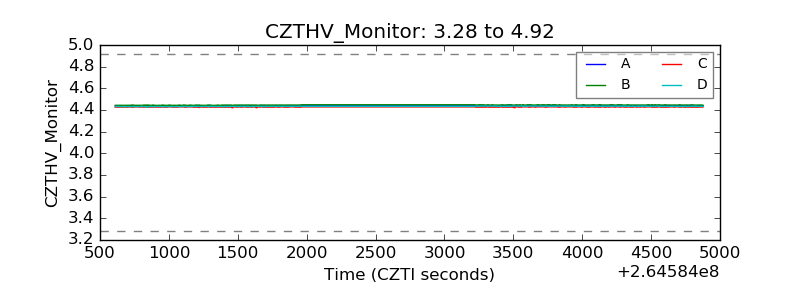 |
| D_VDD | 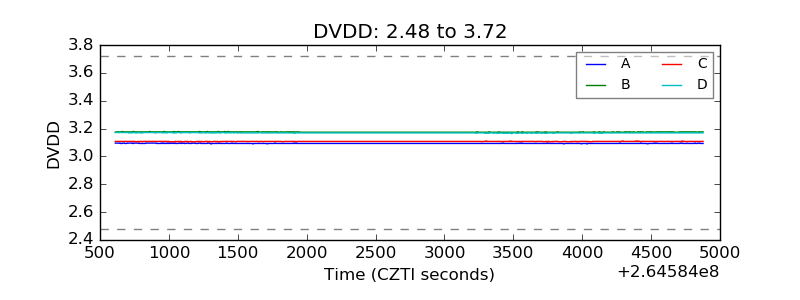 |
| Temperature 1 |  |
| Veto HV Monitor | 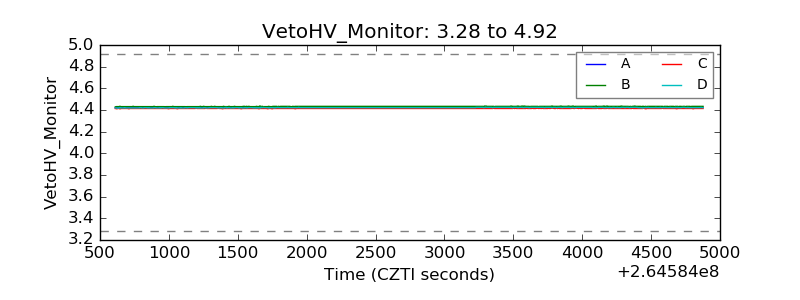 |
| Veto LLD |  |
| Alpha Counter | 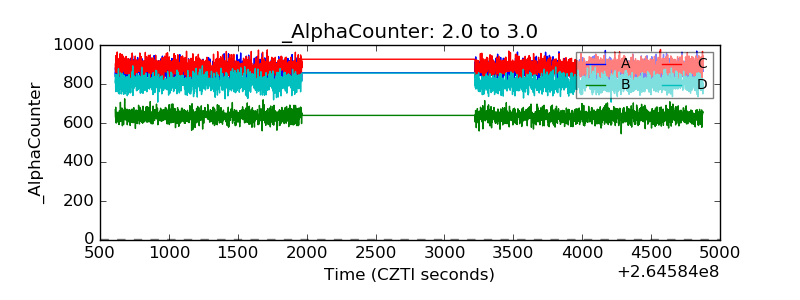 |
| _CPM_Rate | 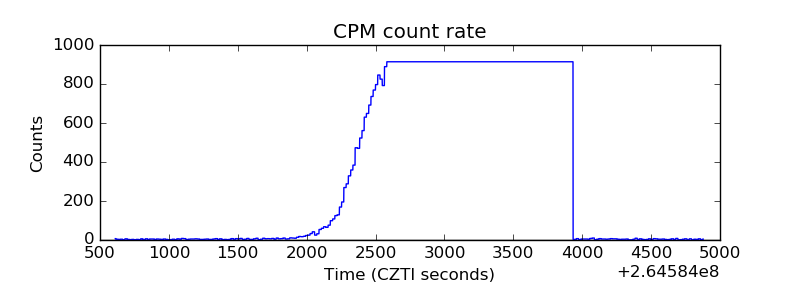 |
| CZT Counter | 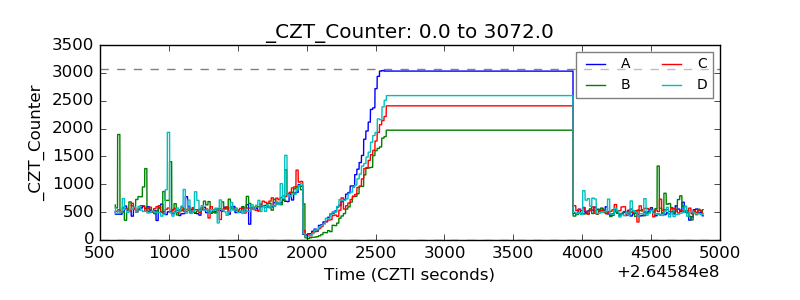 |
| +2.5 Volts monitor |  |
| +5 Volts monitor |  |
| _ROLL_ROT | 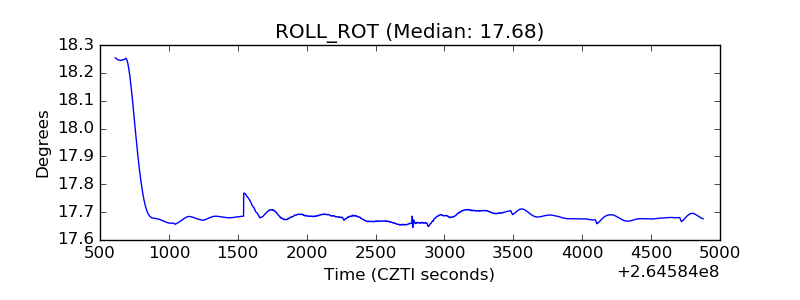 |
| _Roll_DEC | 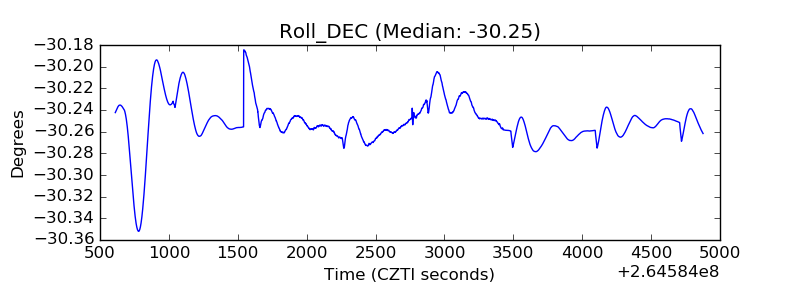 |
| _Roll_RA | 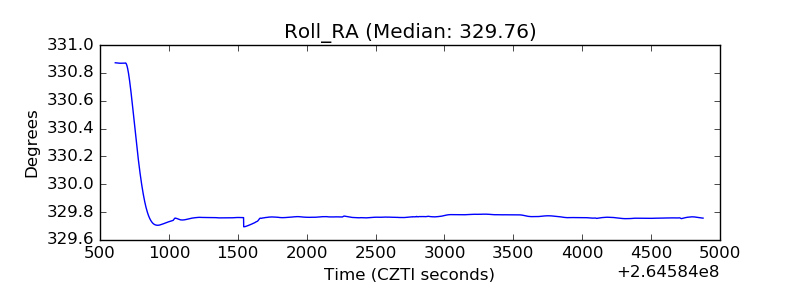 |
| Veto Counter | 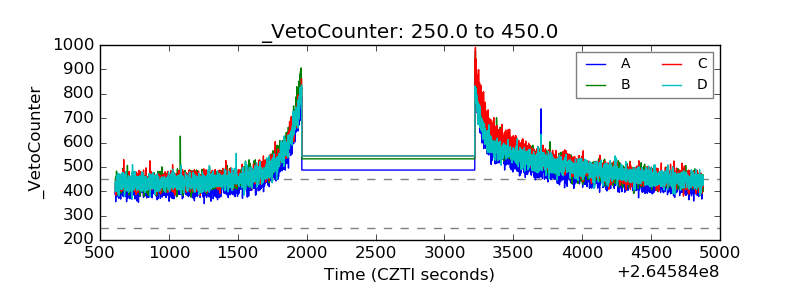 |