| Param | Original file | Final file |
|---|---|---|
| Filename | modeM0/AS1A04_130T03_9000002108_14303cztM0_level2.evt | modeM0/AS1A04_130T03_9000002108_14303cztM0_level2_quad_clean.evt |
| Size (bytes) | 529,202,880 | 87,586,560 |
| Size | 504.7 MB | 83.5 MB |
| Events in quadrant A | 3,511,342 | 551,009 |
| Events in quadrant B | 4,034,336 | 550,008 |
| Events in quadrant C | 3,702,159 | 535,643 |
| Events in quadrant D | 4,297,475 | 521,042 |
| Mode M9 | |||
|---|---|---|---|
| Quadrant | BADHDUFLAG | Total packets | Discarded packets |
| A | 0 | 8 | 0 |
| B | 0 | 8 | 0 |
| C | 0 | 8 | 0 |
| D | 0 | 9 | 0 |
| Mode SS | |||
|---|---|---|---|
| Quadrant | BADHDUFLAG | Total packets | Discarded packets |
| A | 0 | 146 | 0 |
| B | 0 | 146 | 0 |
| C | 0 | 146 | 0 |
| D | 0 | 146 | 0 |
| Mode M0 | |||
|---|---|---|---|
| Quadrant | BADHDUFLAG | Total packets | Discarded packets |
| A | 0 | 14743 | 3 |
| B | 0 | 16353 | 2 |
| C | 0 | 14844 | 2 |
| D | 0 | 17387 | 2 |
| Quadrant | Total seconds | Saturated seconds | Saturation percentage |
|---|---|---|---|
| A | 7090 | 156 | 2.200282% |
| B | 7090 | 226 | 3.187588% |
| C | 7090 | 100 | 1.410437% |
| D | 7090 | 255 | 3.596615% |
Noise dominated data is calculated using 1-second bins in cleaned event files. If a bin has >2000 counts, and if more than 50% of those come from <1% of pixels, then it is considered to be noise-dominated and hence unusable.
| Quadrant | # 1 sec bins | Bins with >0 counts | Bins with >2000 counts | High rate bins dominated by noise | Noise dominated (total time) | Noise dominated (detector-on time) | Marked lightcurve |
|---|---|---|---|---|---|---|---|
| A | 7831 | 7091 | 1 | 1 | 0.01% | 0.01% | 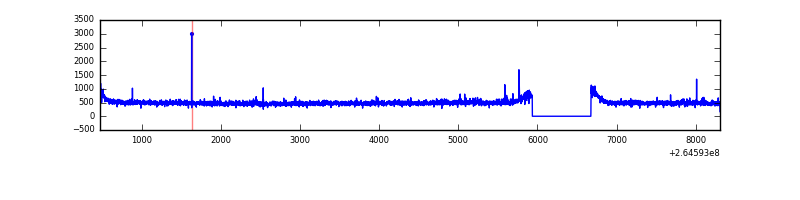 |
| B | 7831 | 7091 | 36 | 36 | 0.46% | 0.51% | 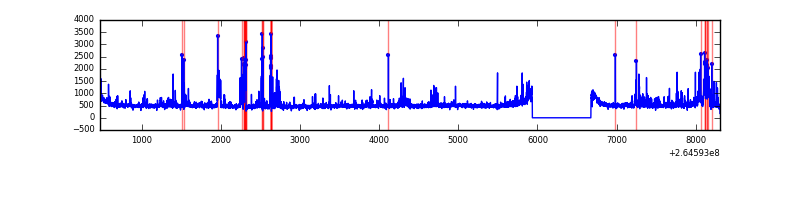 |
| C | 7831 | 7091 | 0 | 0 | 0.00% | 0.00% | 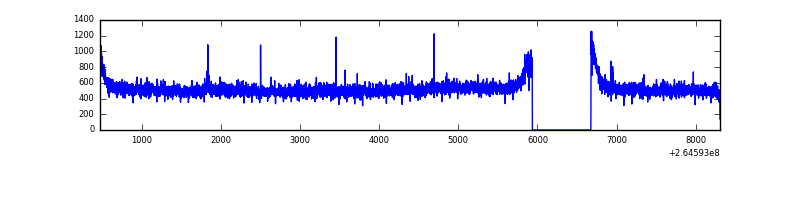 |
| D | 7831 | 7091 | 65 | 65 | 0.83% | 0.92% | 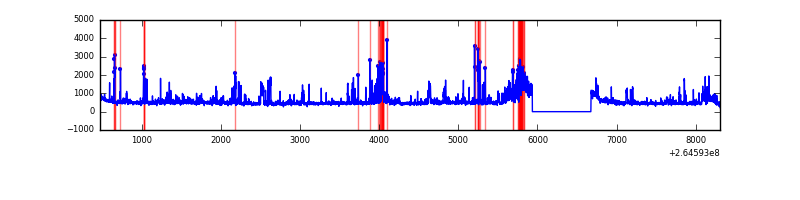 |
Top three noisy pixels from each quadrant. If the there are fewer than three noisy pixels in the level2.evt file, extra rows are filled as -1
| Pixel properties | Quadrant properties | ||||||
|---|---|---|---|---|---|---|---|
| Quadrant | DetID | PixID | Counts | Sigma | Mean | Median | Sigma |
| A | 8 | 15 | 49488 | 269.33 | 887 | 866 | 180.5 |
| A | 12 | 189 | 43045 | 233.64 | 887 | 866 | 180.5 |
| A | 0 | 226 | 8160 | 40.4 | 887 | 866 | 180.5 |
| B | 0 | 229 | 469430 | 2808.05 | 873 | 851 | 166.9 |
| B | 10 | 245 | 48131 | 283.33 | 873 | 851 | 166.9 |
| B | 0 | 189 | 35138 | 205.47 | 873 | 851 | 166.9 |
| C | 3 | 233 | 364254 | 1819.29 | 855 | 857 | 199.7 |
| C | 13 | 61 | 6226 | 26.88 | 855 | 857 | 199.7 |
| C | 10 | 22 | 5939 | 25.44 | 855 | 857 | 199.7 |
| D | 13 | 122 | 342361 | 1687.32 | 854 | 833 | 202.4 |
| D | 5 | 222 | 304844 | 1501.97 | 854 | 833 | 202.4 |
| D | 12 | 110 | 164435 | 808.28 | 854 | 833 | 202.4 |
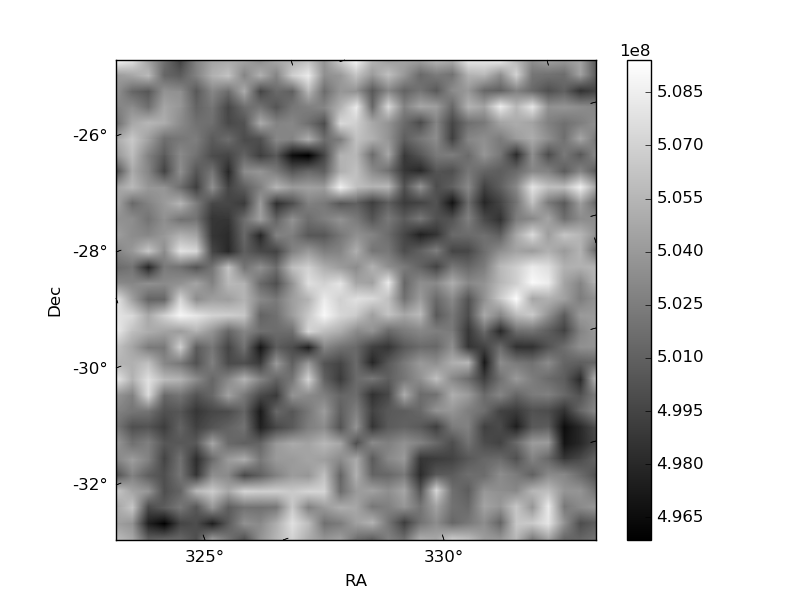
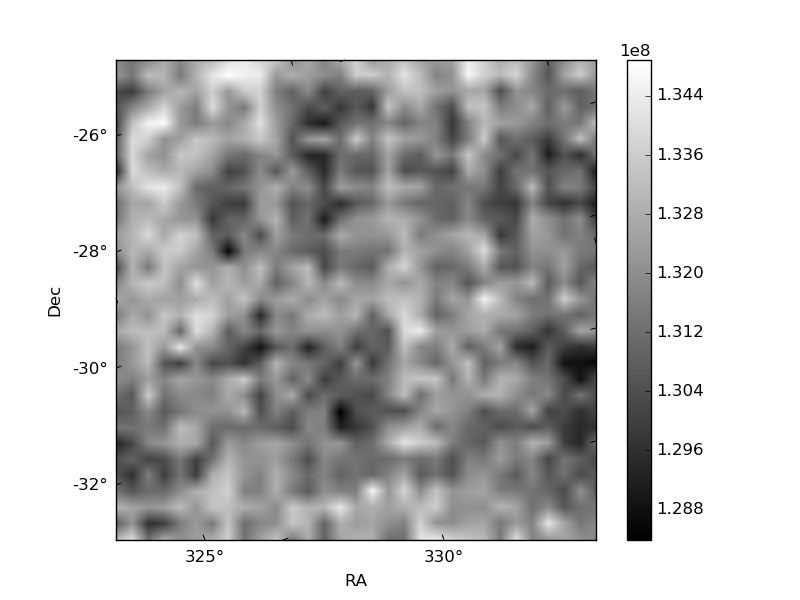
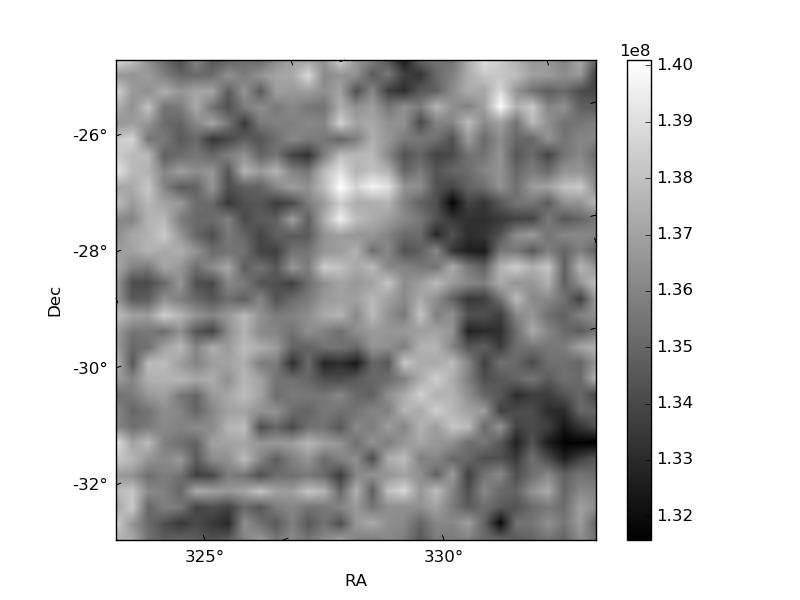
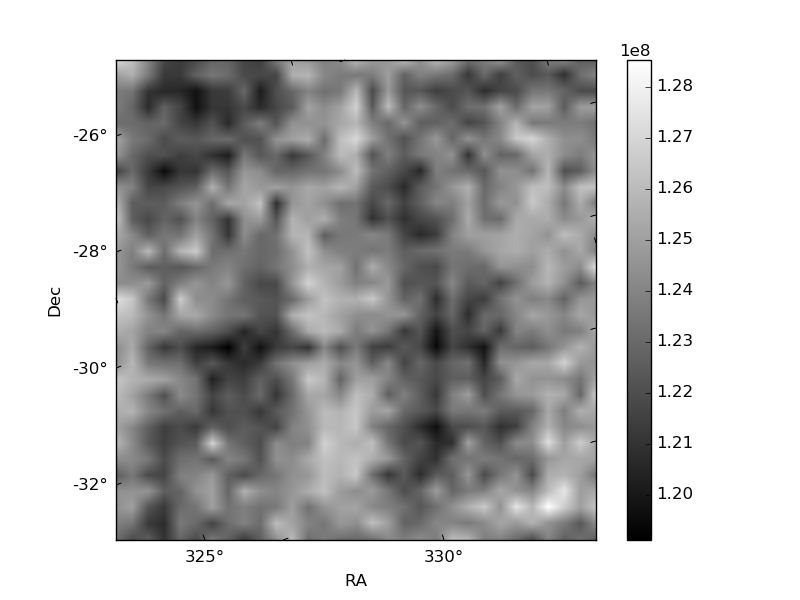
Histogram calculated using DETX and DETY for each event in the final _common_clean file
| Quadrant A | 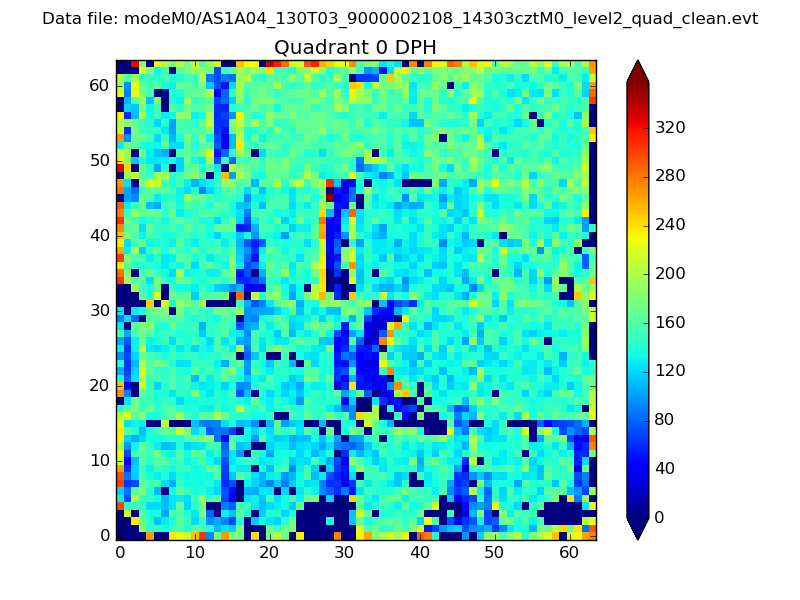 |
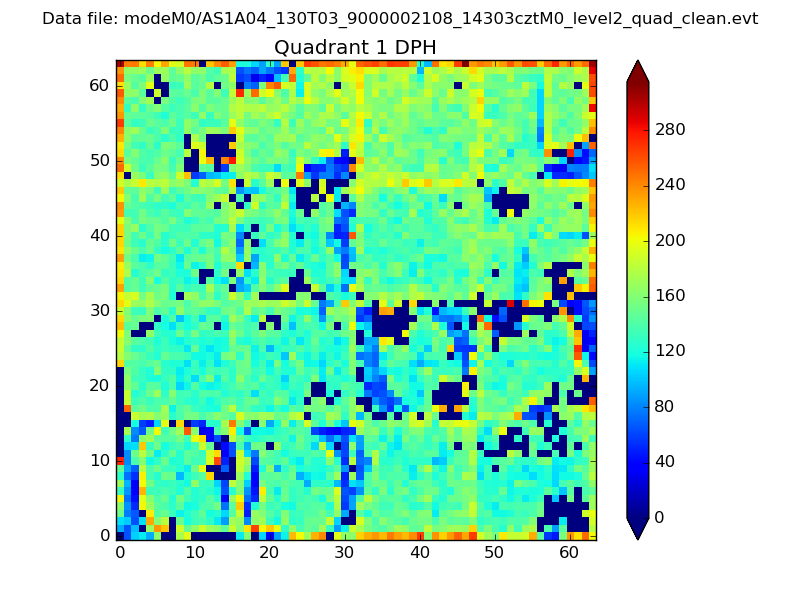 |
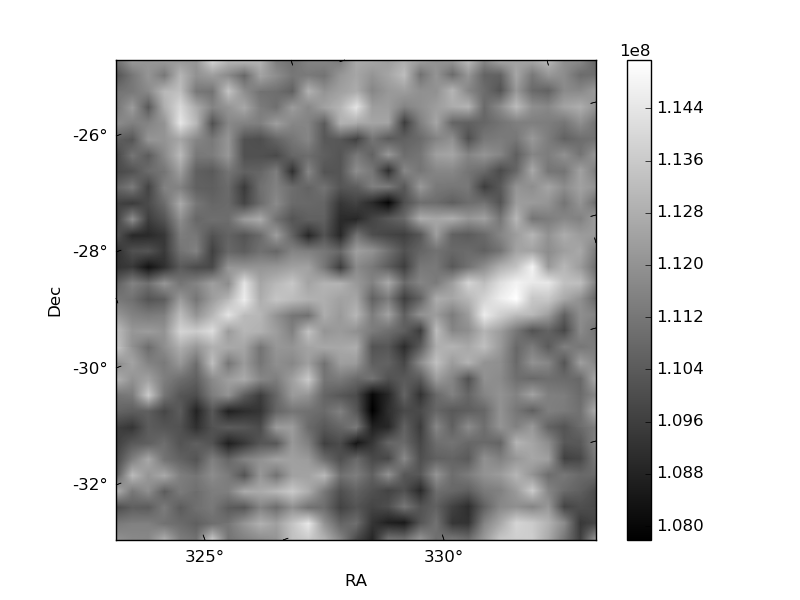
Quadrant B |
|---|---|---|---|
| Quadrant D | 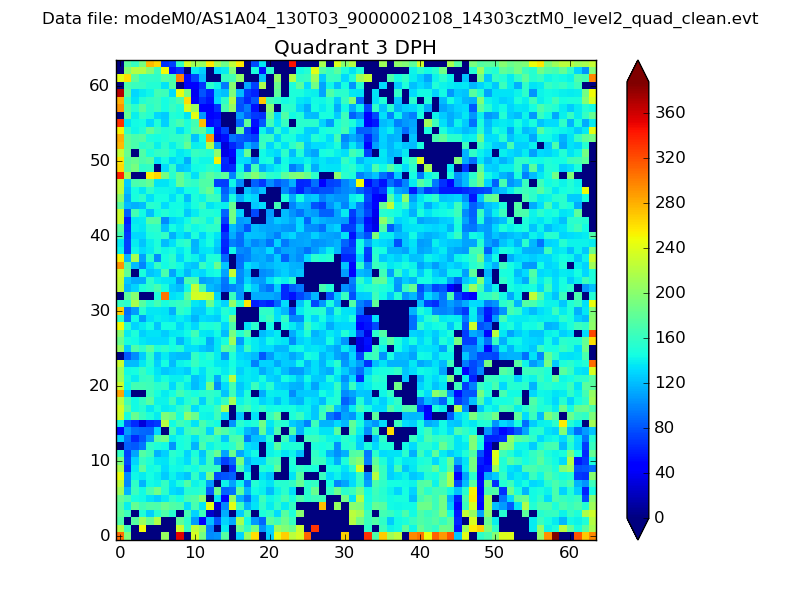 |
 |
Quadrant C |
| Plot type | Count rate plots | Images |
|---|---|---|
| Comparison with Poisson distribution Blue bars denote a histogram of data divided into 1 sec bins. Red curve is a Poisson curve with rate = median count rate of data. |
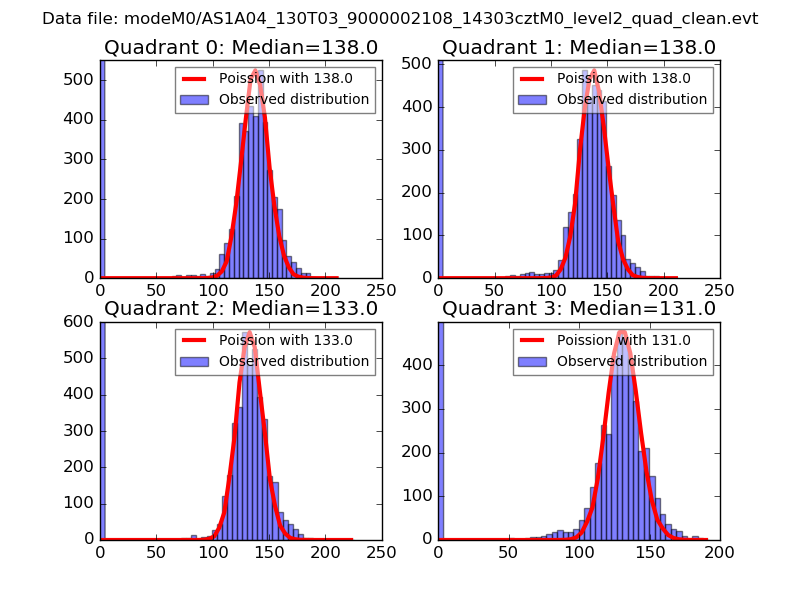 |
 |
| Quadrant-wise count rates Data is divided into 100 sec bins |
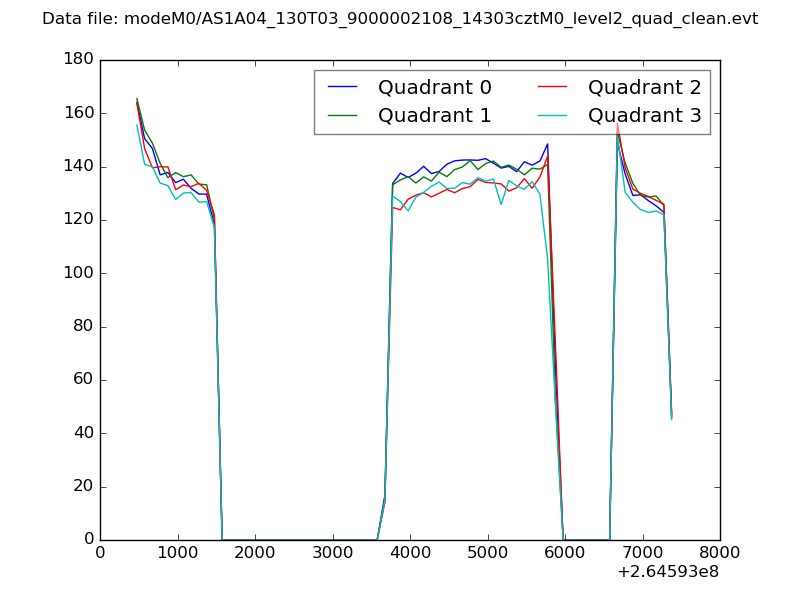 |
|
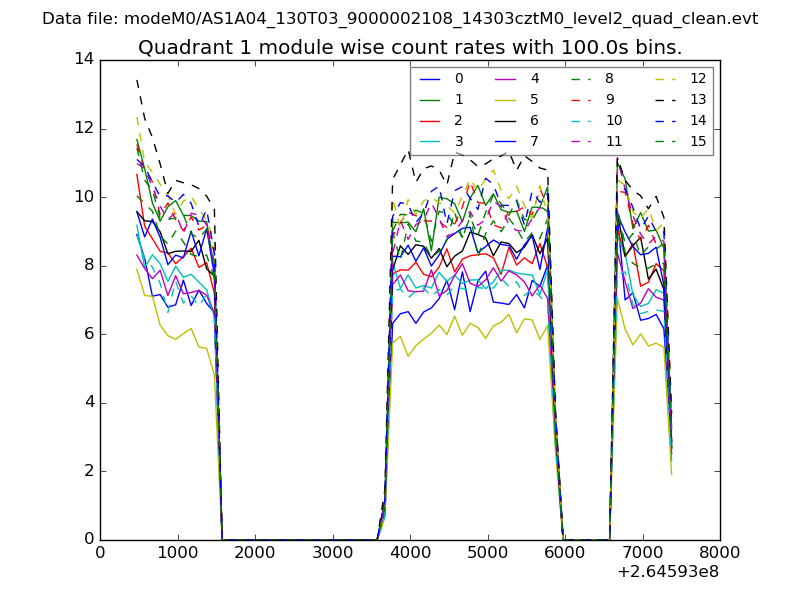
| Module-wise count rates for Quadrant A Data is divided into 100 sec bins |
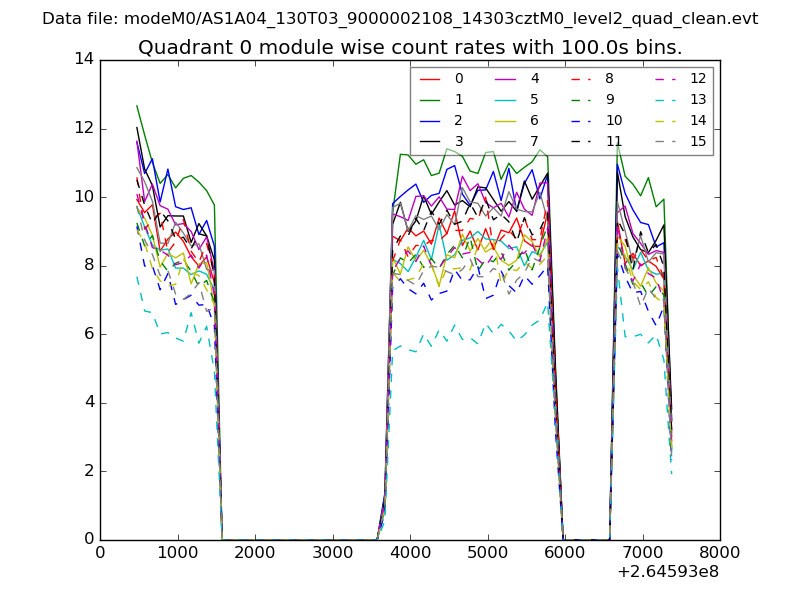 |
 |
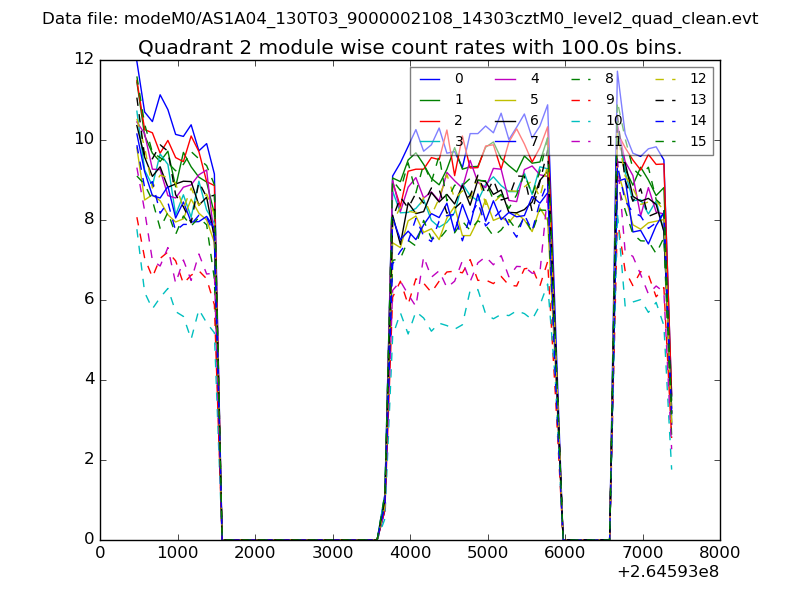
| Module-wise count rates for Quadrant B Data is divided into 100 sec bins |
 |
 |
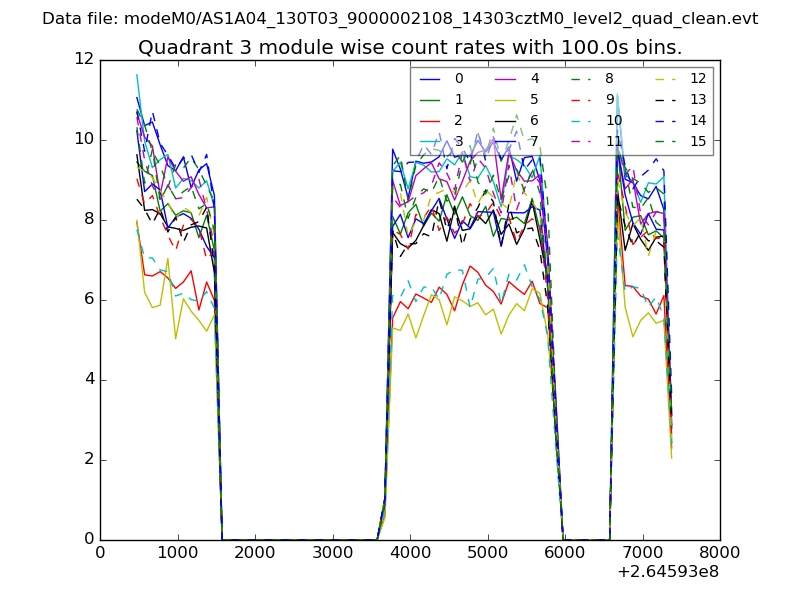
| Module-wise count rates for Quadrant C Data is divided into 100 sec bins |
 |
 |
| Module-wise count rates for Quadrant D Data is divided into 100 sec bins |
 |
 |
| Parameter | Plot |
|---|---|
| CZT HV Monitor | 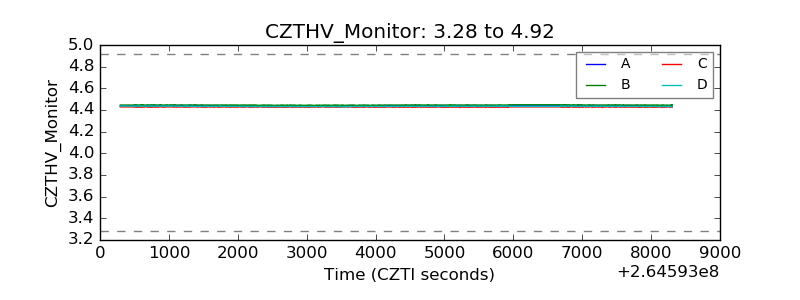 |
| D_VDD | 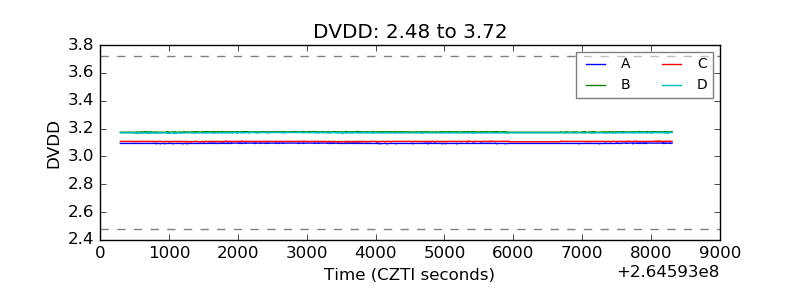 |
| Temperature 1 | 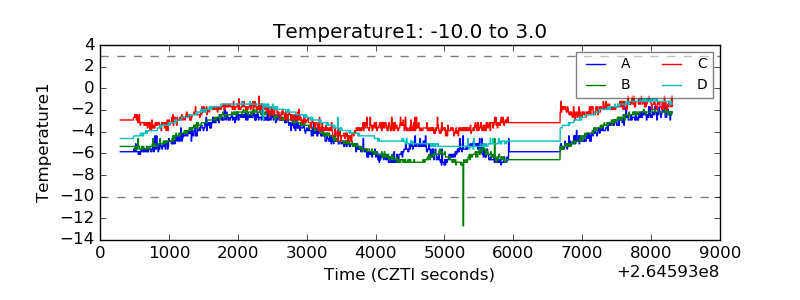 |
| Veto HV Monitor | 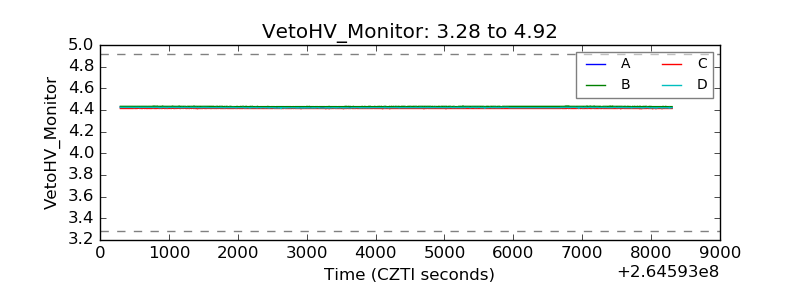 |
| Veto LLD | 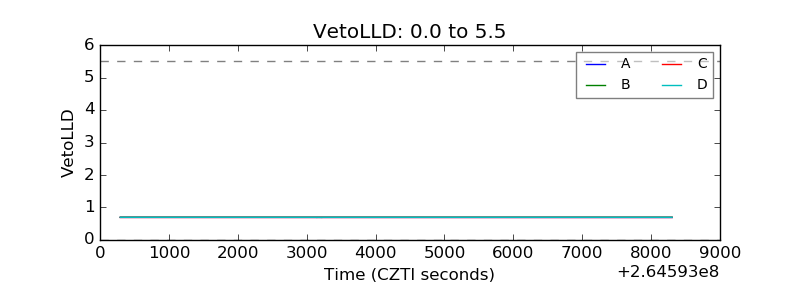 |
| Alpha Counter | 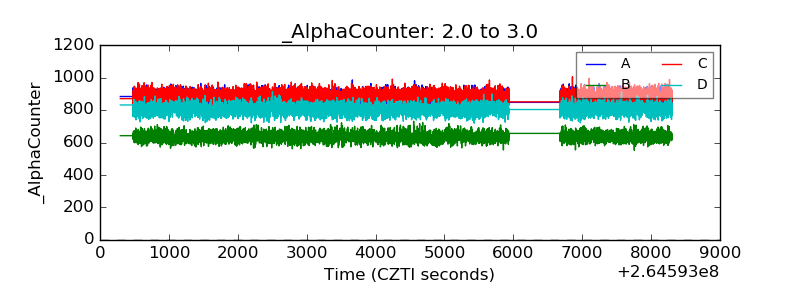 |
| _CPM_Rate | 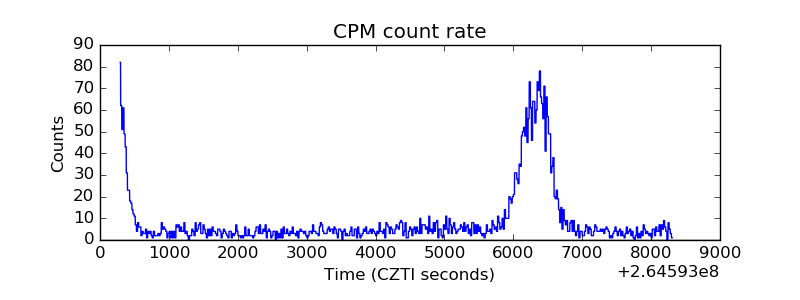 |
| CZT Counter | 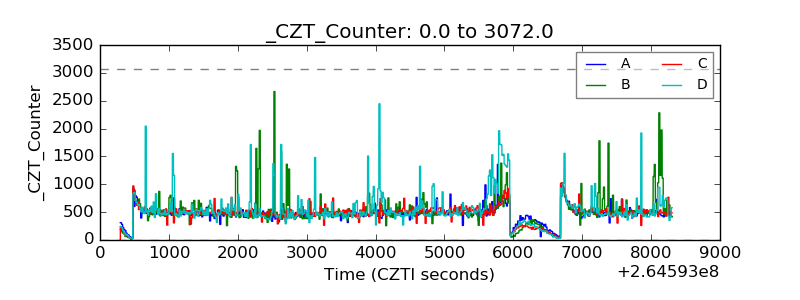 |
| +2.5 Volts monitor | 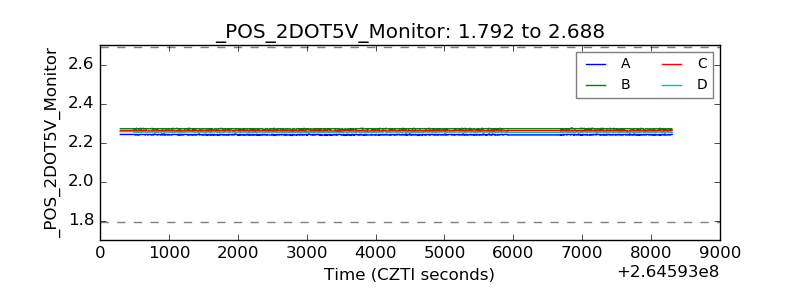 |
| +5 Volts monitor |  |
| _ROLL_ROT |  |
| _Roll_DEC | 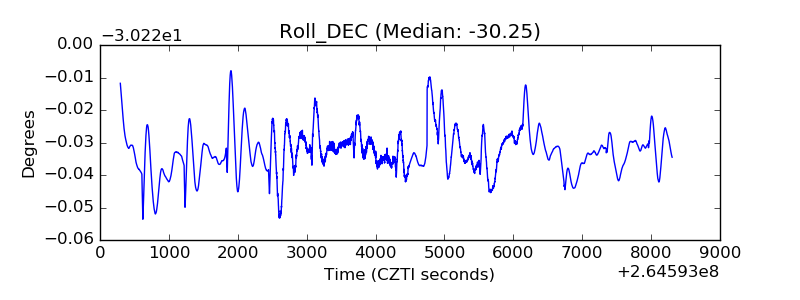 |
| _Roll_RA | 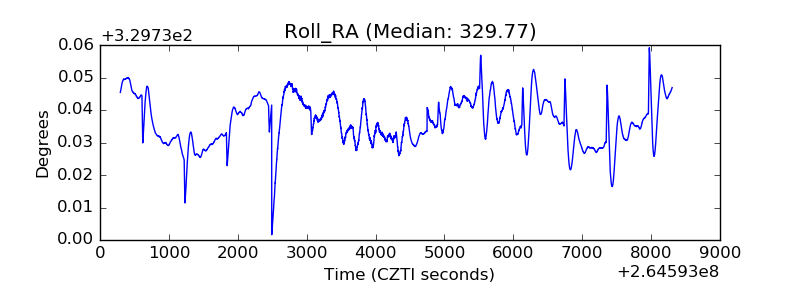 |
| Veto Counter |  |