| Param | Original file | Final file |
|---|---|---|
| Filename | modeM0/AS1A04_130T03_9000002108_14304cztM0_level2.evt | modeM0/AS1A04_130T03_9000002108_14304cztM0_level2_quad_clean.evt |
| Size (bytes) | 563,296,320 | 88,326,720 |
| Size | 537.2 MB | 84.2 MB |
| Events in quadrant A | 3,946,222 | 546,250 |
| Events in quadrant B | 4,397,568 | 544,781 |
| Events in quadrant C | 4,067,458 | 529,516 |
| Events in quadrant D | 4,134,622 | 527,050 |
| Mode M9 | |||
|---|---|---|---|
| Quadrant | BADHDUFLAG | Total packets | Discarded packets |
| A | 0 | 4 | 0 |
| B | 0 | 4 | 0 |
| C | 0 | 4 | 0 |
| D | 0 | 5 | 0 |
| Mode SS | |||
|---|---|---|---|
| Quadrant | BADHDUFLAG | Total packets | Discarded packets |
| A | 0 | 154 | 0 |
| B | 0 | 154 | 0 |
| C | 0 | 154 | 0 |
| D | 0 | 154 | 0 |
| Mode M0 | |||
|---|---|---|---|
| Quadrant | BADHDUFLAG | Total packets | Discarded packets |
| A | 0 | 16319 | 3 |
| B | 0 | 17829 | 2 |
| C | 0 | 16268 | 2 |
| D | 0 | 17290 | 2 |
| Quadrant | Total seconds | Saturated seconds | Saturation percentage |
|---|---|---|---|
| A | 7568 | 256 | 3.382664% |
| B | 7568 | 325 | 4.294397% |
| C | 7568 | 168 | 2.219873% |
| D | 7568 | 196 | 2.589852% |
Noise dominated data is calculated using 1-second bins in cleaned event files. If a bin has >2000 counts, and if more than 50% of those come from <1% of pixels, then it is considered to be noise-dominated and hence unusable.
| Quadrant | # 1 sec bins | Bins with >0 counts | Bins with >2000 counts | High rate bins dominated by noise | Noise dominated (total time) | Noise dominated (detector-on time) | Marked lightcurve |
|---|---|---|---|---|---|---|---|
| A | 7889 | 7569 | 0 | 0 | 0.00% | 0.00% | 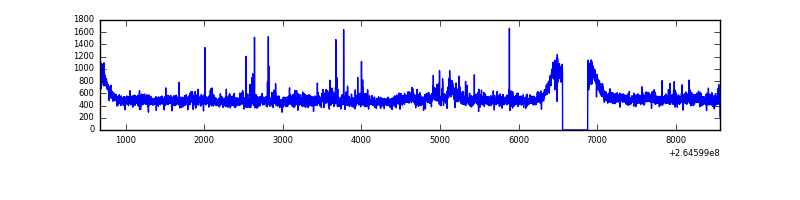 |
| B | 7889 | 7569 | 27 | 27 | 0.34% | 0.36% | 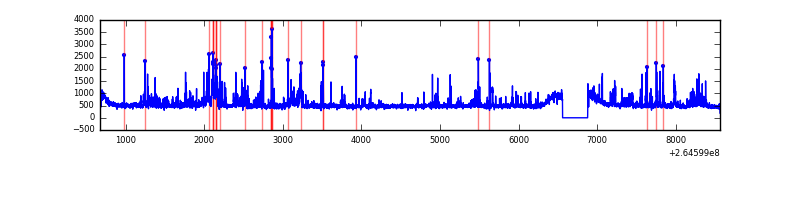 |
| C | 7889 | 7569 | 0 | 0 | 0.00% | 0.00% | 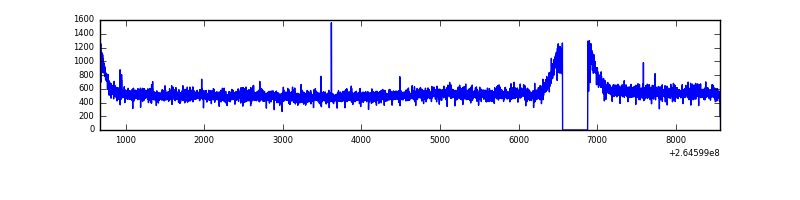 |
| D | 7889 | 7570 | 16 | 16 | 0.20% | 0.21% | 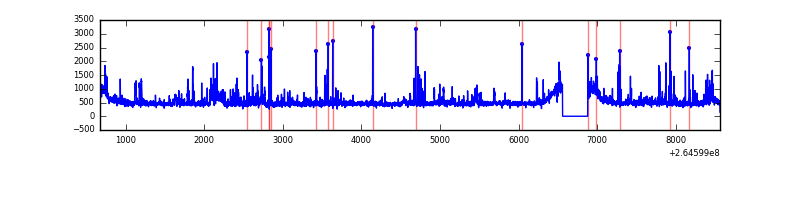 |
Top three noisy pixels from each quadrant. If the there are fewer than three noisy pixels in the level2.evt file, extra rows are filled as -1
| Pixel properties | Quadrant properties | ||||||
|---|---|---|---|---|---|---|---|
| Quadrant | DetID | PixID | Counts | Sigma | Mean | Median | Sigma |
| A | 8 | 15 | 171616 | 866.71 | 952 | 928 | 196.9 |
| A | 12 | 189 | 104302 | 524.91 | 952 | 928 | 196.9 |
| A | 0 | 226 | 8429 | 38.09 | 952 | 928 | 196.9 |
| B | 0 | 229 | 375710 | 2032.25 | 941 | 916 | 184.4 |
| B | 10 | 245 | 174761 | 942.64 | 941 | 916 | 184.4 |
| B | 0 | 189 | 48581 | 258.45 | 941 | 916 | 184.4 |
| C | 3 | 233 | 481621 | 2220.46 | 919 | 922 | 216.5 |
| C | 13 | 61 | 6775 | 27.04 | 919 | 922 | 216.5 |
| C | 14 | 234 | 3602 | 12.38 | 919 | 922 | 216.5 |
| D | 5 | 222 | 261643 | 1178.79 | 925 | 903 | 221.2 |
| D | 12 | 110 | 147576 | 663.1 | 925 | 903 | 221.2 |
| D | 13 | 122 | 101975 | 456.94 | 925 | 903 | 221.2 |
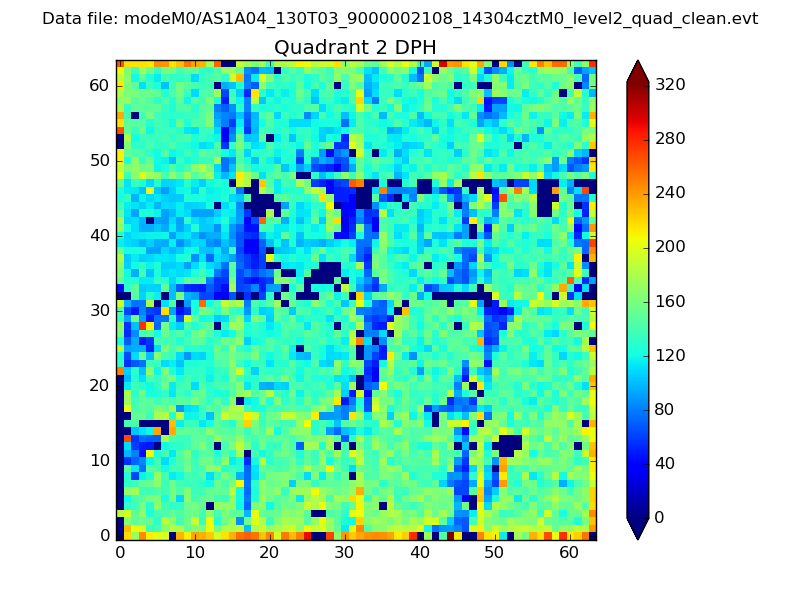
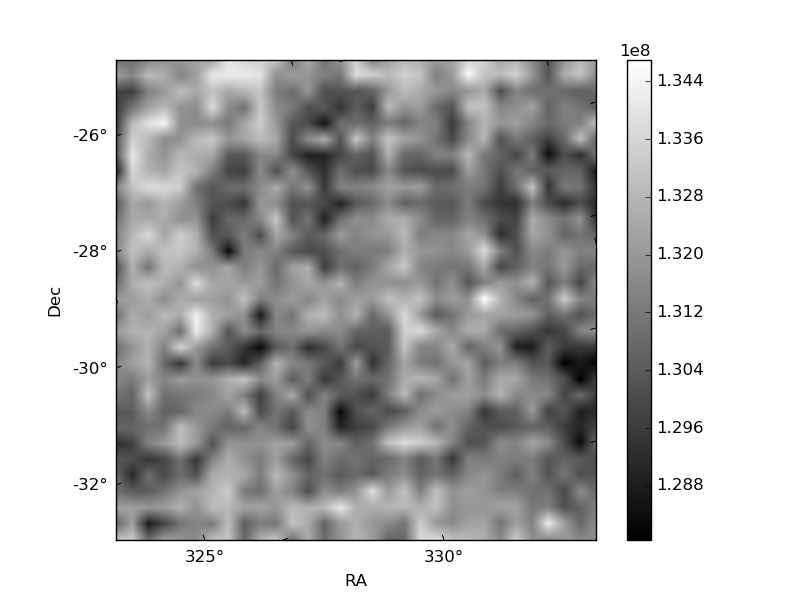
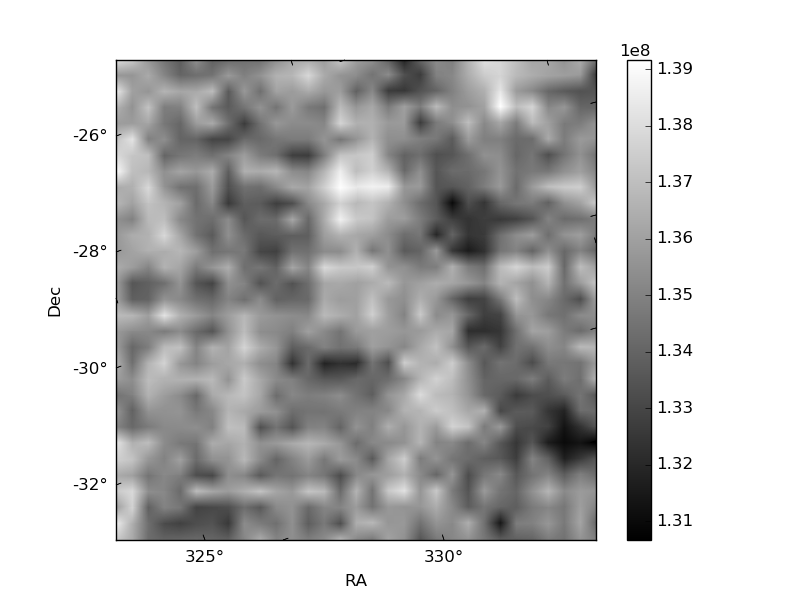
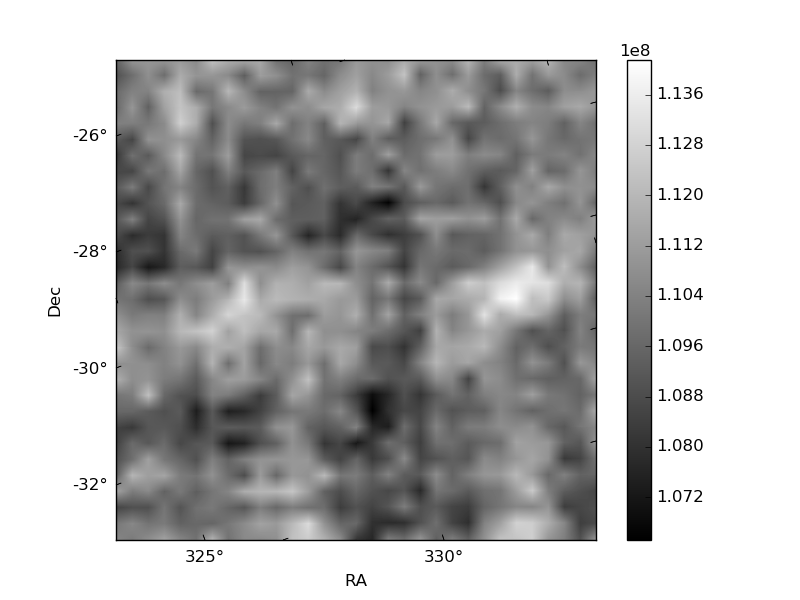
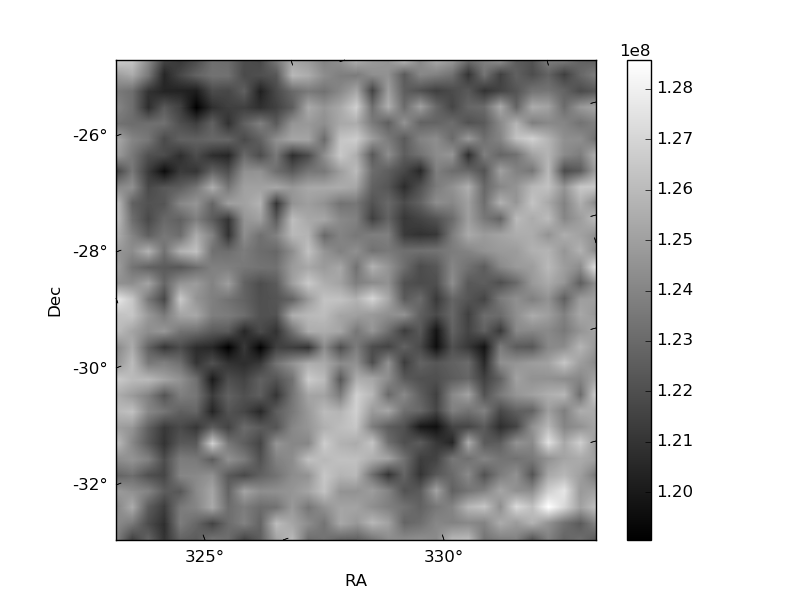
Histogram calculated using DETX and DETY for each event in the final _common_clean file
| Quadrant A | 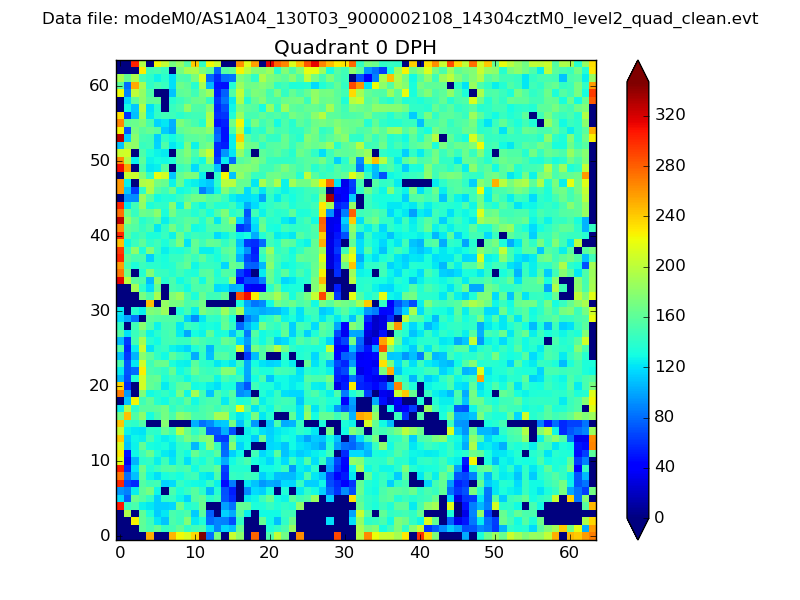 |
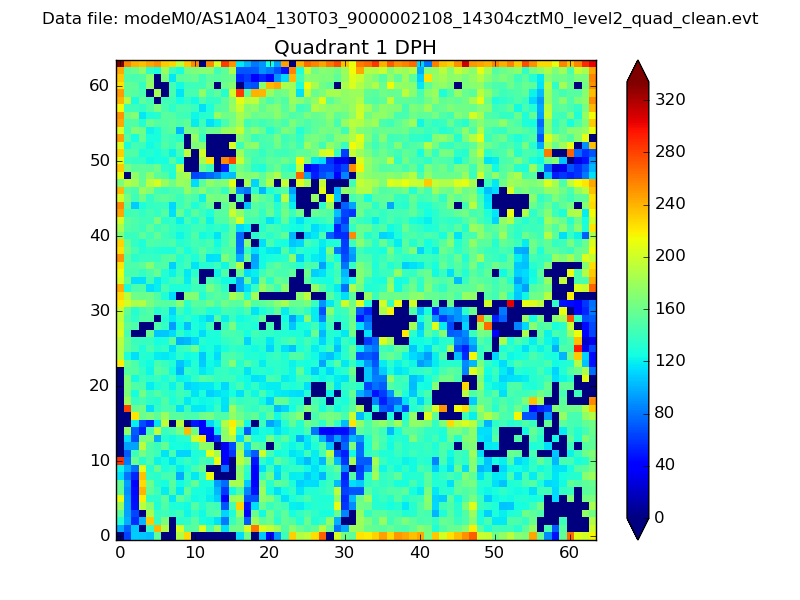 |
Quadrant B |
|---|---|---|---|
| Quadrant D | 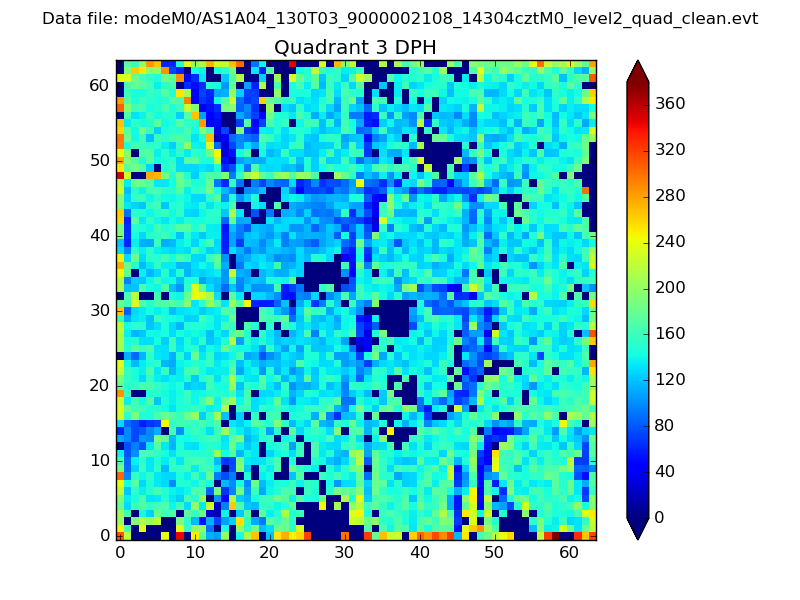 |
 |
Quadrant C |
| Plot type | Count rate plots | Images |
|---|---|---|
| Comparison with Poisson distribution Blue bars denote a histogram of data divided into 1 sec bins. Red curve is a Poisson curve with rate = median count rate of data. |
 |
 |
| Quadrant-wise count rates Data is divided into 100 sec bins |
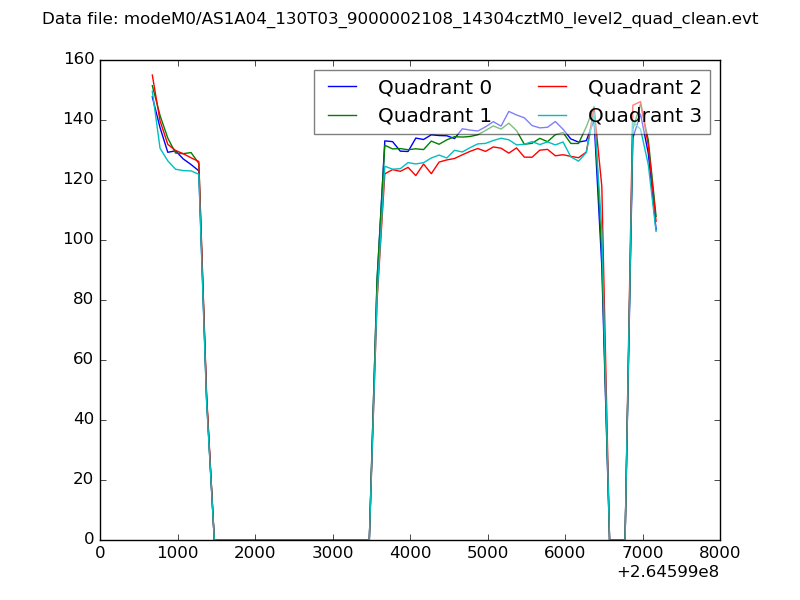 |
|
| Module-wise count rates for Quadrant A Data is divided into 100 sec bins |
 |
 |
| Module-wise count rates for Quadrant B Data is divided into 100 sec bins |
 |
 |
| Module-wise count rates for Quadrant C Data is divided into 100 sec bins |
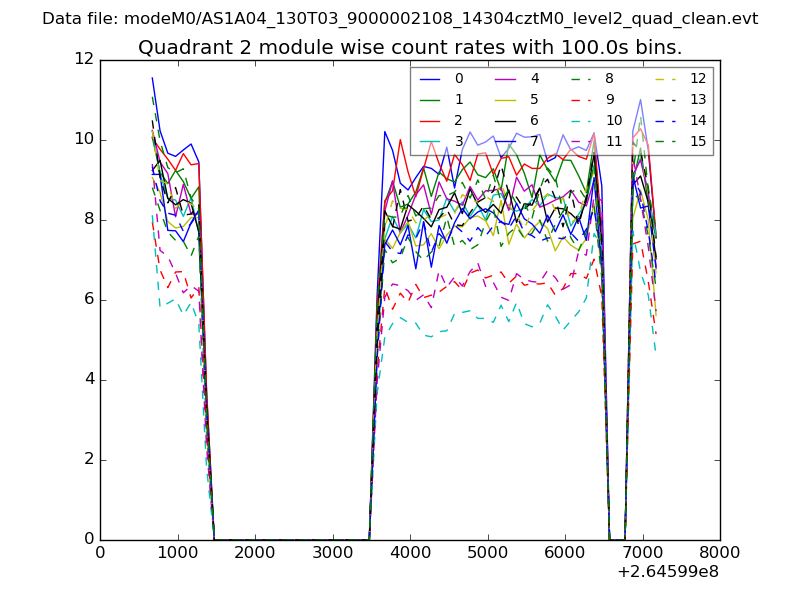 |
 |
| Module-wise count rates for Quadrant D Data is divided into 100 sec bins |
 |
 |
| Parameter | Plot |
|---|---|
| CZT HV Monitor | 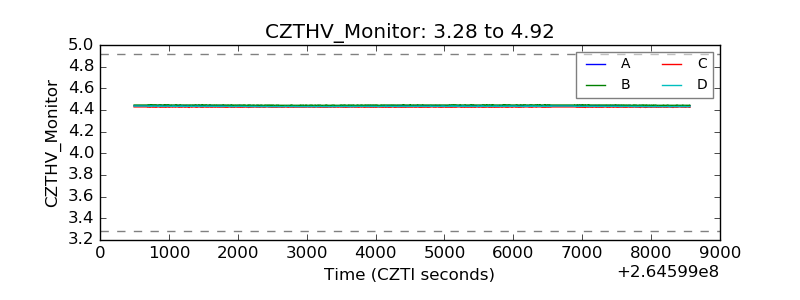 |
| D_VDD | 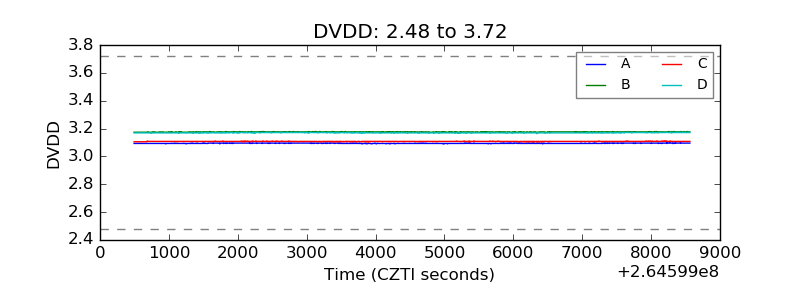 |
| Temperature 1 | 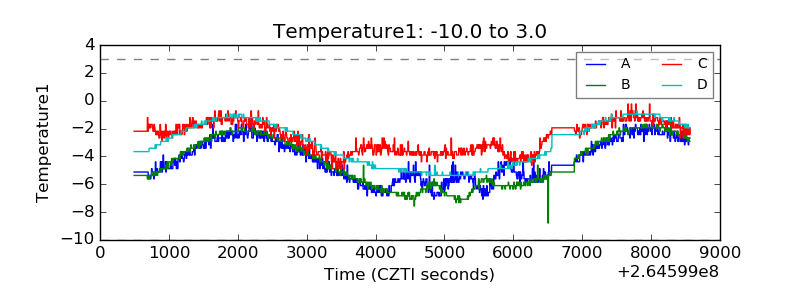 |
| Veto HV Monitor |  |
| Veto LLD | 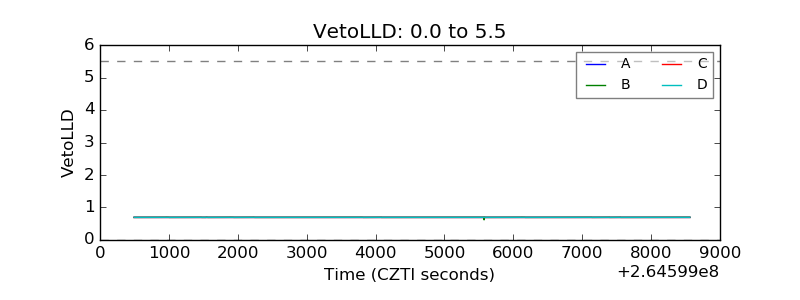 |
| Alpha Counter | 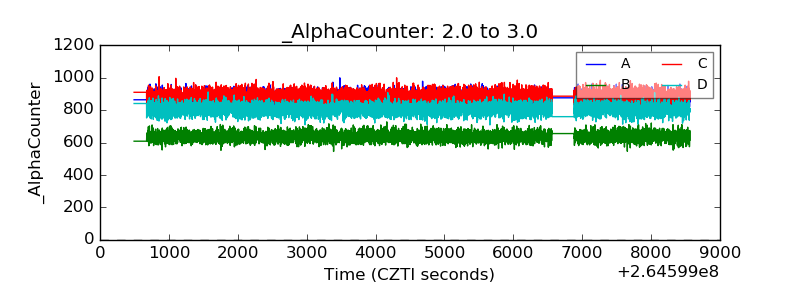 |
| _CPM_Rate | 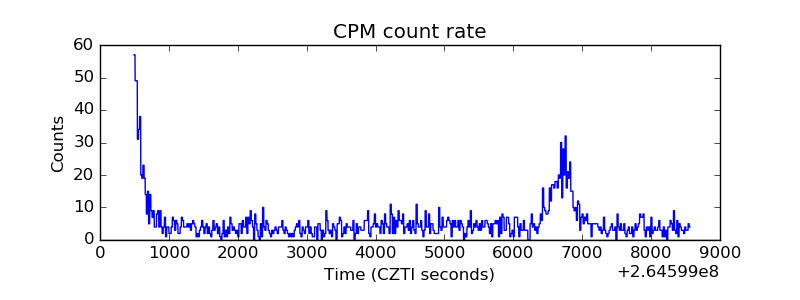 |
| CZT Counter |  |
| +2.5 Volts monitor | 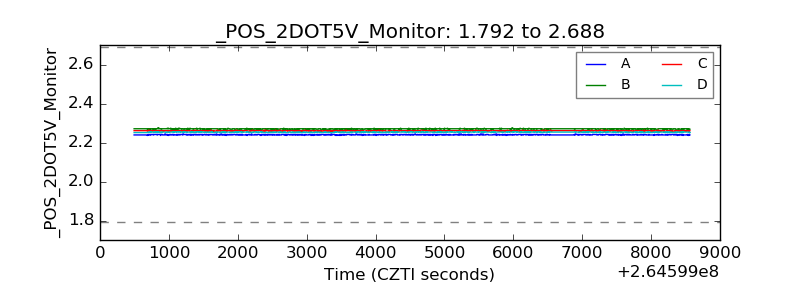 |
| +5 Volts monitor |  |
| _ROLL_ROT | 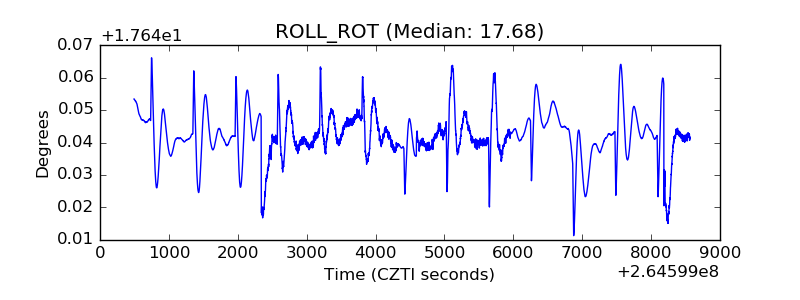 |
| _Roll_DEC |  |
| _Roll_RA |  |
| Veto Counter |  |