| Param | Original file | Final file |
|---|---|---|
| Filename | modeM0/AS1A04_130T03_9000002108_14305cztM0_level2.evt | modeM0/AS1A04_130T03_9000002108_14305cztM0_level2_quad_clean.evt |
| Size (bytes) | 705,888,000 | 105,523,200 |
| Size | 673.2 MB | 100.6 MB |
| Events in quadrant A | 4,871,140 | 651,941 |
| Events in quadrant B | 5,227,881 | 653,212 |
| Events in quadrant C | 5,197,209 | 629,888 |
| Events in quadrant D | 5,465,354 | 628,690 |
| Mode M9 | |||
|---|---|---|---|
| Quadrant | BADHDUFLAG | Total packets | Discarded packets |
| A | 0 | 11 | 0 |
| B | 0 | 10 | 0 |
| C | 0 | 10 | 0 |
| D | 0 | 10 | 0 |
| Mode SS | |||
|---|---|---|---|
| Quadrant | BADHDUFLAG | Total packets | Discarded packets |
| A | 0 | 188 | 0 |
| B | 0 | 188 | 0 |
| C | 0 | 188 | 0 |
| D | 0 | 188 | 0 |
| Mode M0 | |||
|---|---|---|---|
| Quadrant | BADHDUFLAG | Total packets | Discarded packets |
| A | 0 | 19926 | 3 |
| B | 0 | 21315 | 2 |
| C | 0 | 20469 | 2 |
| D | 0 | 22266 | 2 |
| Quadrant | Total seconds | Saturated seconds | Saturation percentage |
|---|---|---|---|
| A | 9101 | 369 | 4.054500% |
| B | 9101 | 435 | 4.779695% |
| C | 9101 | 240 | 2.637073% |
| D | 9101 | 273 | 2.999670% |
Noise dominated data is calculated using 1-second bins in cleaned event files. If a bin has >2000 counts, and if more than 50% of those come from <1% of pixels, then it is considered to be noise-dominated and hence unusable.
| Quadrant | # 1 sec bins | Bins with >0 counts | Bins with >2000 counts | High rate bins dominated by noise | Noise dominated (total time) | Noise dominated (detector-on time) | Marked lightcurve |
|---|---|---|---|---|---|---|---|
| A | 29173 | 9104 | 38 | 38 | 0.13% | 0.42% | 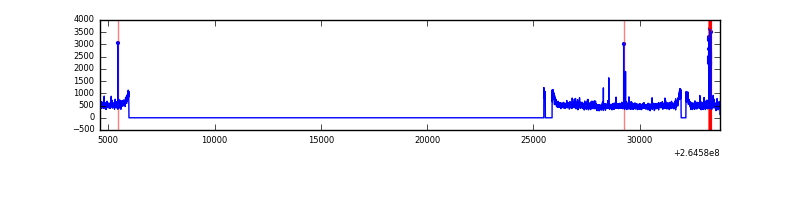 |
| B | 29173 | 9104 | 42 | 42 | 0.14% | 0.46% | 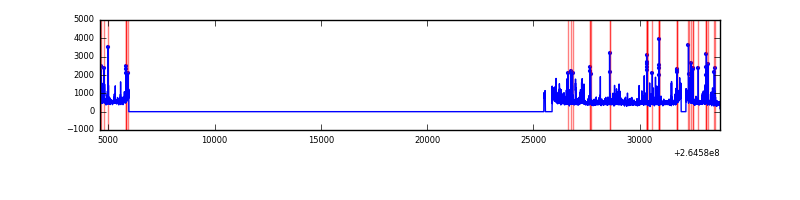 |
| C | 29173 | 9104 | 0 | 0 | 0.00% | 0.00% | 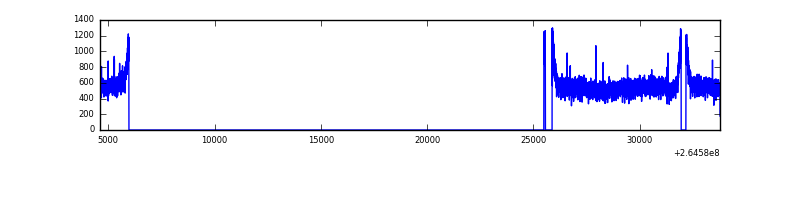 |
| D | 29173 | 9105 | 53 | 53 | 0.18% | 0.58% | 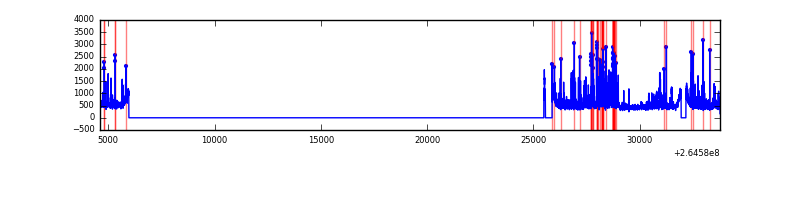 |
Top three noisy pixels from each quadrant. If the there are fewer than three noisy pixels in the level2.evt file, extra rows are filled as -1
| Pixel properties | Quadrant properties | ||||||
|---|---|---|---|---|---|---|---|
| Quadrant | DetID | PixID | Counts | Sigma | Mean | Median | Sigma |
| A | 8 | 15 | 145168 | 594.39 | 1172 | 1141 | 242.3 |
| A | 13 | 210 | 133578 | 546.56 | 1172 | 1141 | 242.3 |
| A | 12 | 189 | 53172 | 214.73 | 1172 | 1141 | 242.3 |
| B | 0 | 229 | 349395 | 1525.42 | 1160 | 1129 | 228.3 |
| B | 10 | 245 | 112394 | 487.34 | 1160 | 1129 | 228.3 |
| B | 4 | 142 | 53601 | 229.83 | 1160 | 1129 | 228.3 |
| C | 3 | 233 | 775539 | 2910.72 | 1132 | 1140 | 266.1 |
| C | 13 | 61 | 8181 | 26.46 | 1132 | 1140 | 266.1 |
| C | 10 | 22 | 6450 | 19.96 | 1132 | 1140 | 266.1 |
| D | 5 | 222 | 546272 | 1996.39 | 1141 | 1113 | 273.1 |
| D | 12 | 110 | 327629 | 1195.71 | 1141 | 1113 | 273.1 |
| D | 2 | 152 | 124846 | 453.11 | 1141 | 1113 | 273.1 |
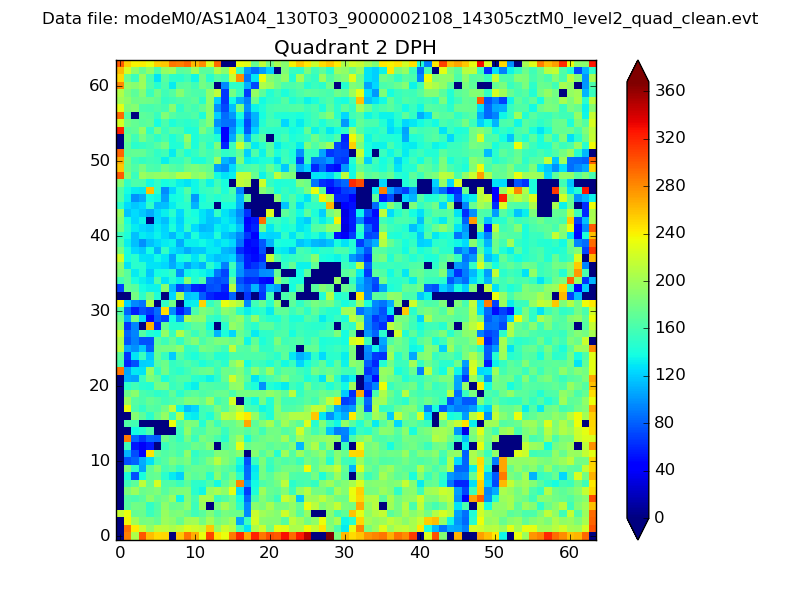
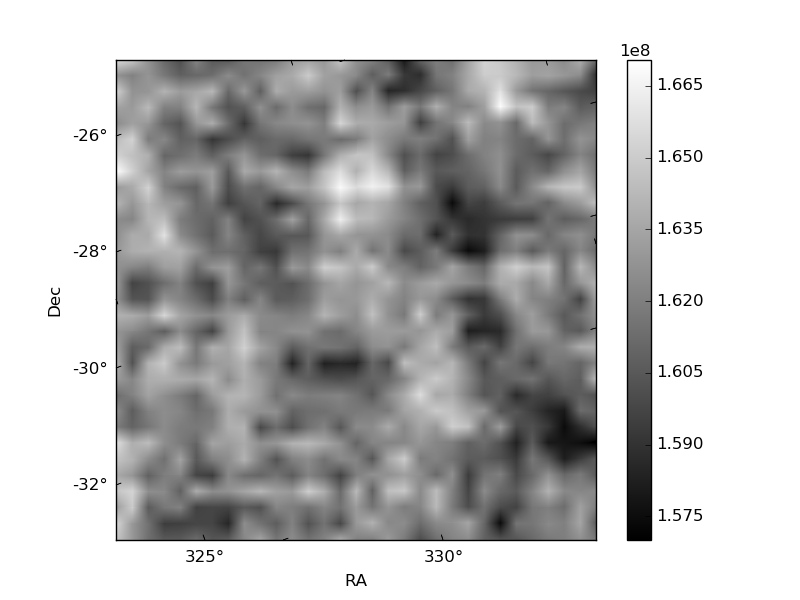
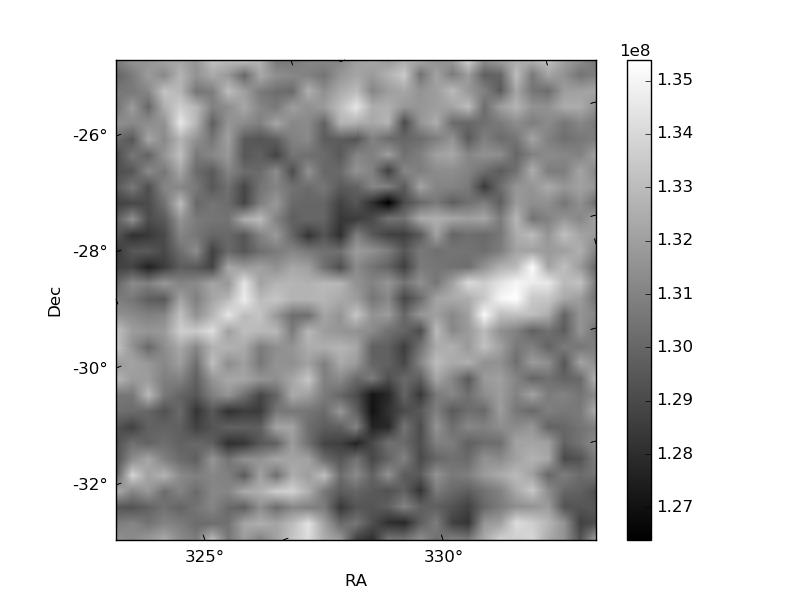
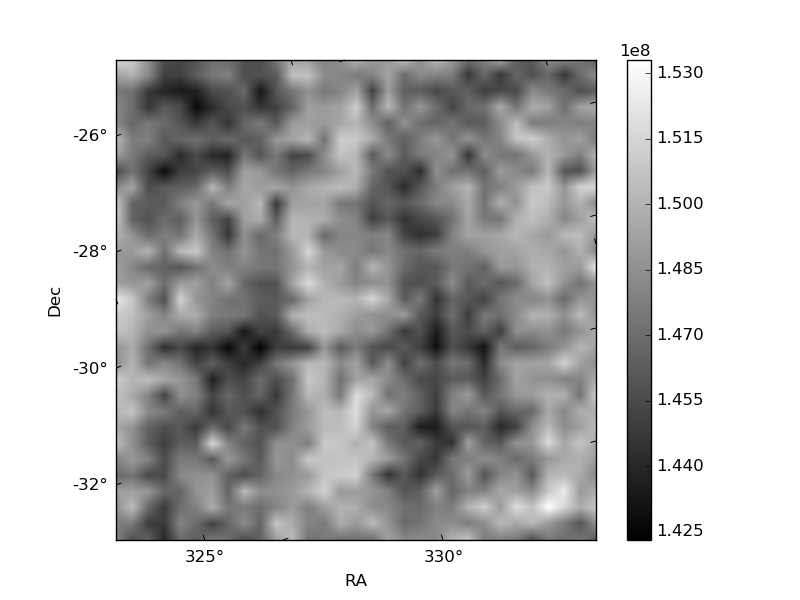
Histogram calculated using DETX and DETY for each event in the final _common_clean file
| Quadrant A | 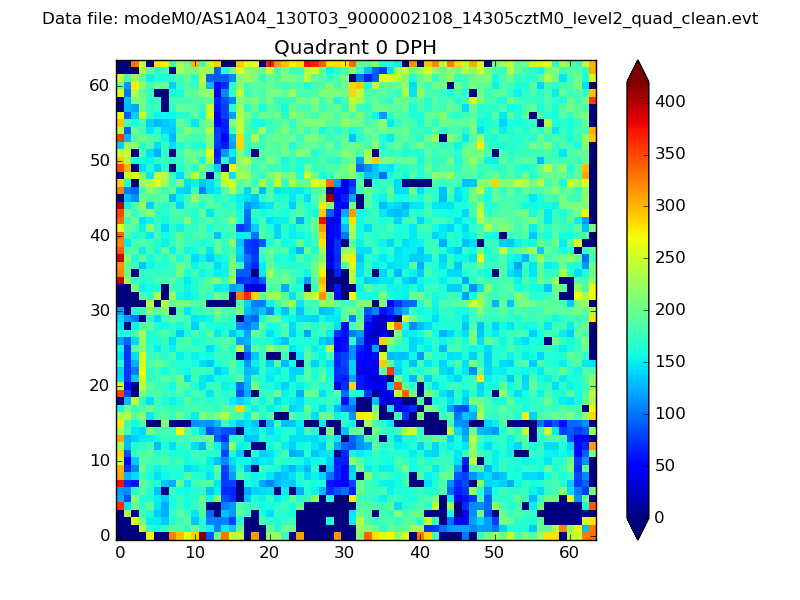 |
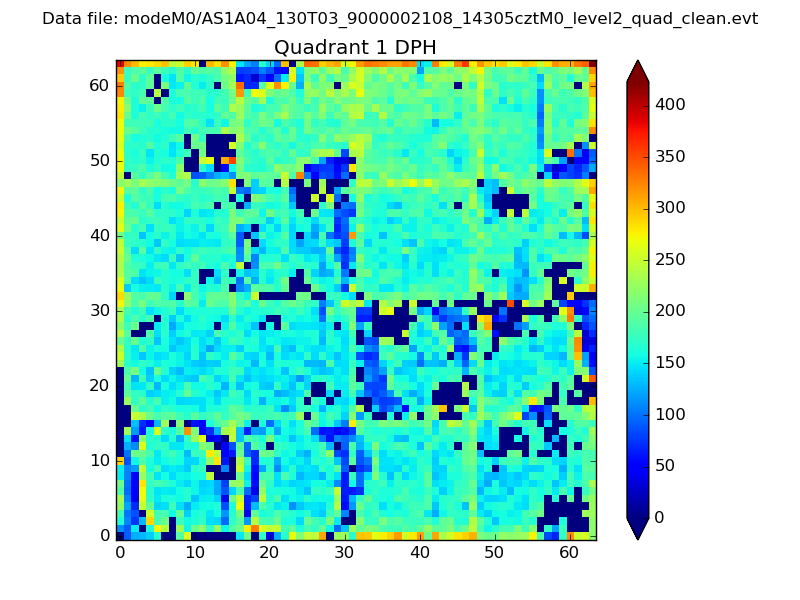 |
Quadrant B |
|---|---|---|---|
| Quadrant D | 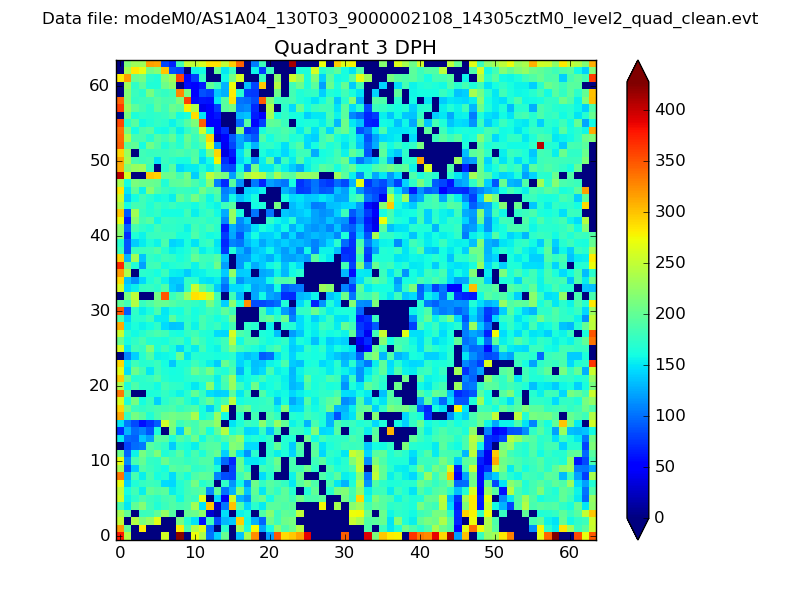 |
 |
Quadrant C |
| Plot type | Count rate plots | Images |
|---|---|---|
| Comparison with Poisson distribution Blue bars denote a histogram of data divided into 1 sec bins. Red curve is a Poisson curve with rate = median count rate of data. |
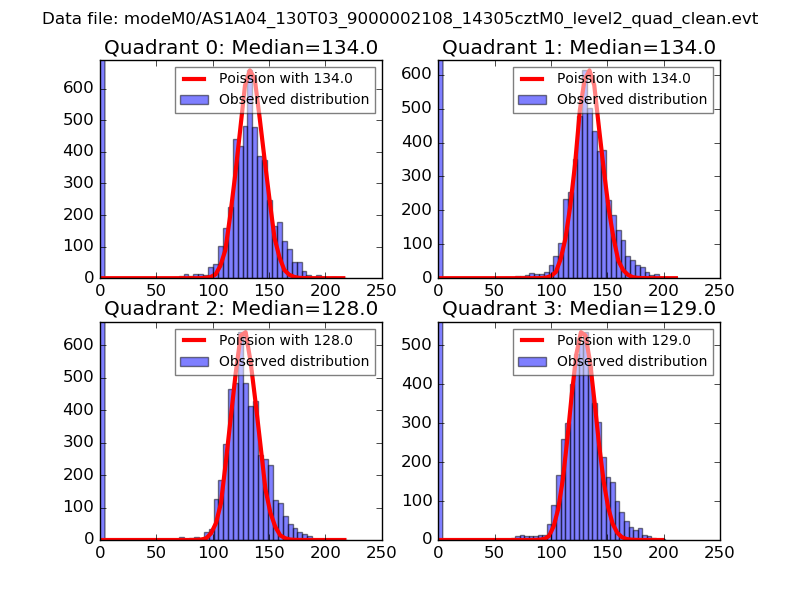 |
 |
| Quadrant-wise count rates Data is divided into 100 sec bins |
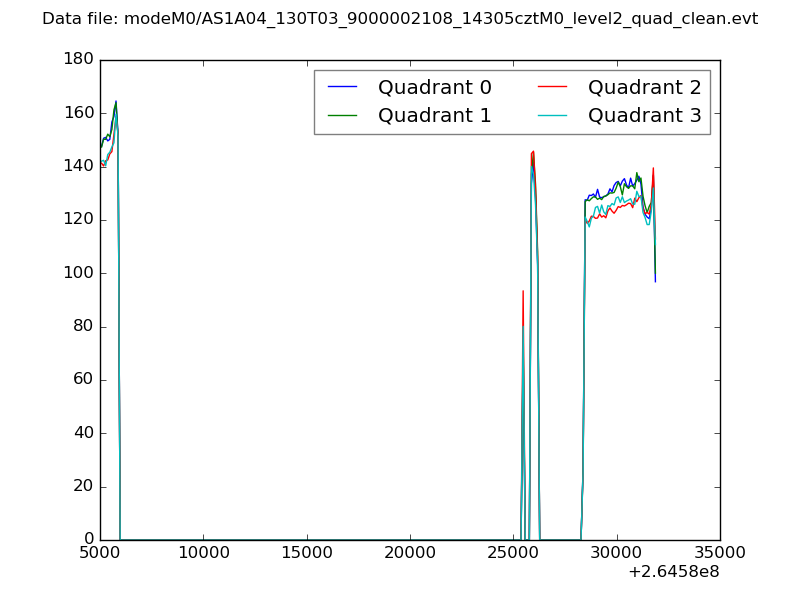 |
|
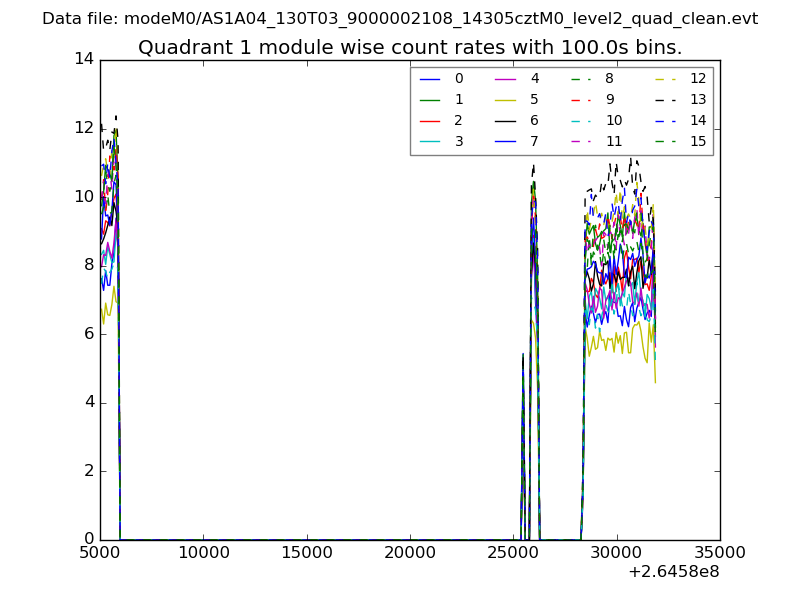
| Module-wise count rates for Quadrant A Data is divided into 100 sec bins |
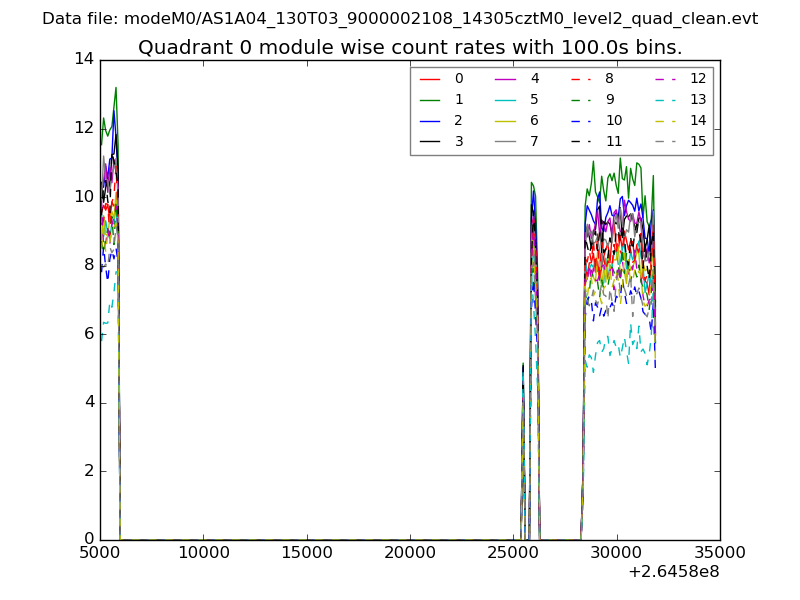 |
 |
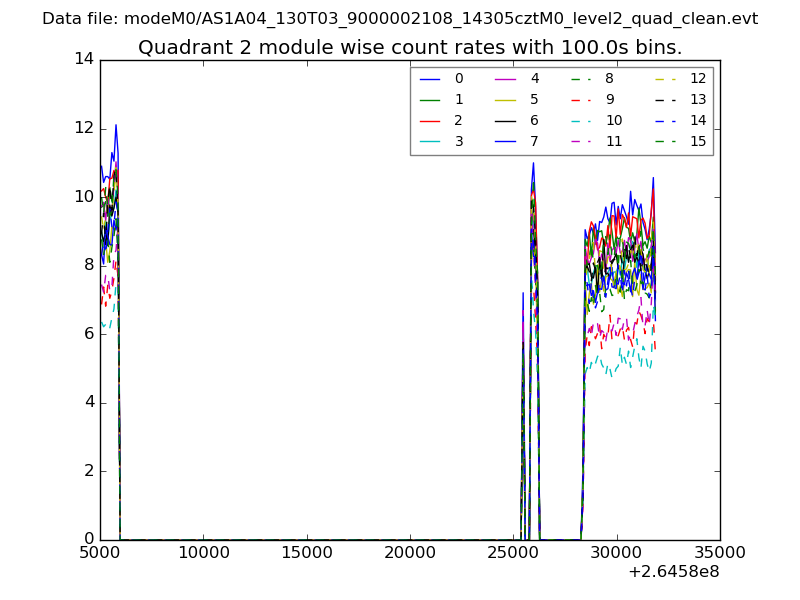
| Module-wise count rates for Quadrant B Data is divided into 100 sec bins |
 |
 |
| Module-wise count rates for Quadrant C Data is divided into 100 sec bins |
 |
 |
| Module-wise count rates for Quadrant D Data is divided into 100 sec bins |
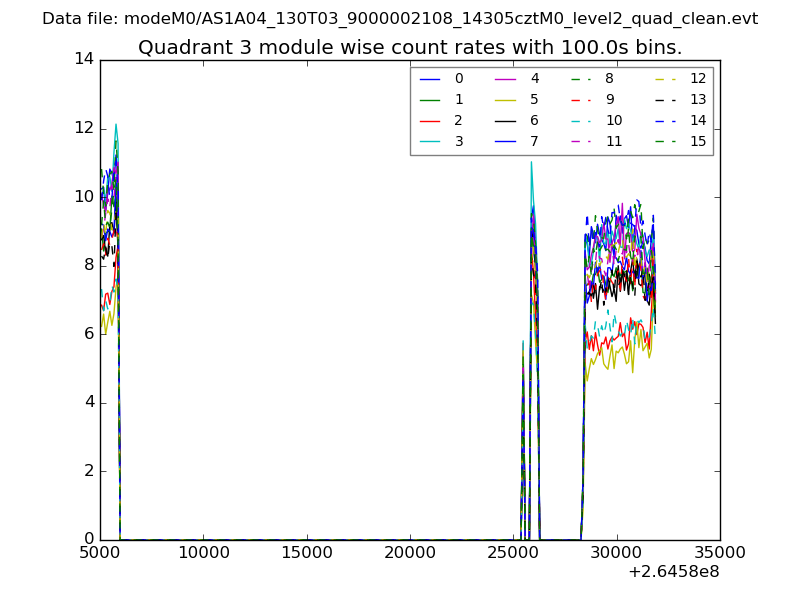 |
 |
| Parameter | Plot |
|---|---|
| CZT HV Monitor | 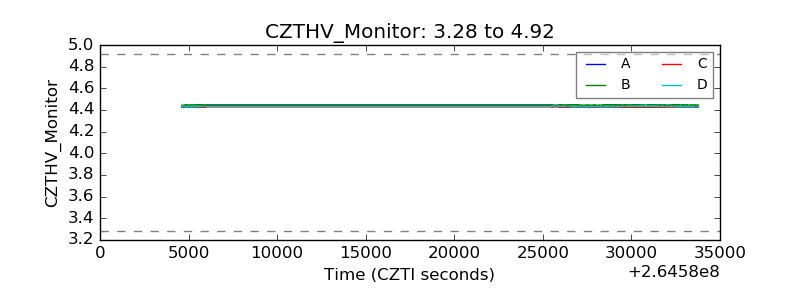 |
| D_VDD | 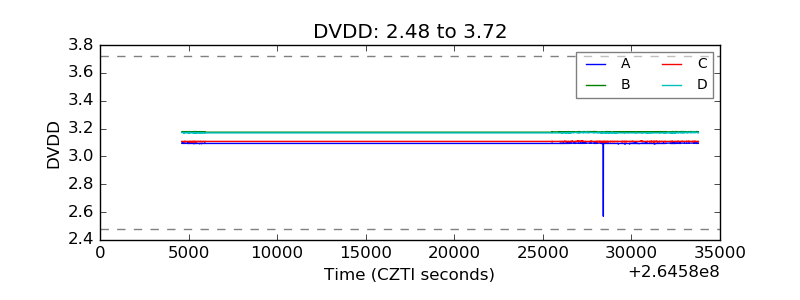 |
| Temperature 1 | 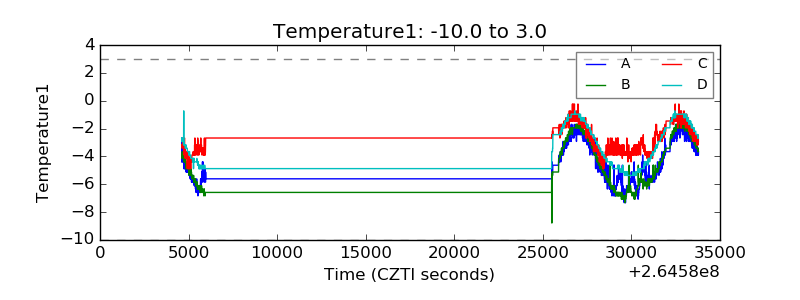 |
| Veto HV Monitor | 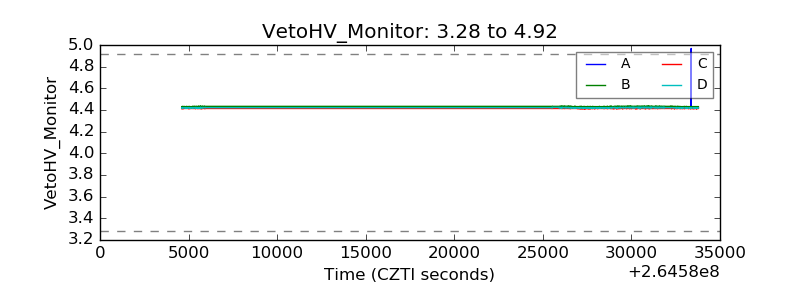 |
| Veto LLD | 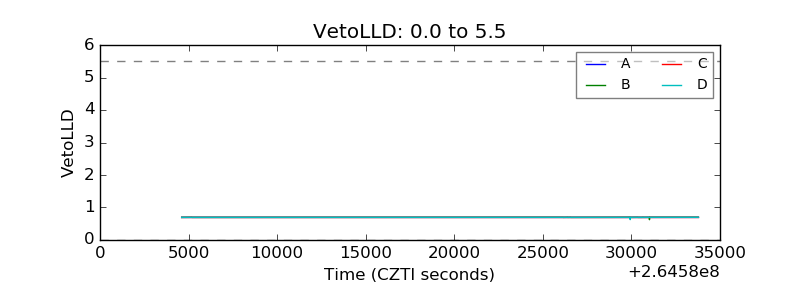 |
| Alpha Counter | 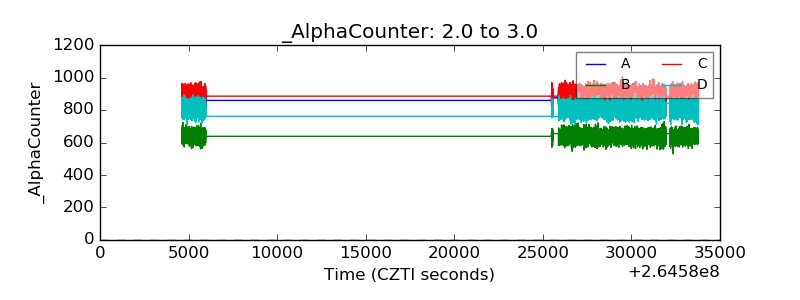 |
| _CPM_Rate | 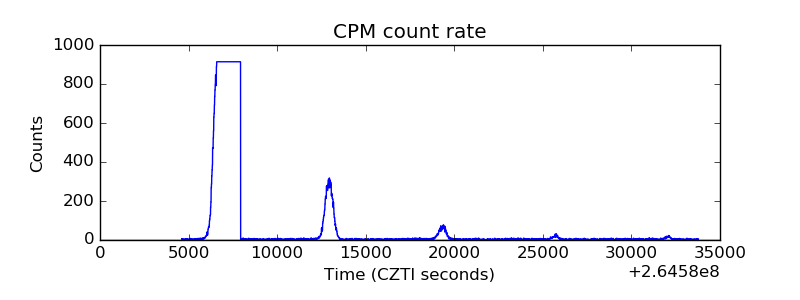 |
| CZT Counter |  |
| +2.5 Volts monitor |  |
| +5 Volts monitor |  |
| _ROLL_ROT | 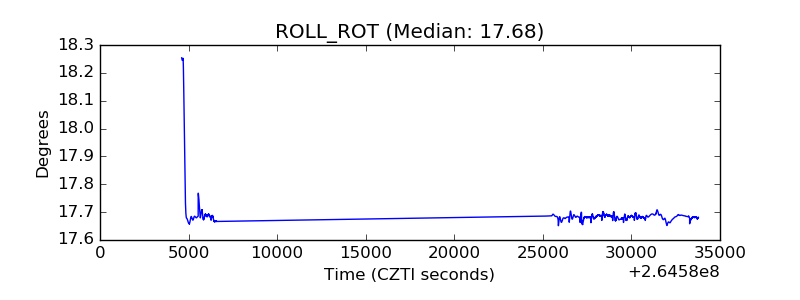 |
| _Roll_DEC |  |
| _Roll_RA | 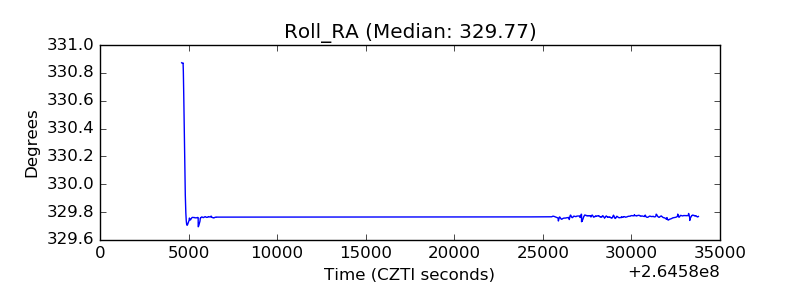 |
| Veto Counter |  |