| Param | Original file | Final file |
|---|---|---|
| Filename | modeM0/AS1A04_130T03_9000002108_14306cztM0_level2.evt | modeM0/AS1A04_130T03_9000002108_14306cztM0_level2_quad_clean.evt |
| Size (bytes) | 1,922,549,760 | 303,779,520 |
| Size | 1.8 GB | 289.7 MB |
| Events in quadrant A | 13,138,574 | 1,912,115 |
| Events in quadrant B | 14,686,671 | 1,893,847 |
| Events in quadrant C | 13,647,018 | 1,841,203 |
| Events in quadrant D | 15,053,910 | 1,821,163 |
| Mode M9 | |||
|---|---|---|---|
| Quadrant | BADHDUFLAG | Total packets | Discarded packets |
| A | 0 | 35 | 0 |
| B | 0 | 35 | 0 |
| C | 0 | 35 | 0 |
| D | 0 | 35 | 0 |
| Mode SS | |||
|---|---|---|---|
| Quadrant | BADHDUFLAG | Total packets | Discarded packets |
| A | 0 | 516 | 0 |
| B | 0 | 516 | 0 |
| C | 0 | 516 | 0 |
| D | 0 | 516 | 0 |
| Mode M0 | |||
|---|---|---|---|
| Quadrant | BADHDUFLAG | Total packets | Discarded packets |
| A | 0 | 54182 | 5 |
| B | 0 | 59280 | 5 |
| C | 0 | 54368 | 5 |
| D | 0 | 61201 | 5 |
| Quadrant | Total seconds | Saturated seconds | Saturation percentage |
|---|---|---|---|
| A | 25164 | 691 | 2.745986% |
| B | 25164 | 1113 | 4.422985% |
| C | 25164 | 427 | 1.696869% |
| D | 25164 | 711 | 2.825465% |
Noise dominated data is calculated using 1-second bins in cleaned event files. If a bin has >2000 counts, and if more than 50% of those come from <1% of pixels, then it is considered to be noise-dominated and hence unusable.
| Quadrant | # 1 sec bins | Bins with >0 counts | Bins with >2000 counts | High rate bins dominated by noise | Noise dominated (total time) | Noise dominated (detector-on time) | Marked lightcurve |
|---|---|---|---|---|---|---|---|
| A | 30562 | 25168 | 40 | 40 | 0.13% | 0.16% | 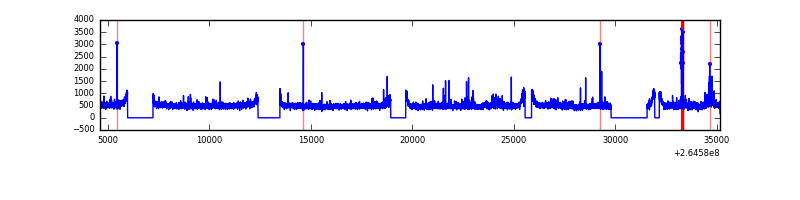 |
| B | 30562 | 25168 | 261 | 261 | 0.85% | 1.04% | 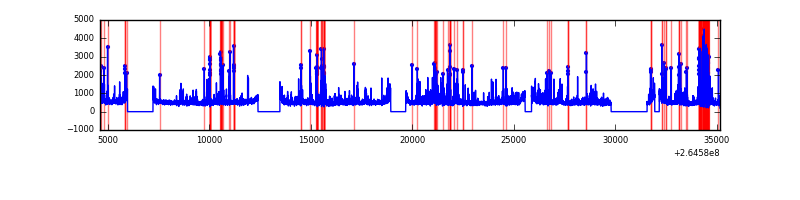 |
| C | 30562 | 25169 | 0 | 0 | 0.00% | 0.00% | 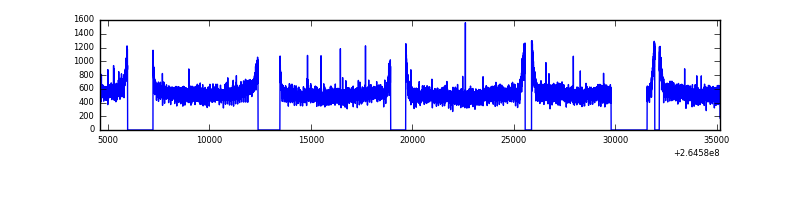 |
| D | 30562 | 25169 | 204 | 204 | 0.67% | 0.81% | 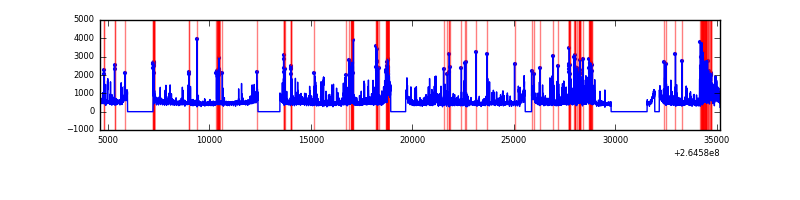 |
Top three noisy pixels from each quadrant. If the there are fewer than three noisy pixels in the level2.evt file, extra rows are filled as -1
| Pixel properties | Quadrant properties | ||||||
|---|---|---|---|---|---|---|---|
| Quadrant | DetID | PixID | Counts | Sigma | Mean | Median | Sigma |
| A | 13 | 210 | 294319 | 453.29 | 3179 | 3105 | 642.4 |
| A | 8 | 15 | 291259 | 448.53 | 3179 | 3105 | 642.4 |
| A | 12 | 189 | 269204 | 414.2 | 3179 | 3105 | 642.4 |
| B | 0 | 229 | 1100007 | 1835.36 | 3129 | 3049 | 597.7 |
| B | 10 | 16 | 520629 | 865.98 | 3129 | 3049 | 597.7 |
| B | 10 | 245 | 303467 | 502.64 | 3129 | 3049 | 597.7 |
| C | 3 | 233 | 1699450 | 2414.96 | 3059 | 3078 | 702.4 |
| C | 13 | 61 | 22207 | 27.23 | 3059 | 3078 | 702.4 |
| C | 10 | 22 | 14361 | 16.06 | 3059 | 3078 | 702.4 |
| D | 5 | 222 | 1262150 | 1734.57 | 3077 | 3010 | 725.9 |
| D | 12 | 110 | 1048622 | 1440.42 | 3077 | 3010 | 725.9 |
| D | 13 | 122 | 405092 | 553.9 | 3077 | 3010 | 725.9 |
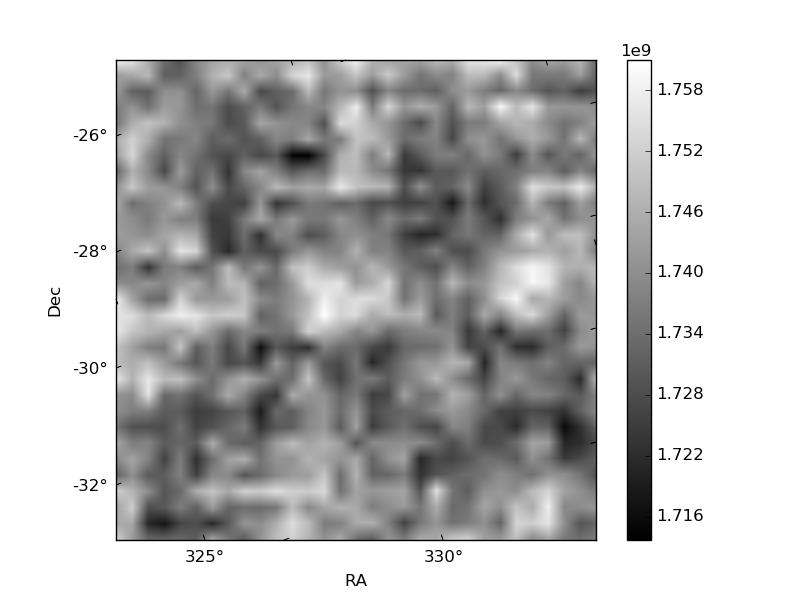
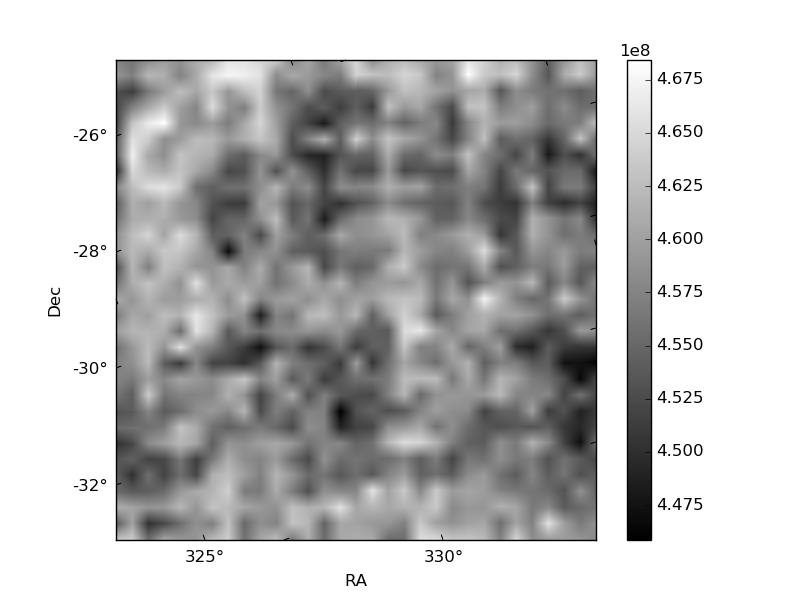
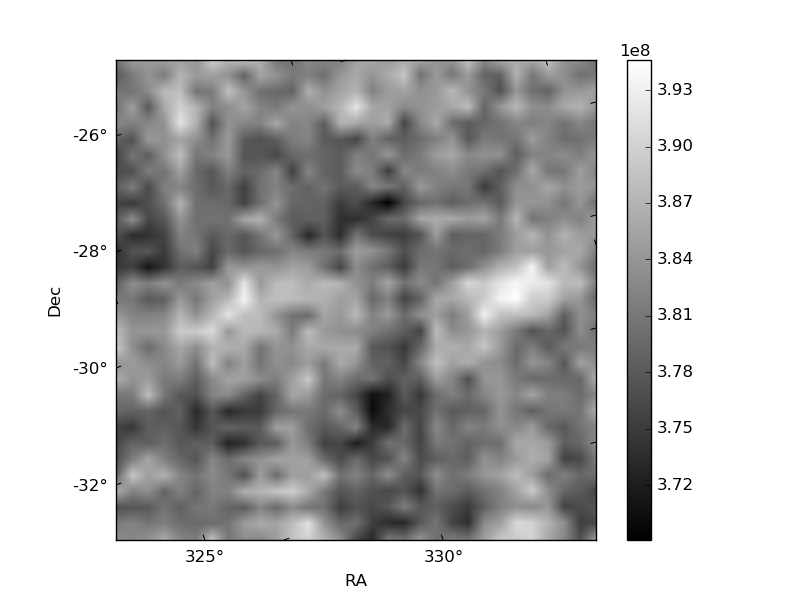
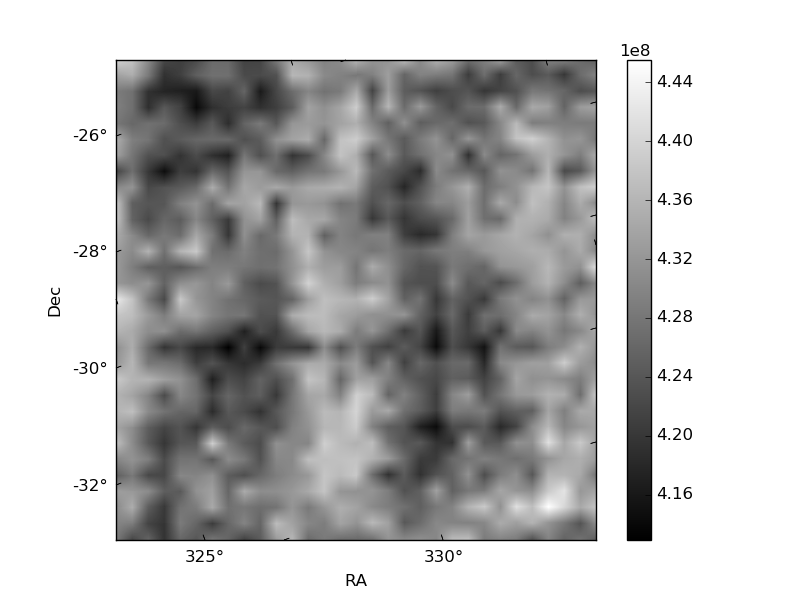
Histogram calculated using DETX and DETY for each event in the final _common_clean file
| Quadrant A | 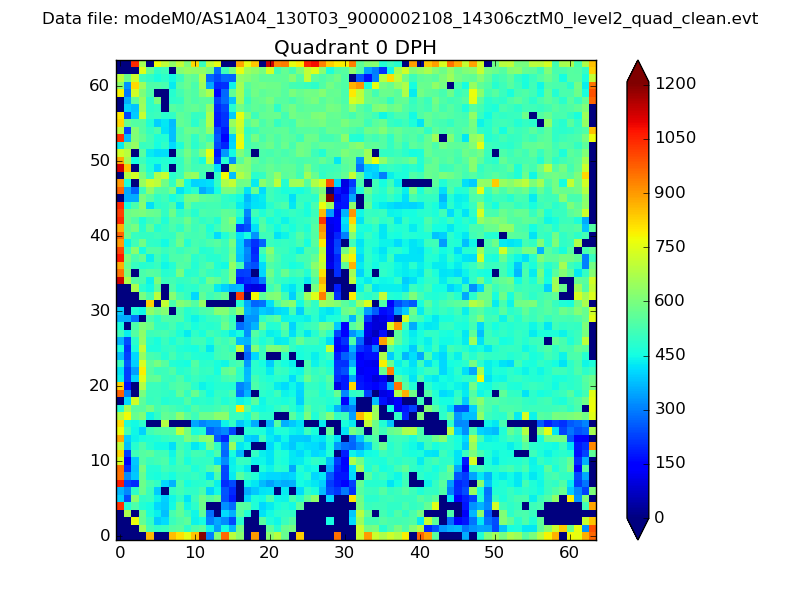 |
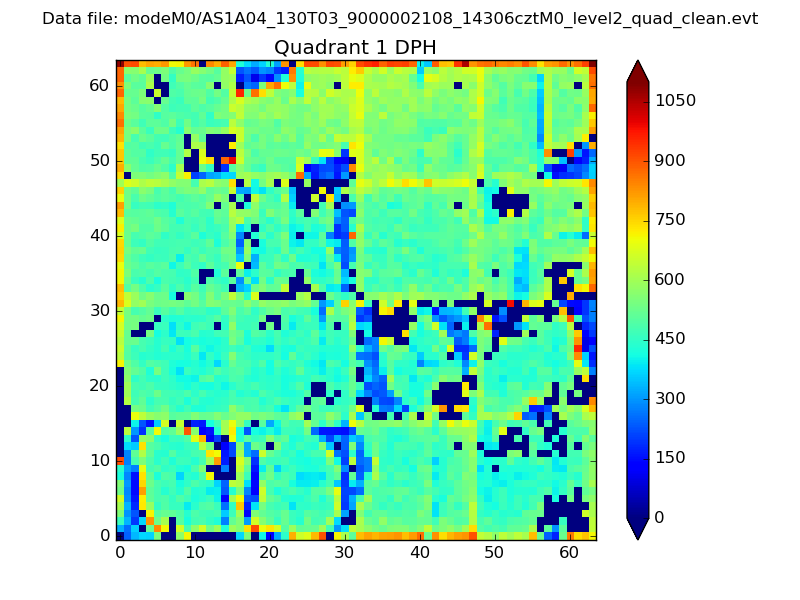 |
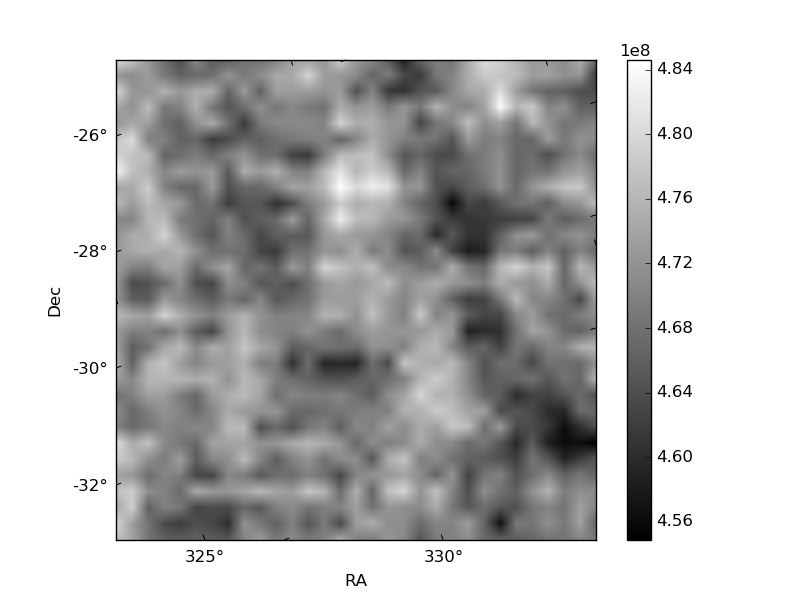
Quadrant B |
|---|---|---|---|
| Quadrant D | 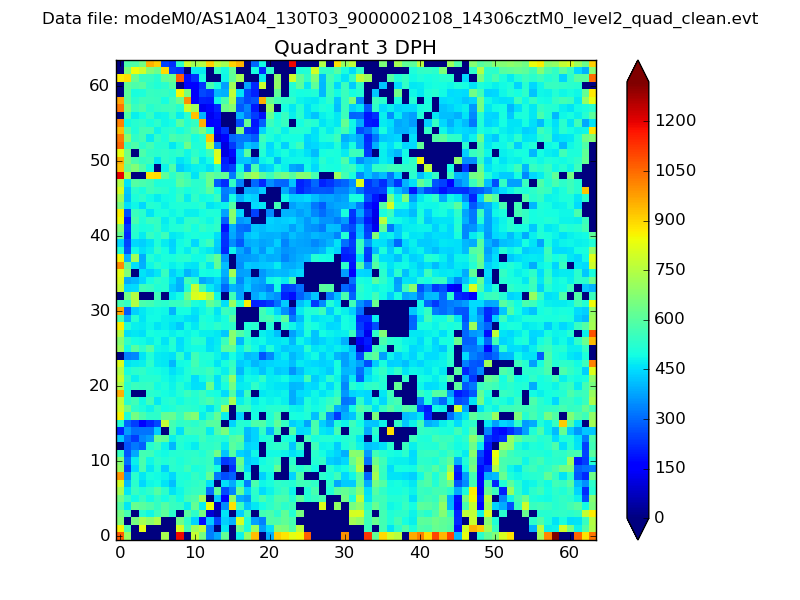 |
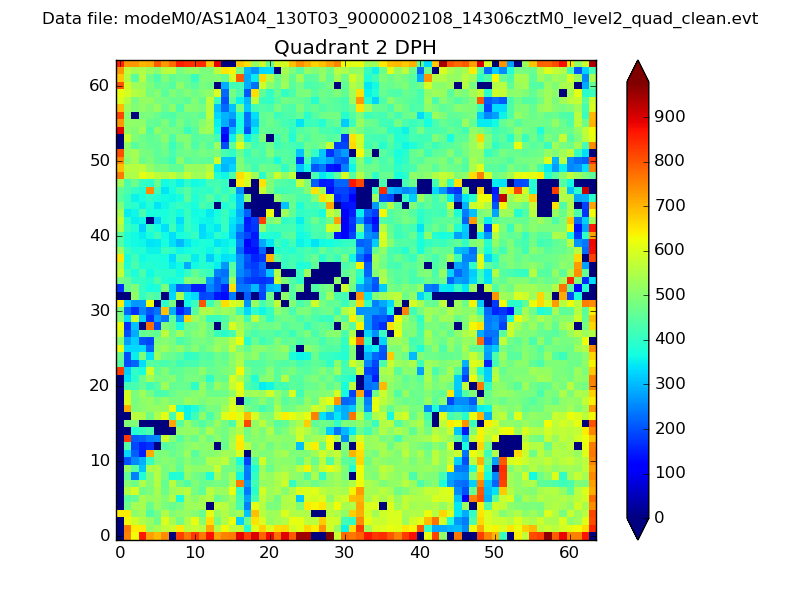 |
Quadrant C |
| Plot type | Count rate plots | Images |
|---|---|---|
| Comparison with Poisson distribution Blue bars denote a histogram of data divided into 1 sec bins. Red curve is a Poisson curve with rate = median count rate of data. |
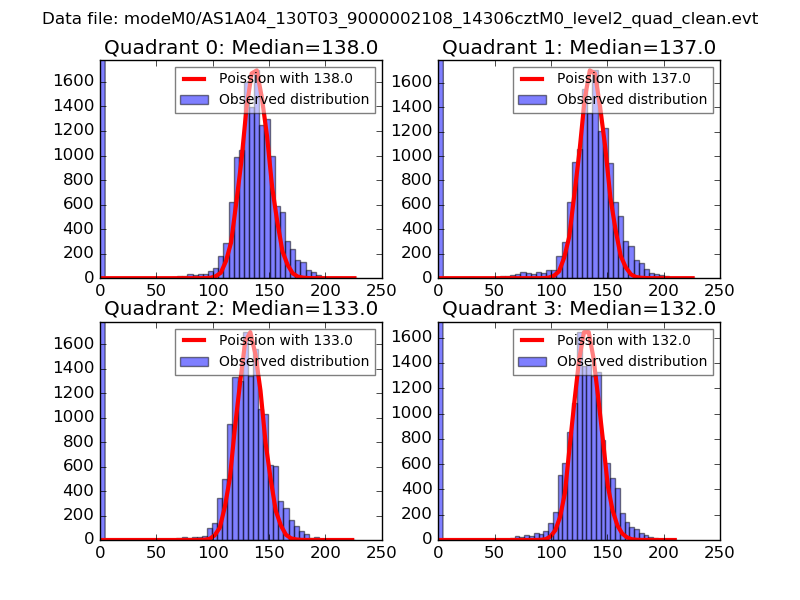 |
 |
| Quadrant-wise count rates Data is divided into 100 sec bins |
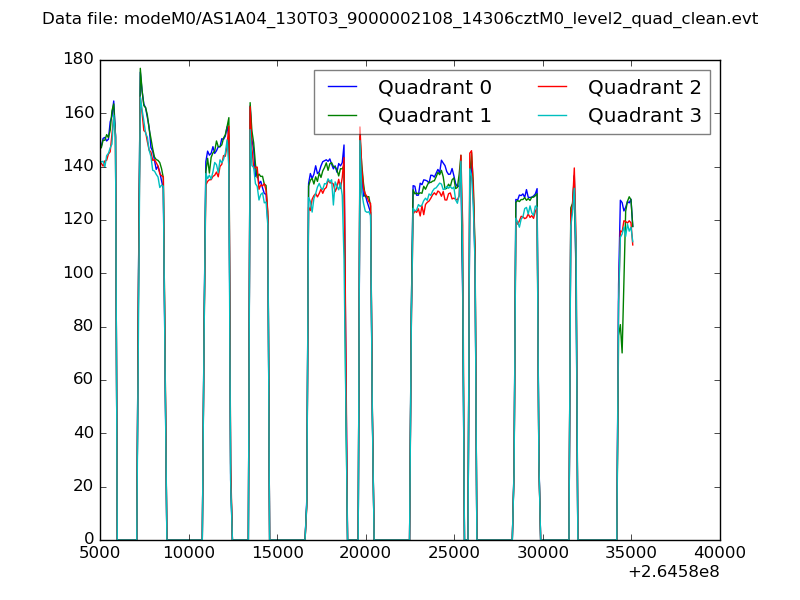 |
|
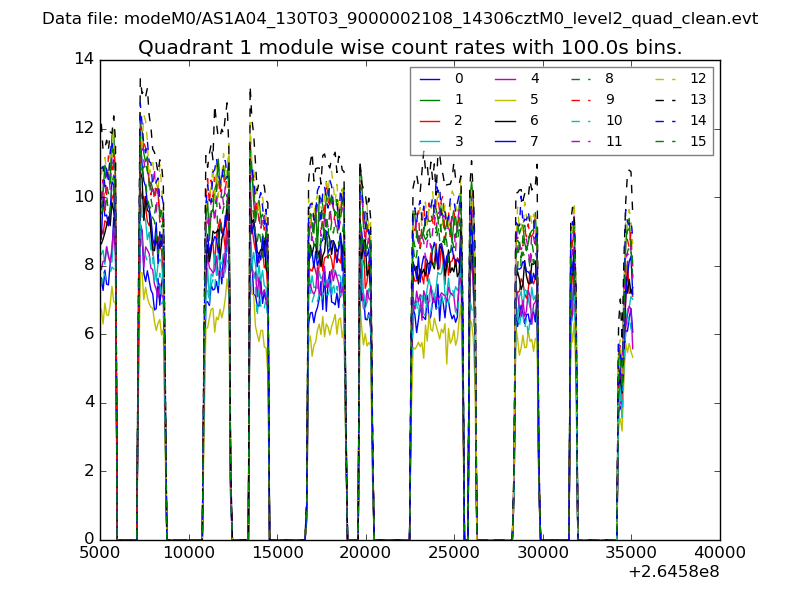
| Module-wise count rates for Quadrant A Data is divided into 100 sec bins |
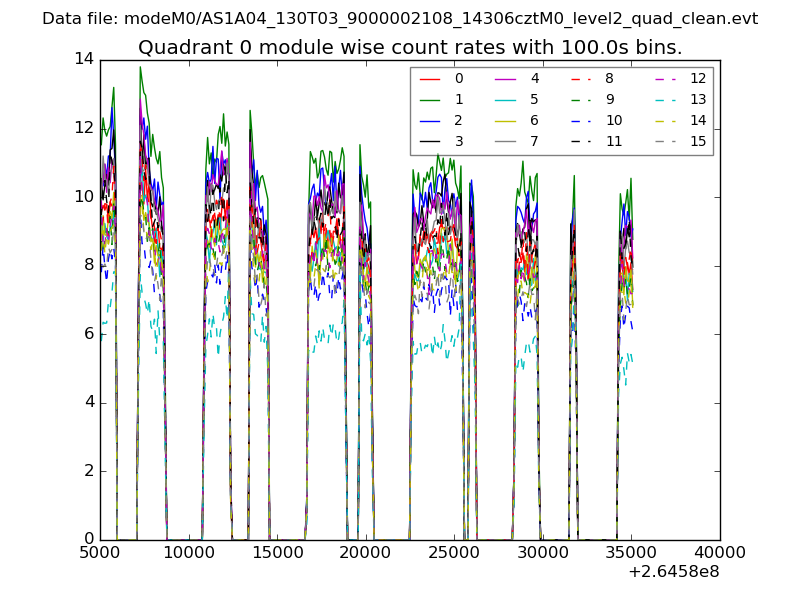 |
 |
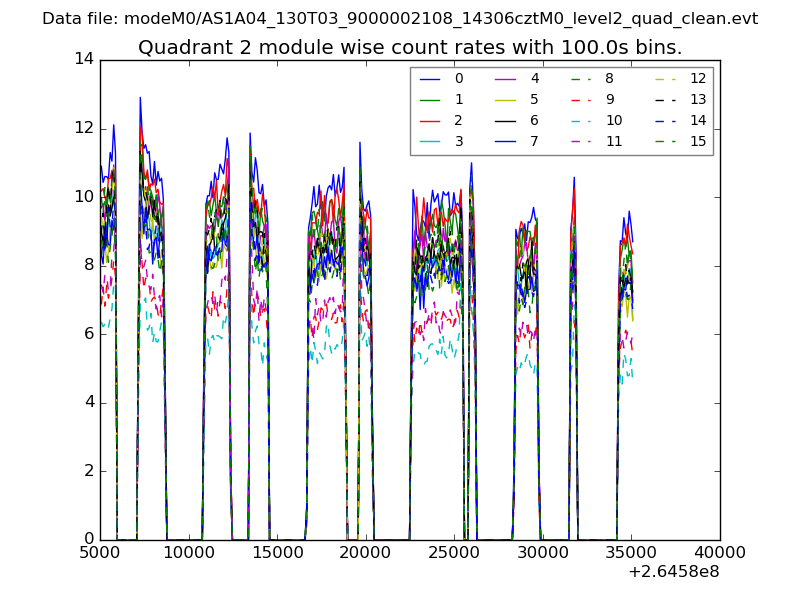
| Module-wise count rates for Quadrant B Data is divided into 100 sec bins |
 |
 |
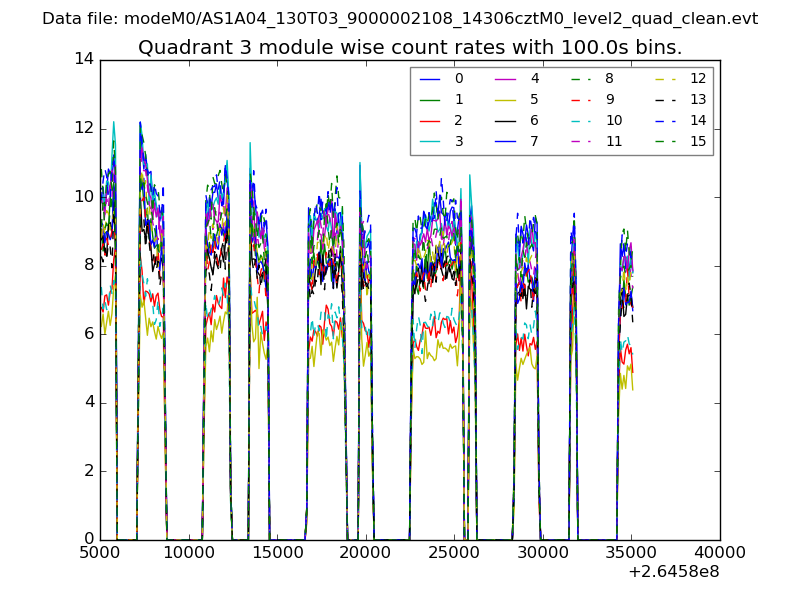
| Module-wise count rates for Quadrant C Data is divided into 100 sec bins |
 |
 |
| Module-wise count rates for Quadrant D Data is divided into 100 sec bins |
 |
 |
| Parameter | Plot |
|---|---|
| CZT HV Monitor | 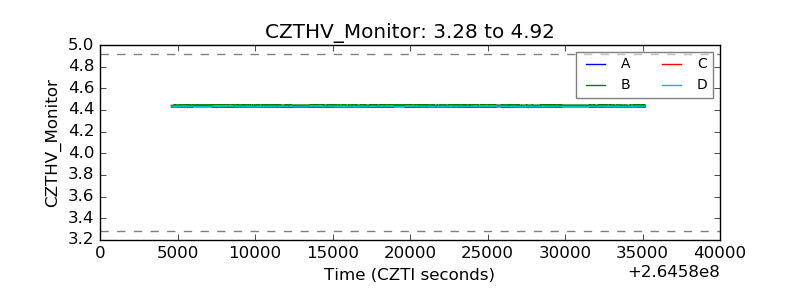 |
| D_VDD | 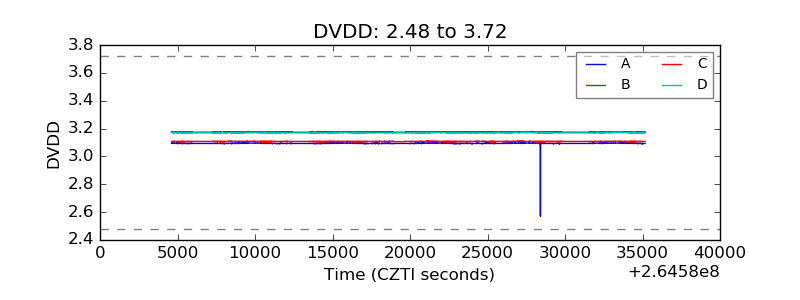 |
| Temperature 1 | 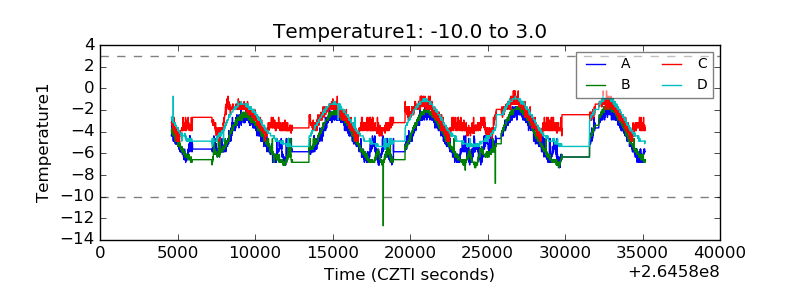 |
| Veto HV Monitor | 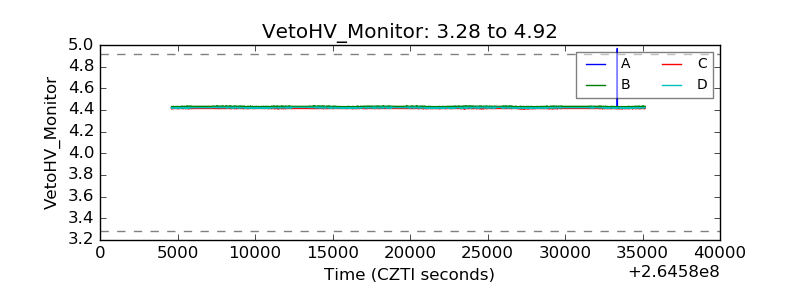 |
| Veto LLD | 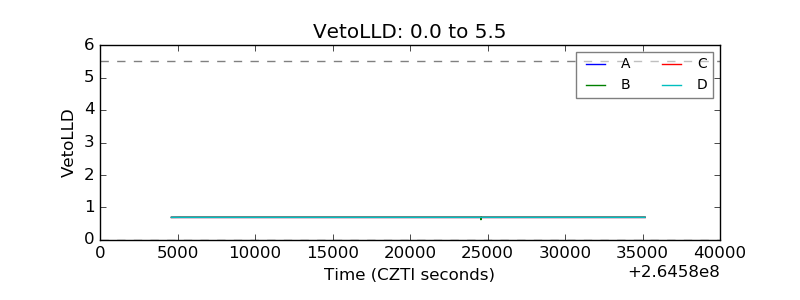 |
| Alpha Counter | 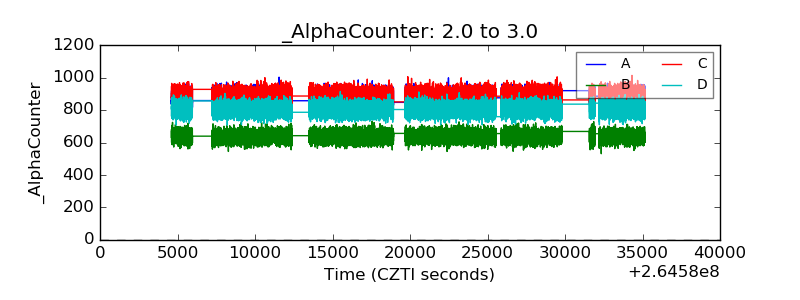 |
| _CPM_Rate | 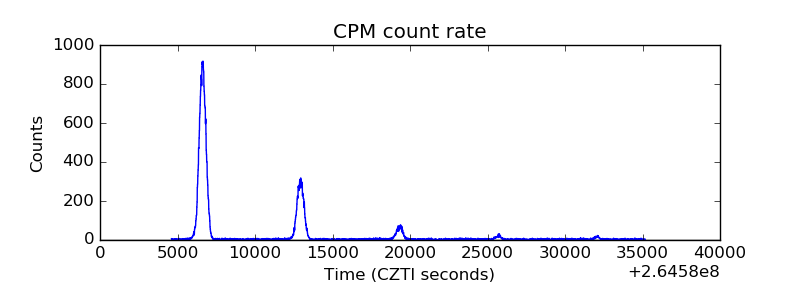 |
| CZT Counter | 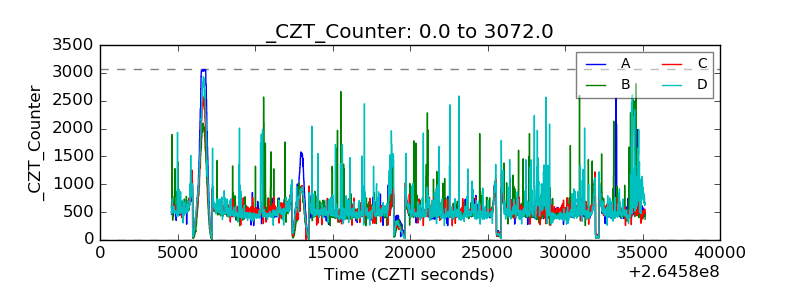 |
| +2.5 Volts monitor |  |
| +5 Volts monitor | 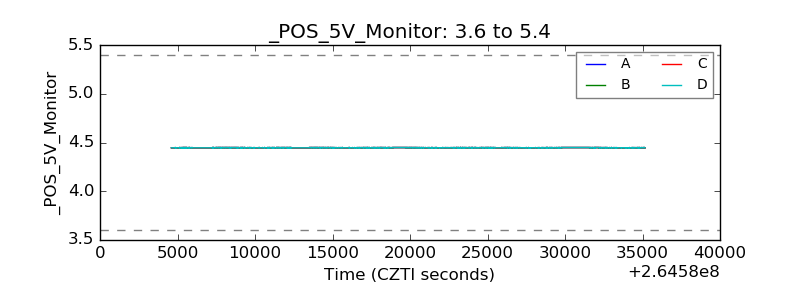 |
| _ROLL_ROT | 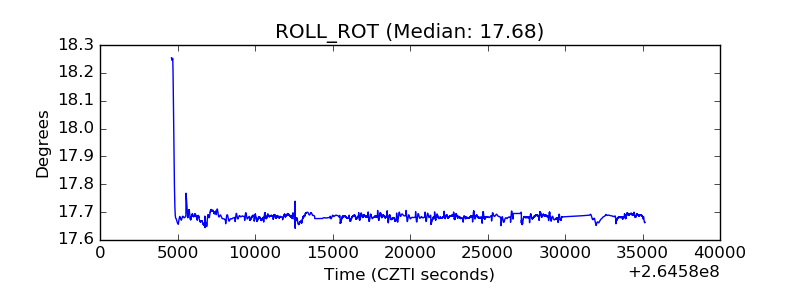 |
| _Roll_DEC | 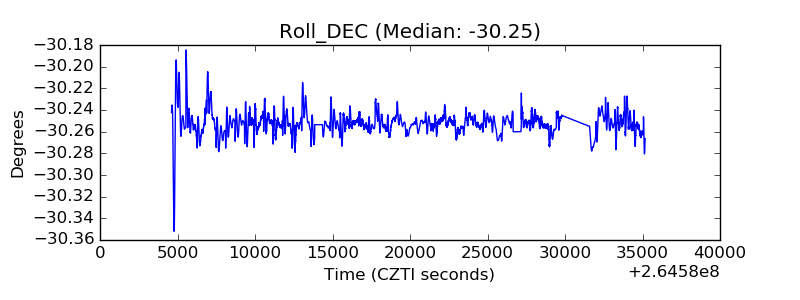 |
| _Roll_RA | 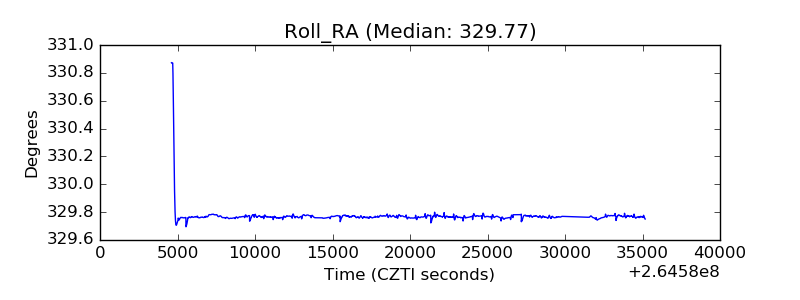 |
| Veto Counter | 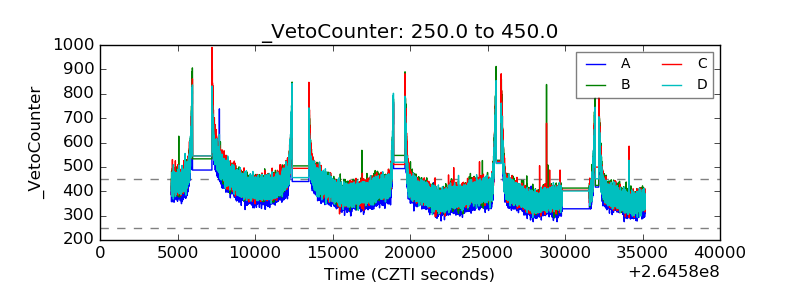 |