| Param | Original file | Final file |
|---|---|---|
| Filename | modeM0/AS1G08_078T01_9000002110_14306cztM0_level2.evt | modeM0/AS1G08_078T01_9000002110_14306cztM0_level2_quad_clean.evt |
| Size (bytes) | 285,027,840 | 40,734,720 |
| Size | 271.8 MB | 38.8 MB |
| Events in quadrant A | 2,024,691 | 245,808 |
| Events in quadrant B | 1,917,024 | 246,308 |
| Events in quadrant C | 2,141,610 | 241,493 |
| Events in quadrant D | 2,293,333 | 234,831 |
| Mode SS | |||
|---|---|---|---|
| Quadrant | BADHDUFLAG | Total packets | Discarded packets |
| A | 0 | 76 | 0 |
| B | 0 | 76 | 0 |
| C | 0 | 76 | 0 |
| D | 0 | 76 | 0 |
| Mode M0 | |||
|---|---|---|---|
| Quadrant | BADHDUFLAG | Total packets | Discarded packets |
| A | 0 | 8220 | 2 |
| B | 0 | 7984 | 1 |
| C | 0 | 8643 | 1 |
| D | 0 | 9215 | 1 |
| Mode M9 | |||
|---|---|---|---|
| Quadrant | BADHDUFLAG | Total packets | Discarded packets |
| A | 0 | 4 | 0 |
| B | 0 | 4 | 0 |
| C | 0 | 4 | 0 |
| D | 0 | 4 | 0 |
| Quadrant | Total seconds | Saturated seconds | Saturation percentage |
|---|---|---|---|
| A | 3744 | 39 | 1.041667% |
| B | 3744 | 44 | 1.175214% |
| C | 3744 | 38 | 1.014957% |
| D | 3744 | 115 | 3.071581% |
Noise dominated data is calculated using 1-second bins in cleaned event files. If a bin has >2000 counts, and if more than 50% of those come from <1% of pixels, then it is considered to be noise-dominated and hence unusable.
| Quadrant | # 1 sec bins | Bins with >0 counts | Bins with >2000 counts | High rate bins dominated by noise | Noise dominated (total time) | Noise dominated (detector-on time) | Marked lightcurve |
|---|---|---|---|---|---|---|---|
| A | 4165 | 3746 | 1 | 1 | 0.02% | 0.03% | 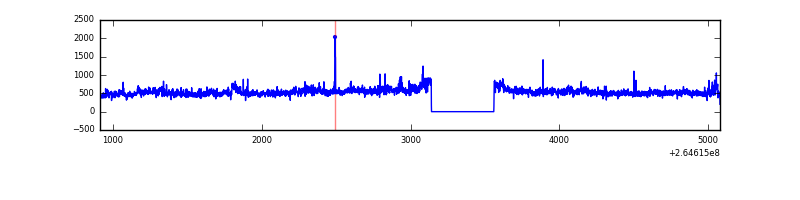 |
| B | 4165 | 3746 | 4 | 4 | 0.10% | 0.11% | 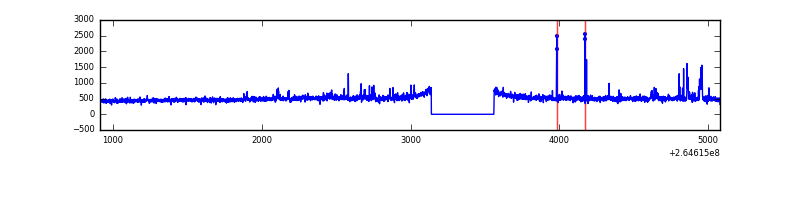 |
| C | 4165 | 3746 | 0 | 0 | 0.00% | 0.00% | 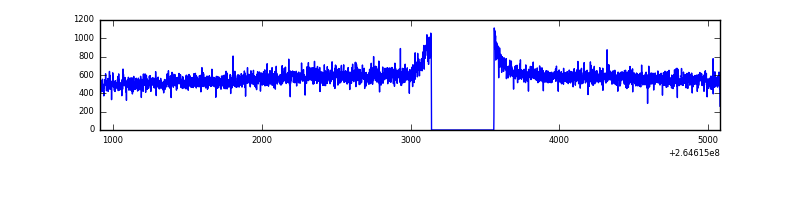 |
| D | 4165 | 3746 | 55 | 55 | 1.32% | 1.47% | 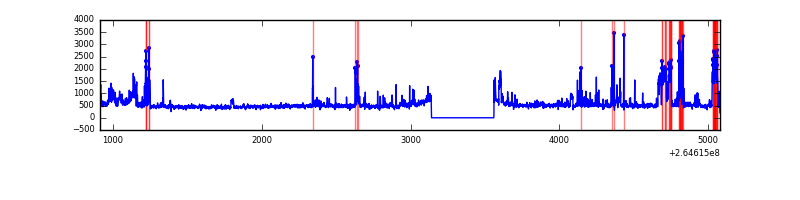 |
Top three noisy pixels from each quadrant. If the there are fewer than three noisy pixels in the level2.evt file, extra rows are filled as -1
| Pixel properties | Quadrant properties | ||||||
|---|---|---|---|---|---|---|---|
| Quadrant | DetID | PixID | Counts | Sigma | Mean | Median | Sigma |
| A | 13 | 210 | 73960 | 751.89 | 471 | 461 | 97.8 |
| A | 12 | 189 | 70392 | 715.39 | 471 | 461 | 97.8 |
| A | 8 | 15 | 63954 | 649.53 | 471 | 461 | 97.8 |
| B | 0 | 189 | 29982 | 321.95 | 466 | 454 | 91.7 |
| B | 0 | 229 | 28412 | 304.83 | 466 | 454 | 91.7 |
| B | 0 | 219 | 16357 | 173.39 | 466 | 454 | 91.7 |
| C | 3 | 233 | 382378 | 3594.89 | 450 | 452 | 106.2 |
| C | 13 | 61 | 3363 | 27.4 | 450 | 452 | 106.2 |
| C | 3 | 232 | 2783 | 21.94 | 450 | 452 | 106.2 |
| D | 5 | 222 | 347240 | 3159.11 | 451 | 440 | 109.8 |
| D | 12 | 110 | 178293 | 1620.12 | 451 | 440 | 109.8 |
| D | 2 | 152 | 16711 | 148.22 | 451 | 440 | 109.8 |
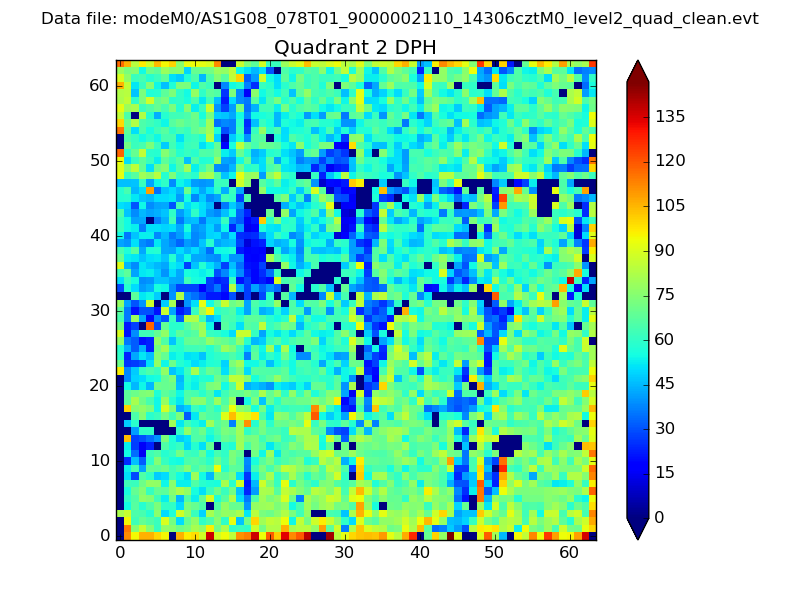
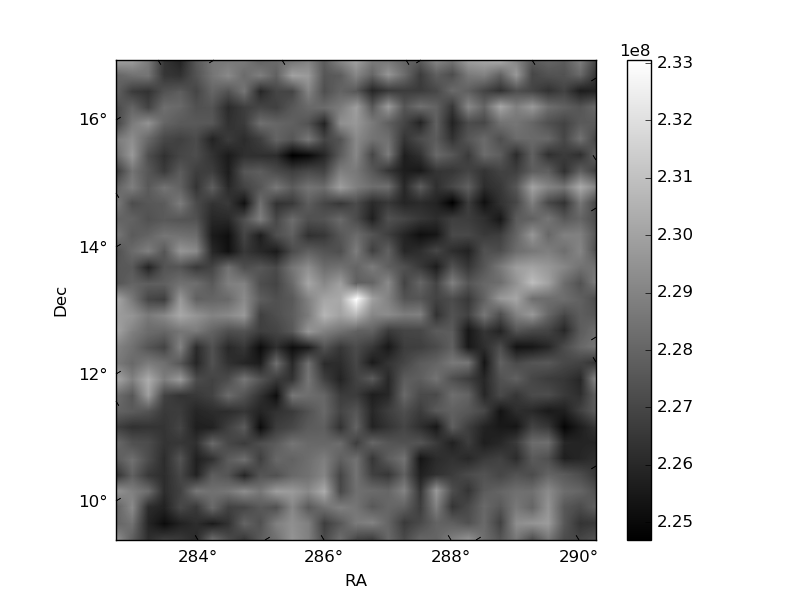
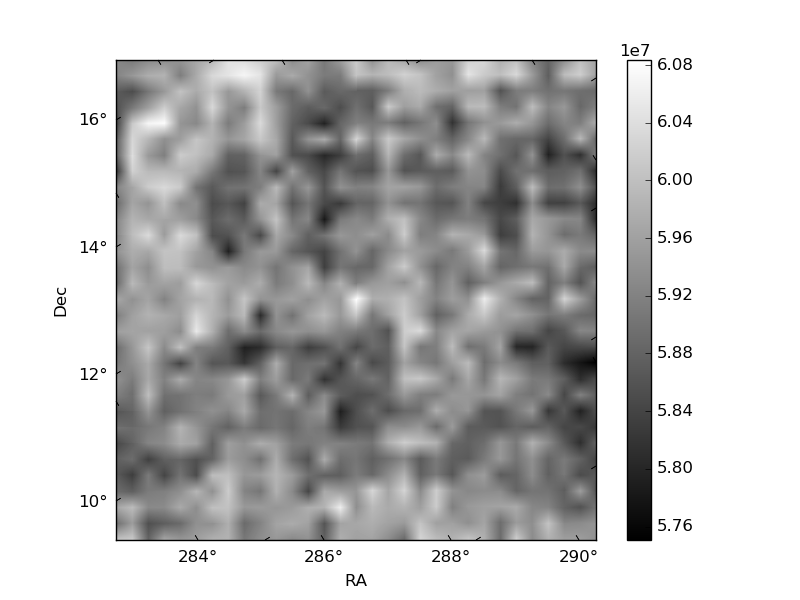
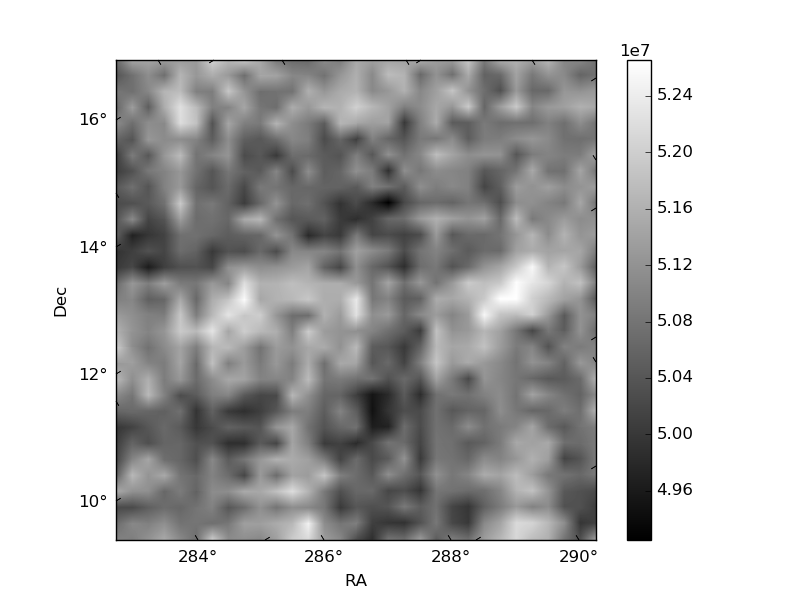
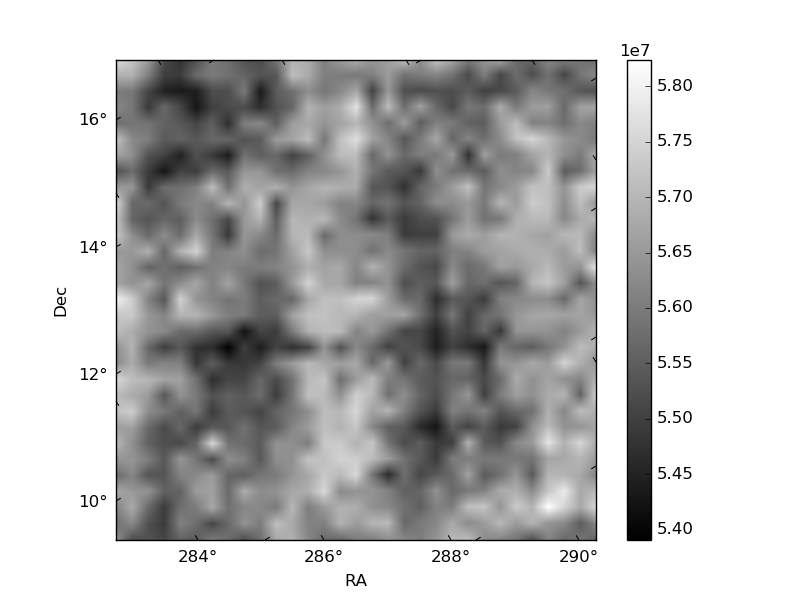
Histogram calculated using DETX and DETY for each event in the final _common_clean file
| Quadrant A | 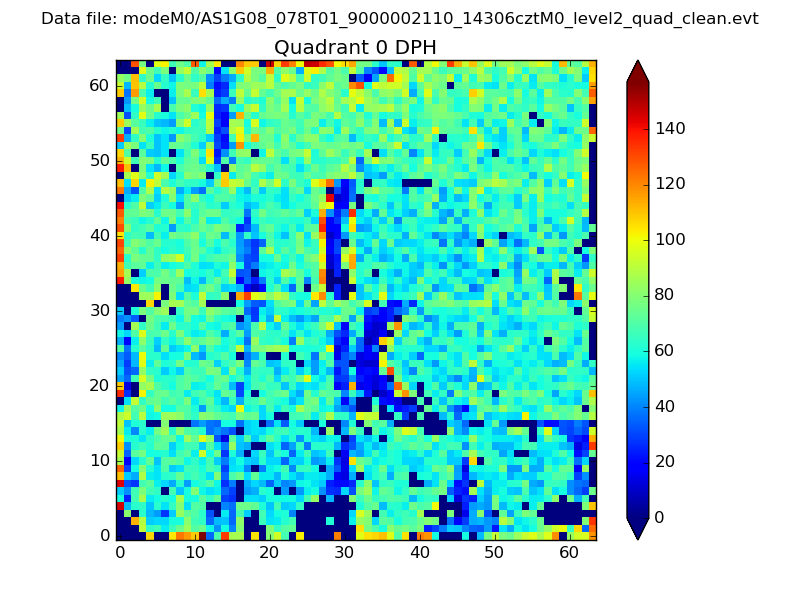 |
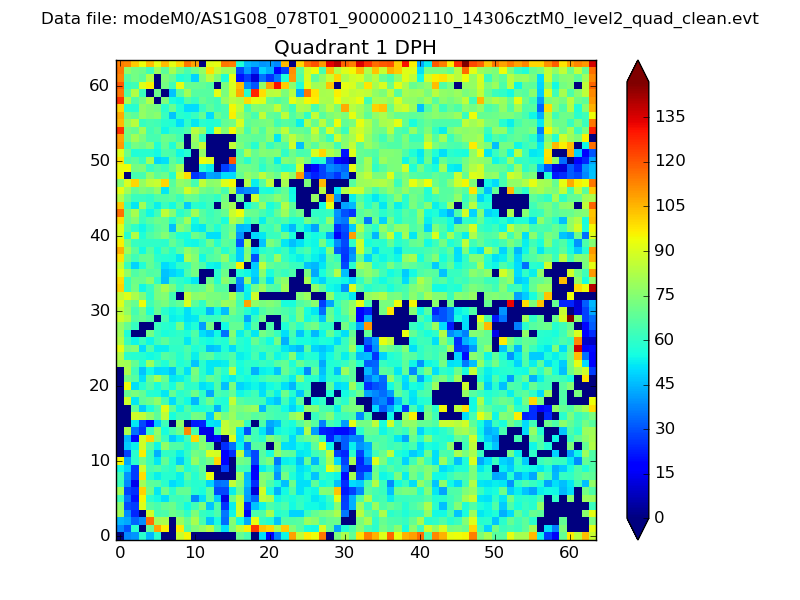 |
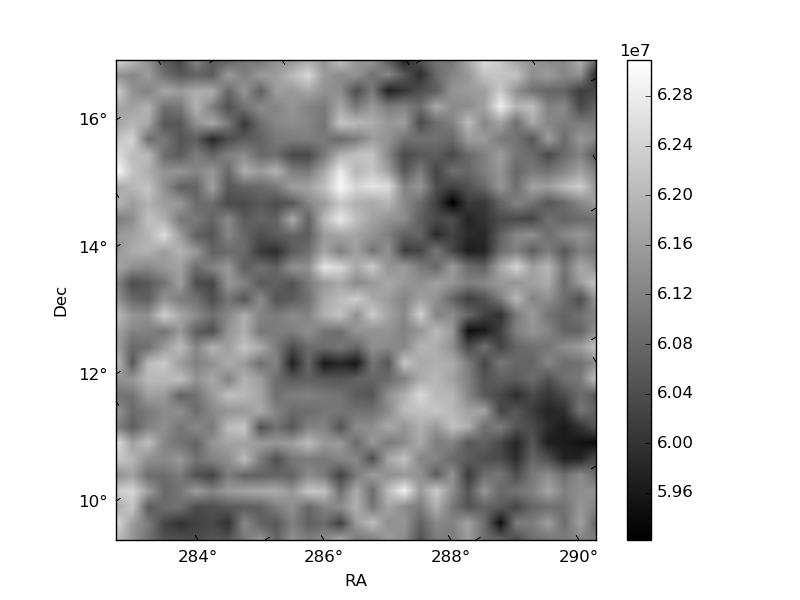
Quadrant B |
|---|---|---|---|
| Quadrant D | 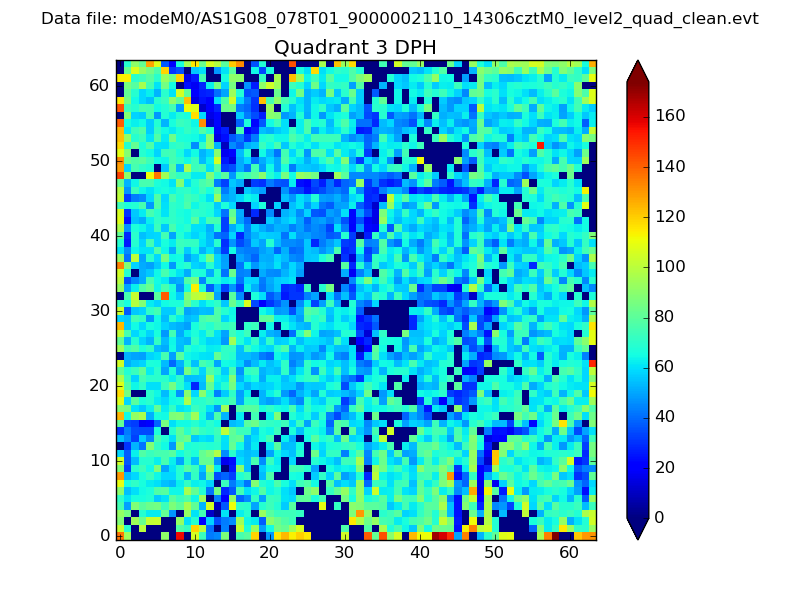 |
 |
Quadrant C |
| Plot type | Count rate plots | Images |
|---|---|---|
| Comparison with Poisson distribution Blue bars denote a histogram of data divided into 1 sec bins. Red curve is a Poisson curve with rate = median count rate of data. |
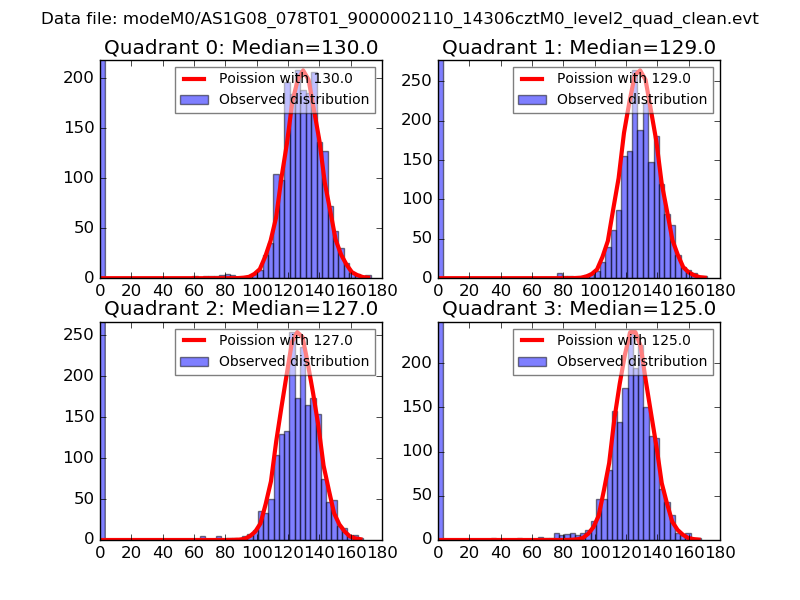 |
 |
| Quadrant-wise count rates Data is divided into 100 sec bins |
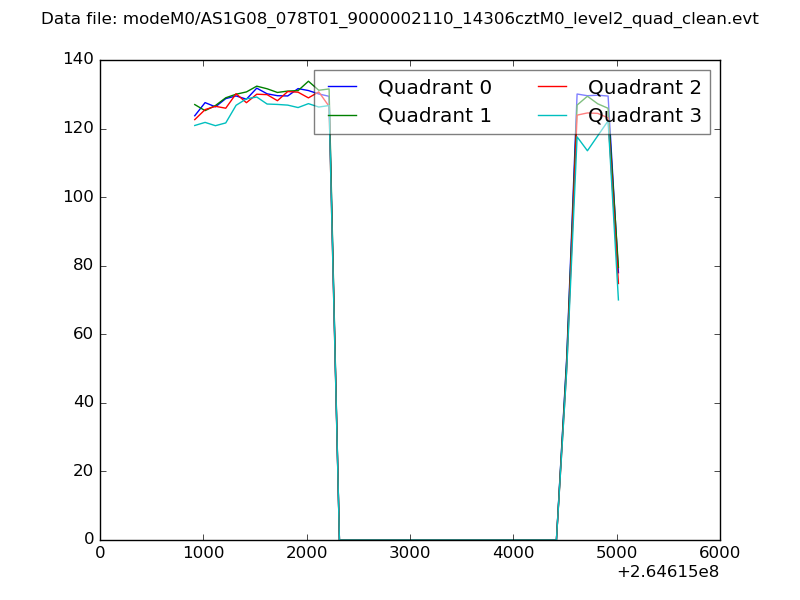 |
|
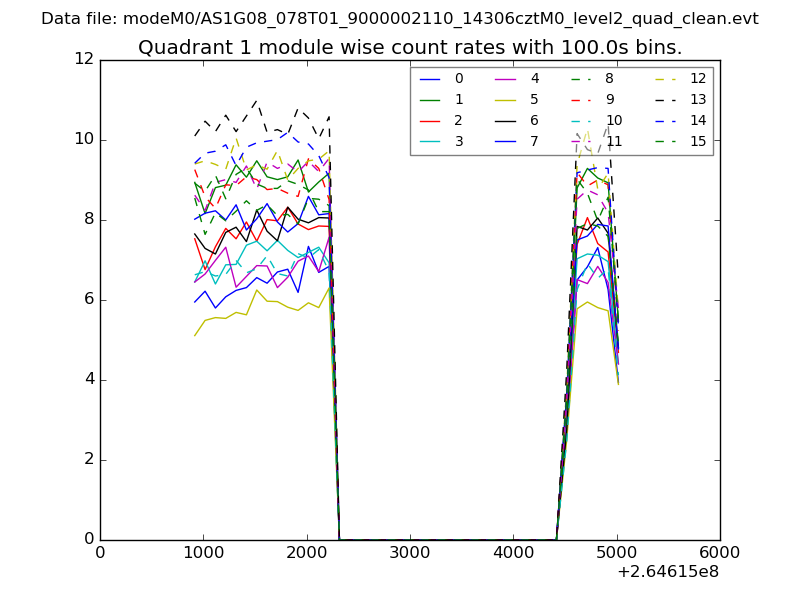
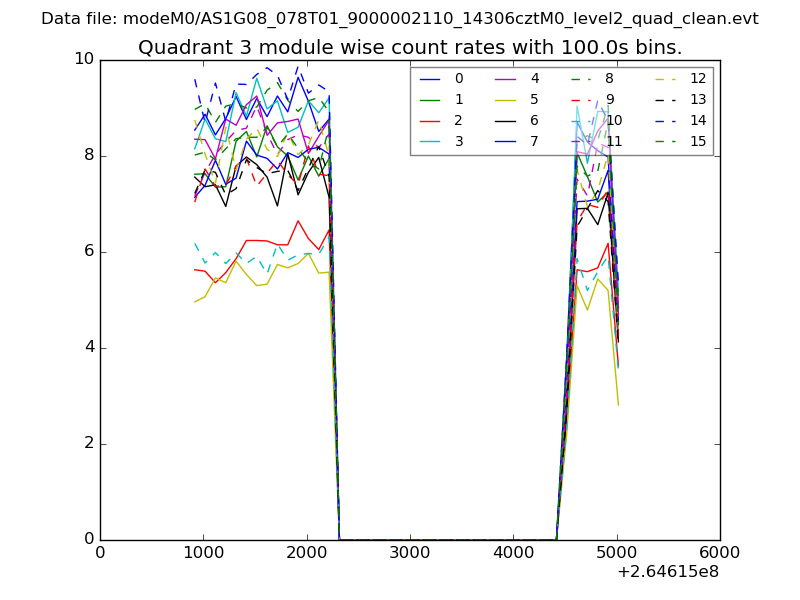
| Module-wise count rates for Quadrant A Data is divided into 100 sec bins |
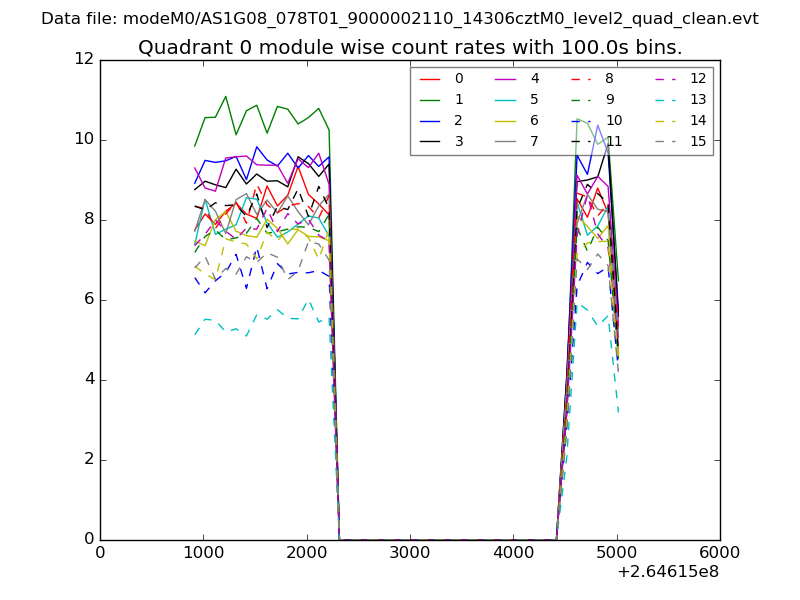 |
 |
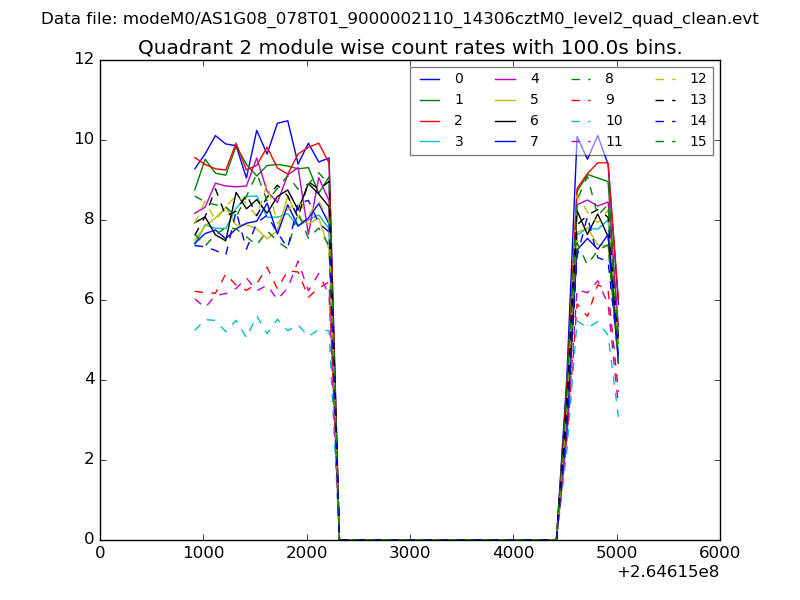
| Module-wise count rates for Quadrant B Data is divided into 100 sec bins |
 |
 |
| Module-wise count rates for Quadrant C Data is divided into 100 sec bins |
 |
 |
| Module-wise count rates for Quadrant D Data is divided into 100 sec bins |
 |
 |
| Parameter | Plot |
|---|---|
| CZT HV Monitor | 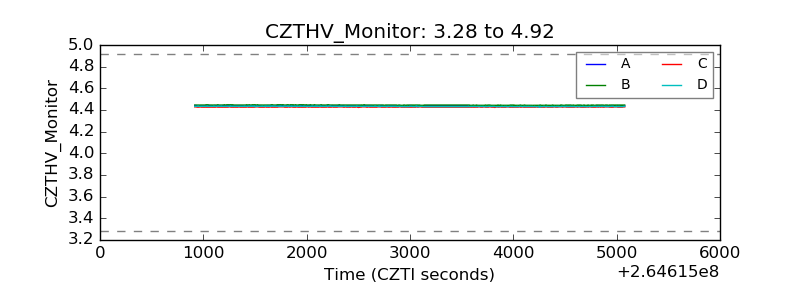 |
| D_VDD | 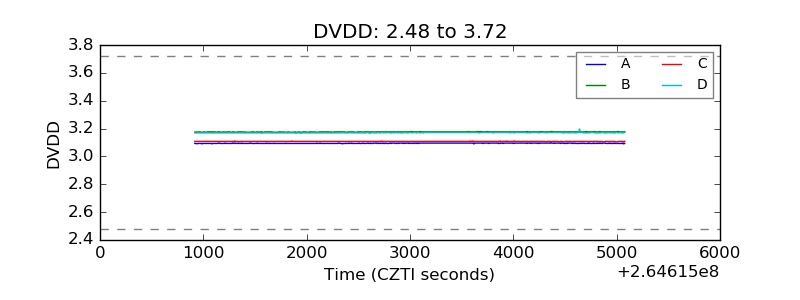 |
| Temperature 1 |  |
| Veto HV Monitor | 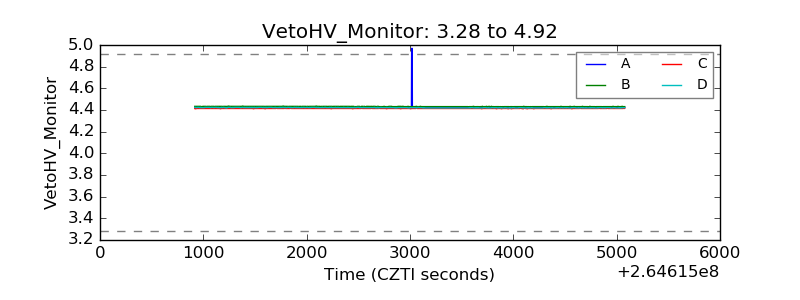 |
| Veto LLD | 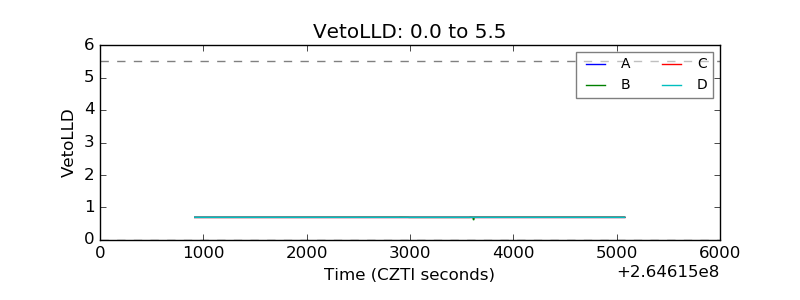 |
| Alpha Counter | 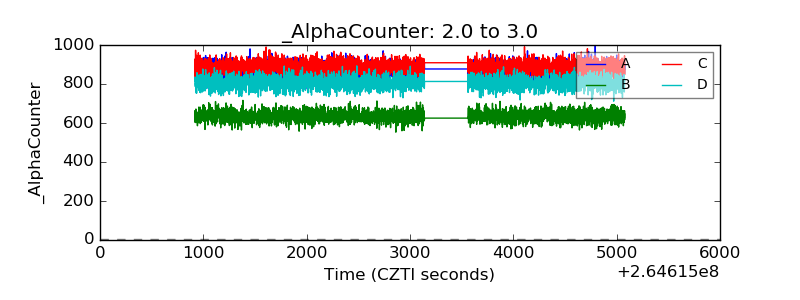 |
| _CPM_Rate | 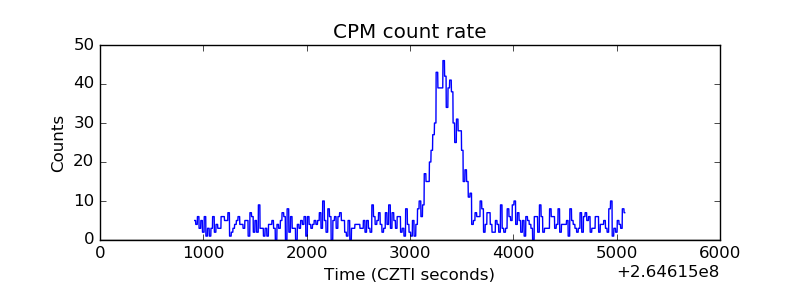 |
| CZT Counter | 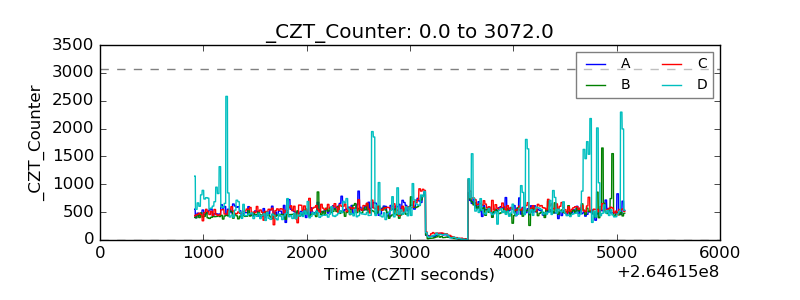 |
| +2.5 Volts monitor |  |
| +5 Volts monitor |  |
| _ROLL_ROT | 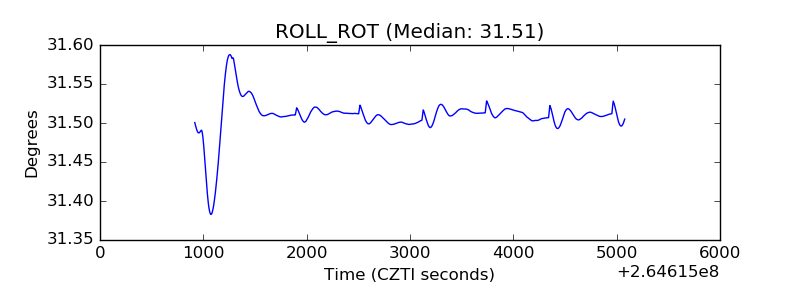 |
| _Roll_DEC | 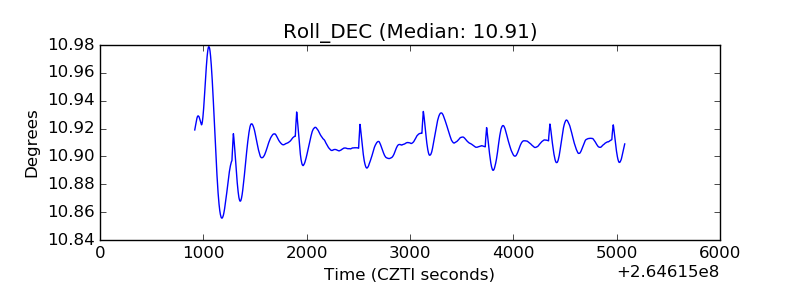 |
| _Roll_RA | 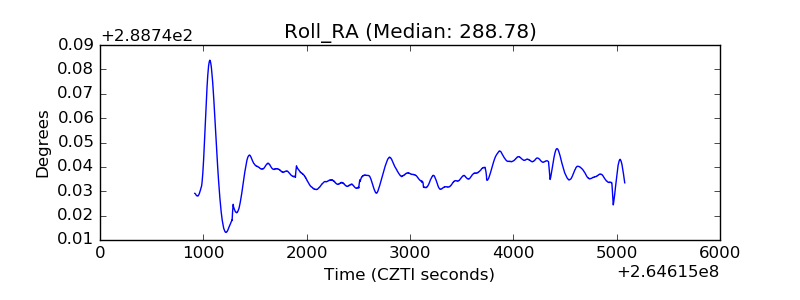 |
| Veto Counter | 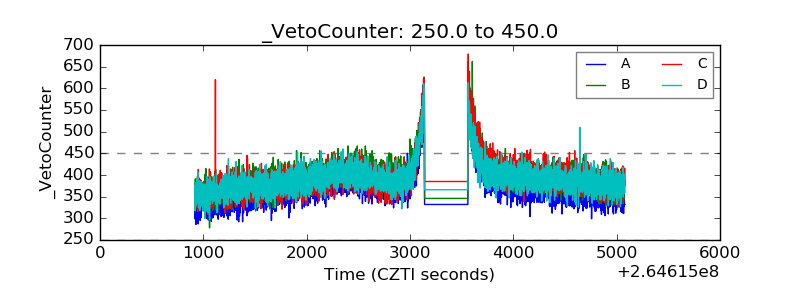 |