| Param | Original file | Final file |
|---|---|---|
| Filename | modeM0/AS1G08_078T01_9000002110_14308cztM0_level2.evt | modeM0/AS1G08_078T01_9000002110_14308cztM0_level2_quad_clean.evt |
| Size (bytes) | 738,668,160 | 132,863,040 |
| Size | 704.4 MB | 126.7 MB |
| Events in quadrant A | 4,981,273 | 841,953 |
| Events in quadrant B | 5,202,570 | 835,802 |
| Events in quadrant C | 5,560,243 | 827,224 |
| Events in quadrant D | 5,931,165 | 807,795 |
| Mode SS | |||
|---|---|---|---|
| Quadrant | BADHDUFLAG | Total packets | Discarded packets |
| A | 0 | 210 | 0 |
| B | 0 | 210 | 0 |
| C | 0 | 210 | 0 |
| D | 0 | 210 | 0 |
| Mode M0 | |||
|---|---|---|---|
| Quadrant | BADHDUFLAG | Total packets | Discarded packets |
| A | 0 | 21614 | 3 |
| B | 0 | 22215 | 2 |
| C | 0 | 22499 | 2 |
| D | 0 | 24818 | 2 |
| Mode M9 | |||
|---|---|---|---|
| Quadrant | BADHDUFLAG | Total packets | Discarded packets |
| A | 0 | 9 | 0 |
| B | 0 | 9 | 0 |
| C | 0 | 9 | 0 |
| D | 0 | 9 | 0 |
| Quadrant | Total seconds | Saturated seconds | Saturation percentage |
|---|---|---|---|
| A | 10264 | 67 | 0.652767% |
| B | 10264 | 111 | 1.081450% |
| C | 10264 | 59 | 0.574825% |
| D | 10264 | 342 | 3.332034% |
Noise dominated data is calculated using 1-second bins in cleaned event files. If a bin has >2000 counts, and if more than 50% of those come from <1% of pixels, then it is considered to be noise-dominated and hence unusable.
| Quadrant | # 1 sec bins | Bins with >0 counts | Bins with >2000 counts | High rate bins dominated by noise | Noise dominated (total time) | Noise dominated (detector-on time) | Marked lightcurve |
|---|---|---|---|---|---|---|---|
| A | 11255 | 10267 | 2 | 2 | 0.02% | 0.02% | 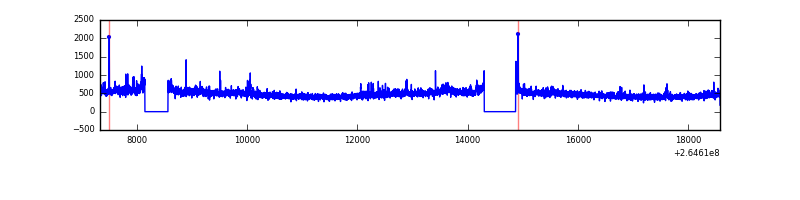 |
| B | 11255 | 10267 | 16 | 16 | 0.14% | 0.16% | 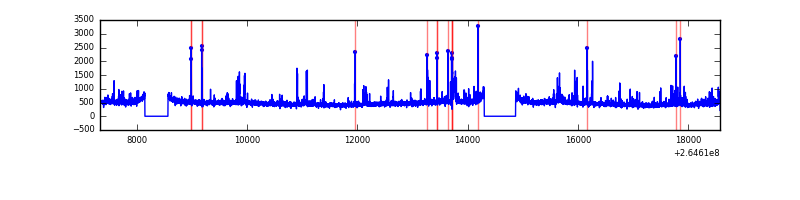 |
| C | 11255 | 10267 | 1 | 1 | 0.01% | 0.01% | 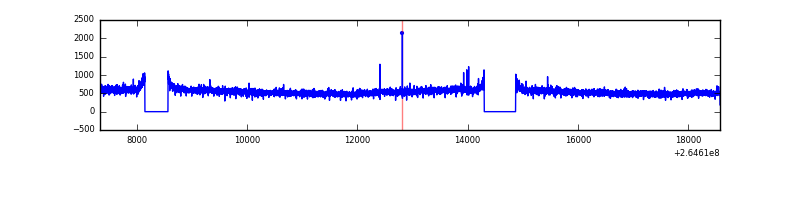 |
| D | 11255 | 10267 | 219 | 219 | 1.95% | 2.13% | 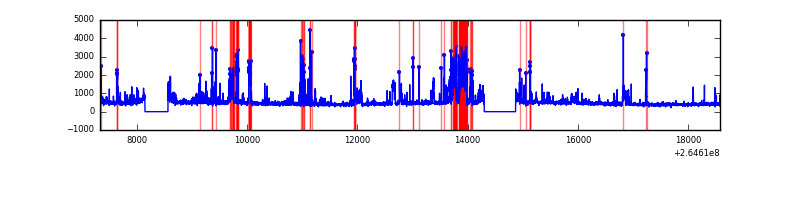 |
Top three noisy pixels from each quadrant. If the there are fewer than three noisy pixels in the level2.evt file, extra rows are filled as -1
| Pixel properties | Quadrant properties | ||||||
|---|---|---|---|---|---|---|---|
| Quadrant | DetID | PixID | Counts | Sigma | Mean | Median | Sigma |
| A | 8 | 15 | 133592 | 534.67 | 1217 | 1192 | 247.6 |
| A | 12 | 189 | 103820 | 414.44 | 1217 | 1192 | 247.6 |
| A | 13 | 210 | 41793 | 163.96 | 1217 | 1192 | 247.6 |
| B | 0 | 229 | 239714 | 1023.7 | 1212 | 1185 | 233.0 |
| B | 10 | 245 | 90303 | 382.47 | 1212 | 1185 | 233.0 |
| B | 0 | 189 | 41359 | 172.42 | 1212 | 1185 | 233.0 |
| C | 3 | 233 | 948161 | 3446.8 | 1180 | 1188 | 274.7 |
| C | 13 | 61 | 8518 | 26.68 | 1180 | 1188 | 274.7 |
| C | 3 | 232 | 5741 | 16.57 | 1180 | 1188 | 274.7 |
| D | 5 | 222 | 830009 | 2970.89 | 1169 | 1141 | 279.0 |
| D | 12 | 110 | 396150 | 1415.82 | 1169 | 1141 | 279.0 |
| D | 10 | 70 | 103079 | 365.37 | 1169 | 1141 | 279.0 |
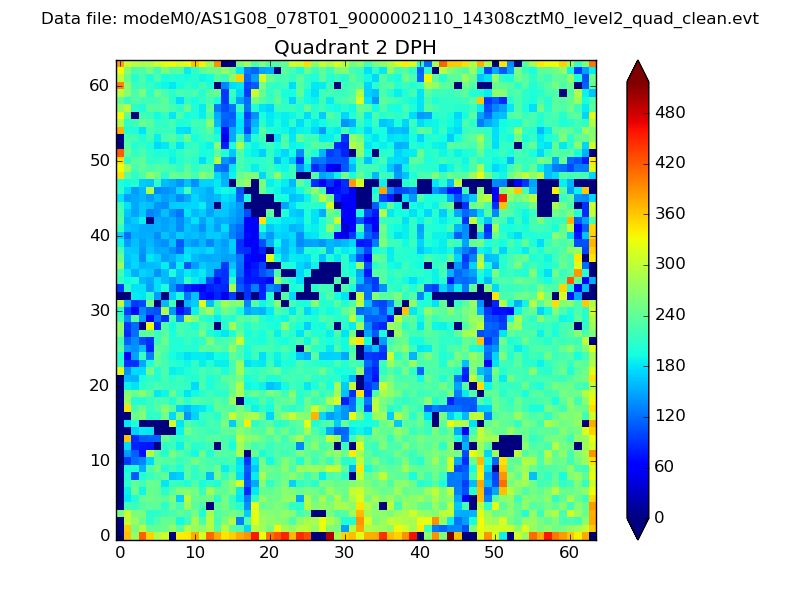
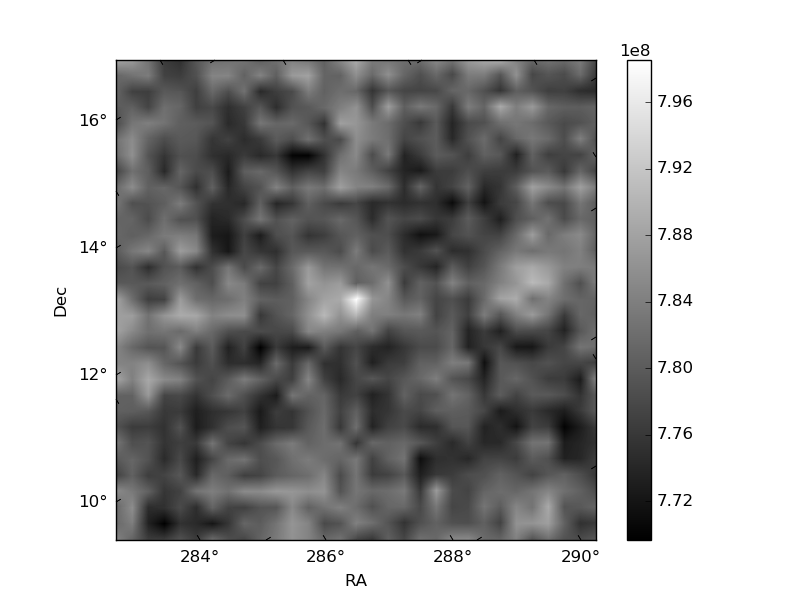
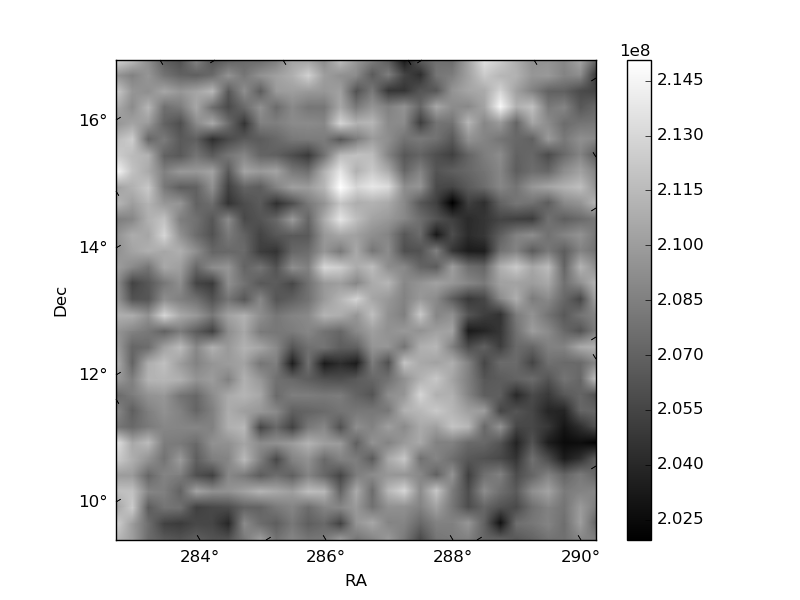
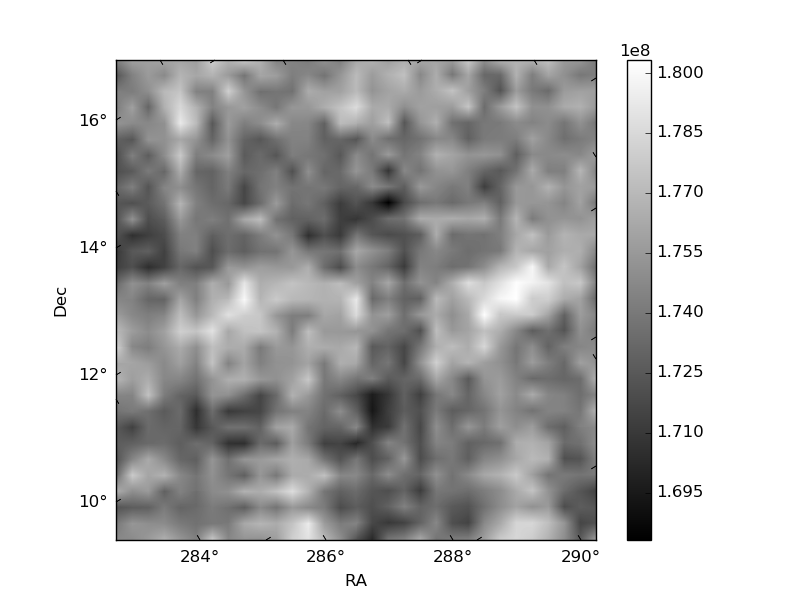
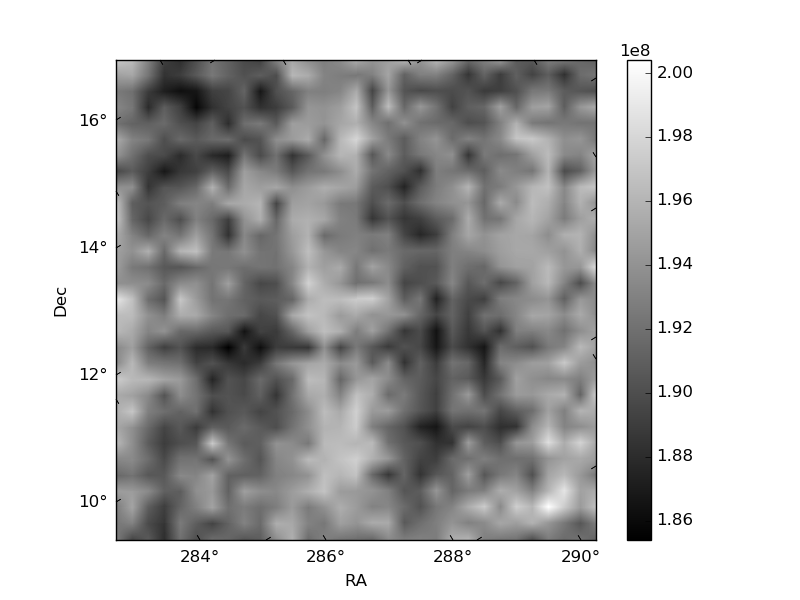
Histogram calculated using DETX and DETY for each event in the final _common_clean file
| Quadrant A | 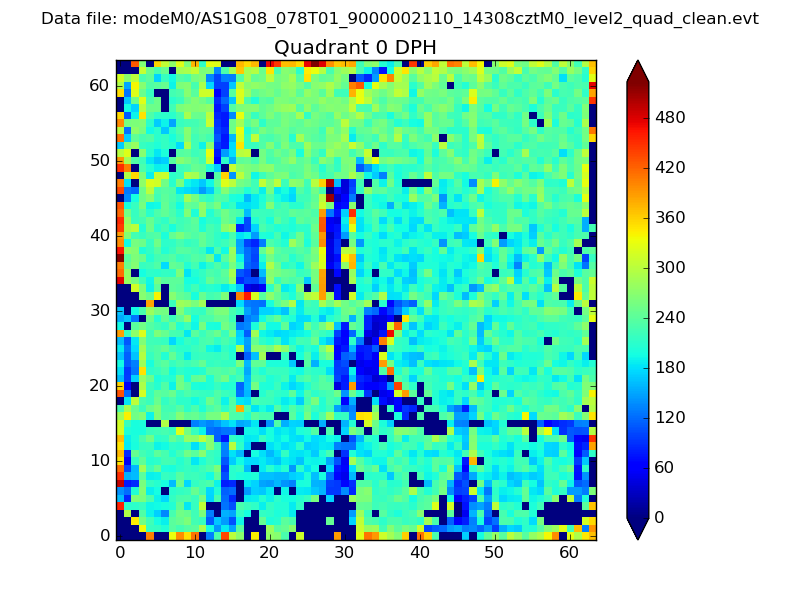 |
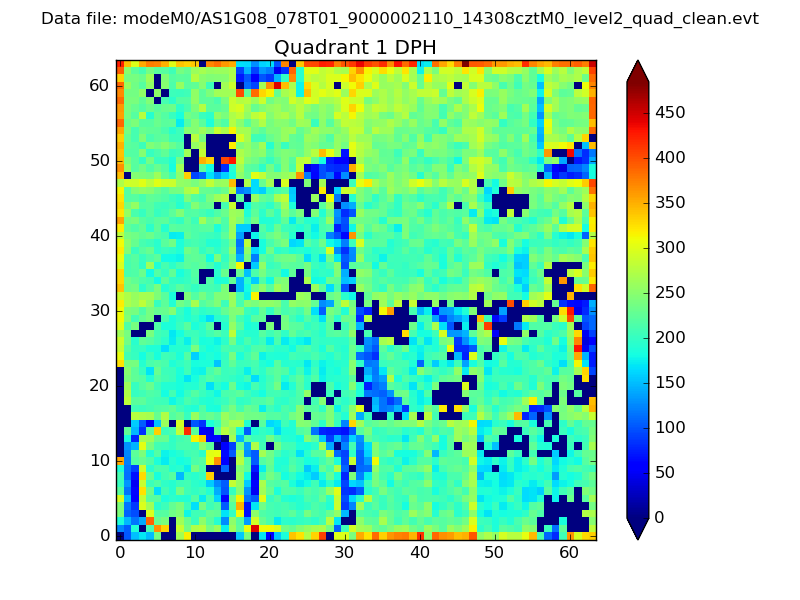 |
Quadrant B |
|---|---|---|---|
| Quadrant D | 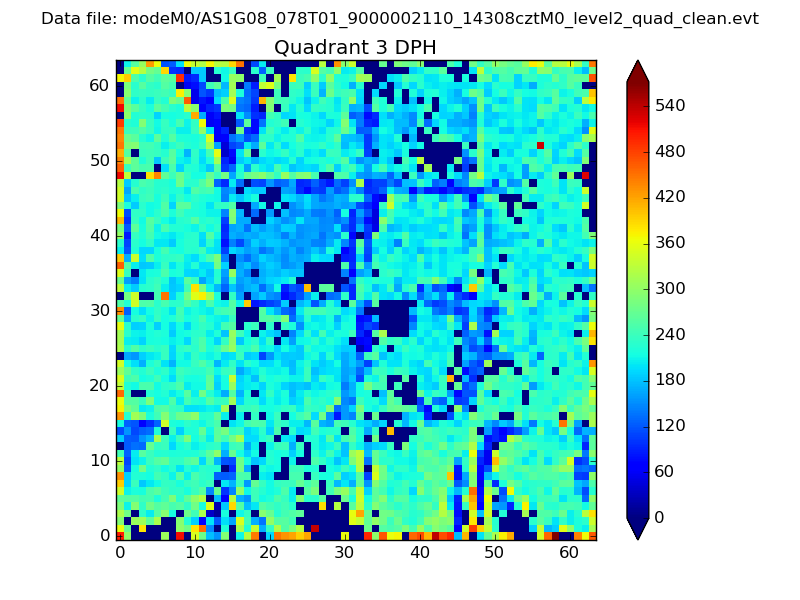 |
 |
Quadrant C |
| Plot type | Count rate plots | Images |
|---|---|---|
| Comparison with Poisson distribution Blue bars denote a histogram of data divided into 1 sec bins. Red curve is a Poisson curve with rate = median count rate of data. |
 |
 |
| Quadrant-wise count rates Data is divided into 100 sec bins |
 |
|
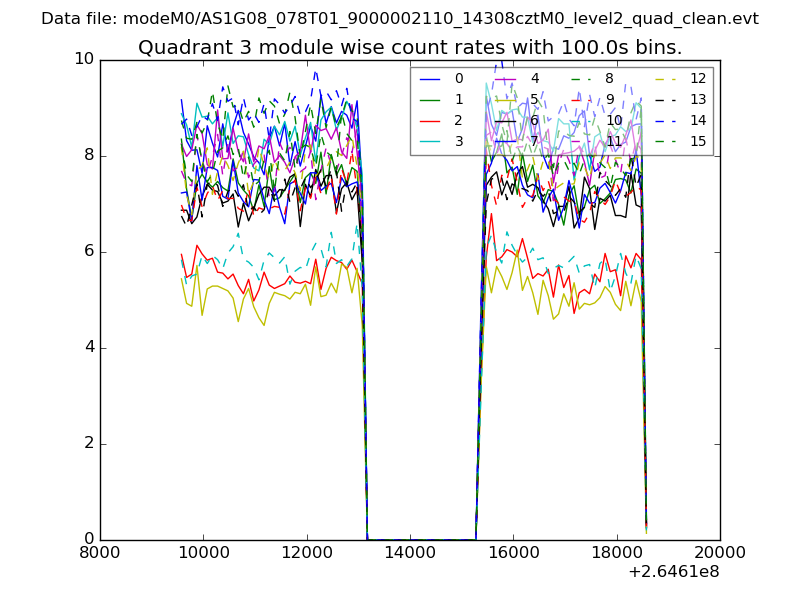
| Module-wise count rates for Quadrant A Data is divided into 100 sec bins |
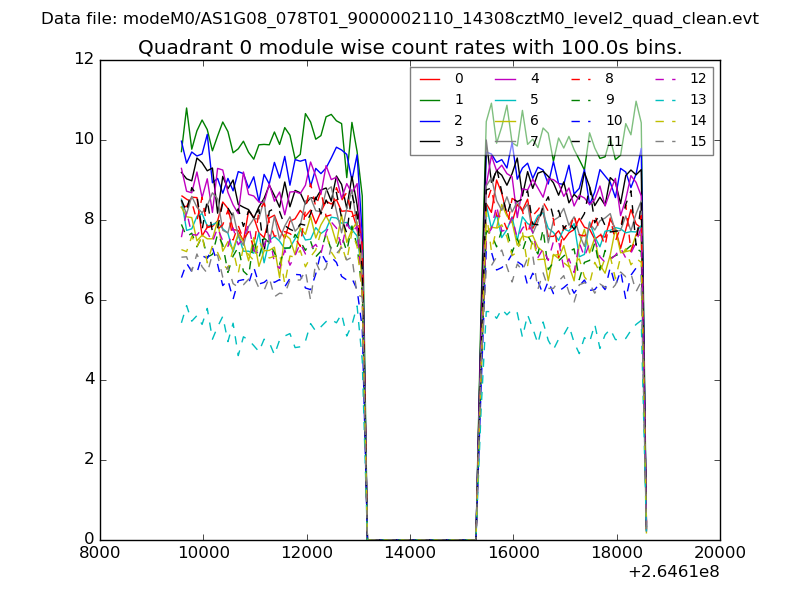 |
 |
| Module-wise count rates for Quadrant B Data is divided into 100 sec bins |
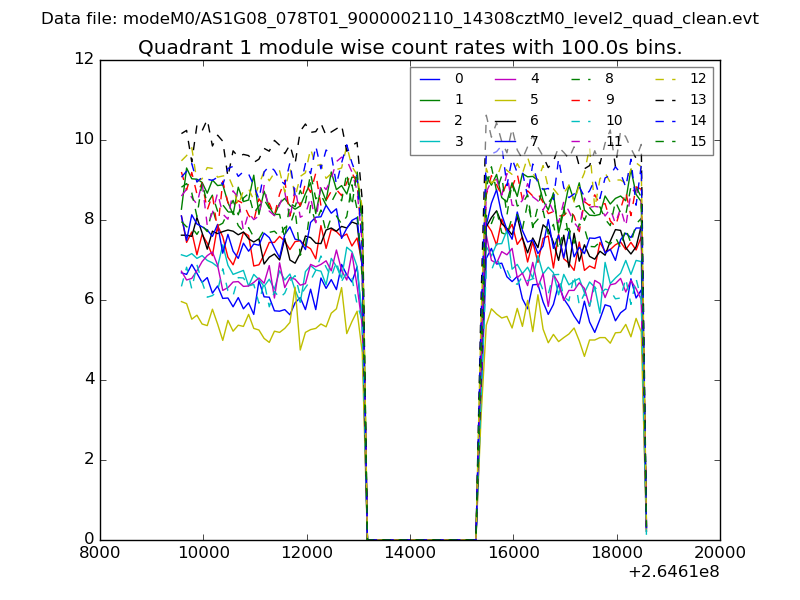 |
 |
| Module-wise count rates for Quadrant C Data is divided into 100 sec bins |
 |
 |
| Module-wise count rates for Quadrant D Data is divided into 100 sec bins |
 |
 |
| Parameter | Plot |
|---|---|
| CZT HV Monitor |  |
| D_VDD | 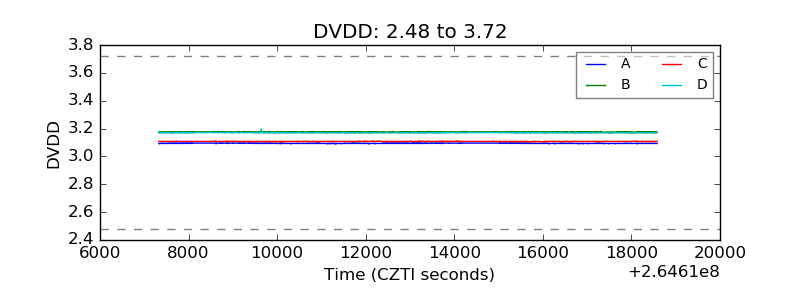 |
| Temperature 1 | 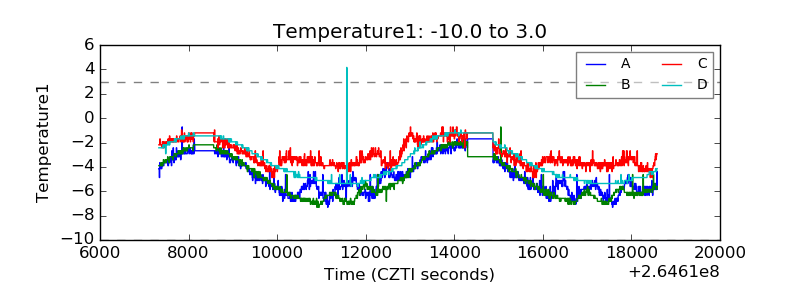 |
| Veto HV Monitor | 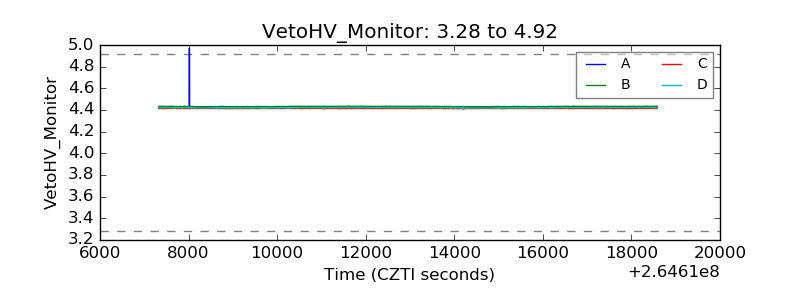 |
| Veto LLD | 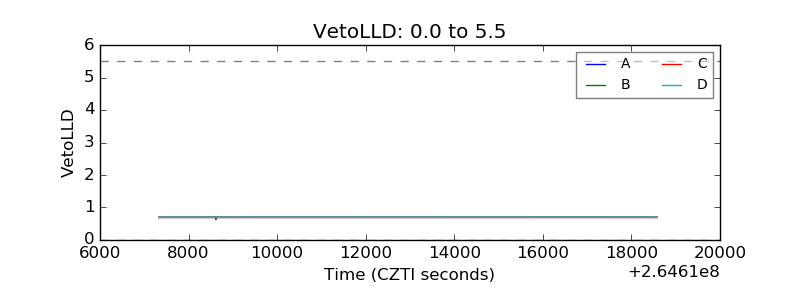 |
| Alpha Counter |  |
| _CPM_Rate | 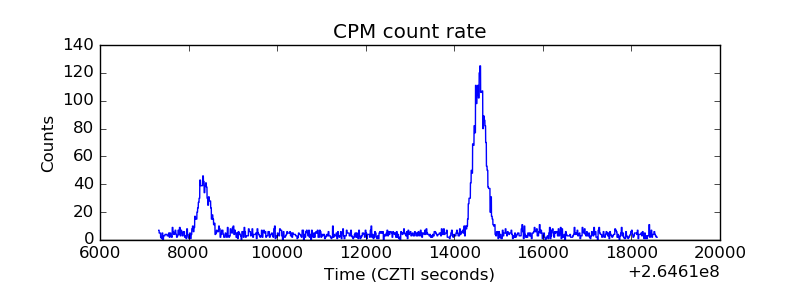 |
| CZT Counter | 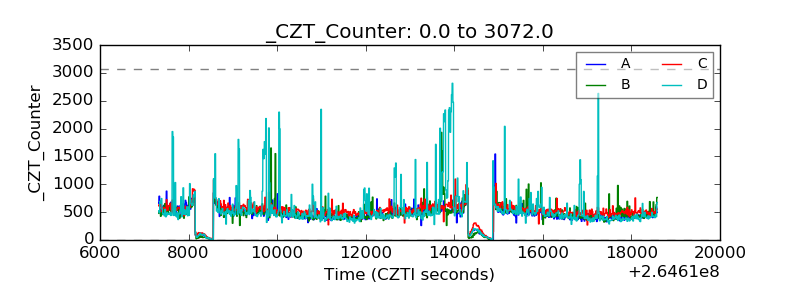 |
| +2.5 Volts monitor |  |
| +5 Volts monitor |  |
| _ROLL_ROT | 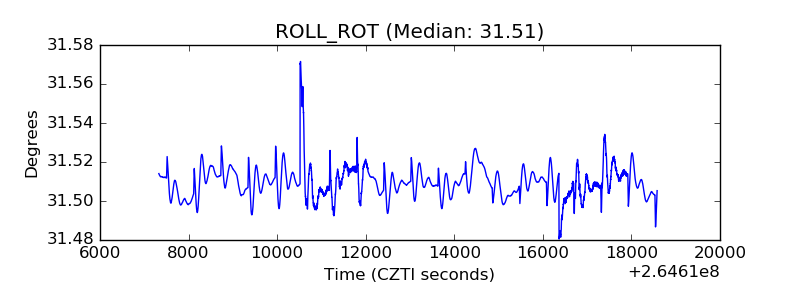 |
| _Roll_DEC | 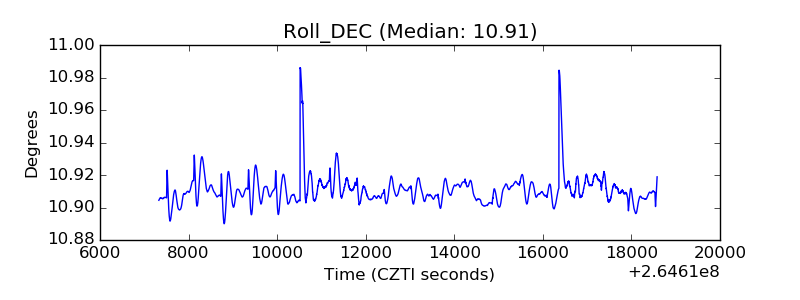 |
| _Roll_RA | 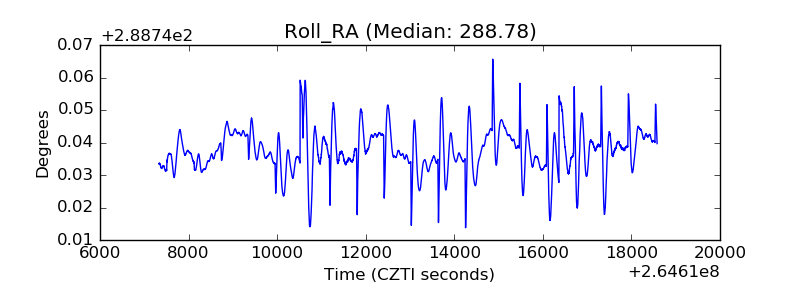 |
| Veto Counter | 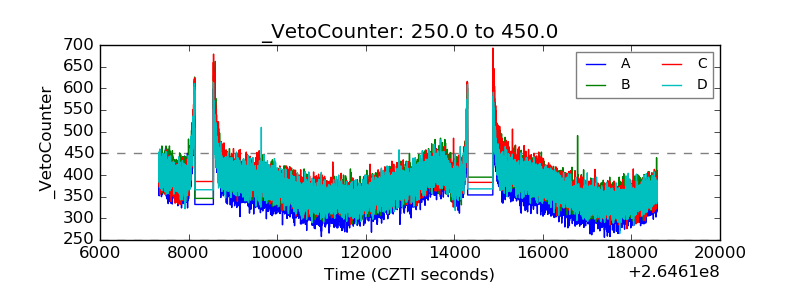 |