| Param | Original file | Final file |
|---|---|---|
| Filename | modeM0/AS1G08_078T01_9000002110_14309cztM0_level2.evt | modeM0/AS1G08_078T01_9000002110_14309cztM0_level2_quad_clean.evt |
| Size (bytes) | 683,893,440 | 121,006,080 |
| Size | 652.2 MB | 115.4 MB |
| Events in quadrant A | 4,492,047 | 763,675 |
| Events in quadrant B | 4,821,131 | 762,676 |
| Events in quadrant C | 4,829,914 | 759,503 |
| Events in quadrant D | 5,940,270 | 735,464 |
| Mode SS | |||
|---|---|---|---|
| Quadrant | BADHDUFLAG | Total packets | Discarded packets |
| A | 0 | 192 | 0 |
| B | 0 | 192 | 0 |
| C | 0 | 192 | 0 |
| D | 0 | 192 | 0 |
| Mode M0 | |||
|---|---|---|---|
| Quadrant | BADHDUFLAG | Total packets | Discarded packets |
| A | 0 | 19347 | 3 |
| B | 0 | 20259 | 2 |
| C | 0 | 19881 | 2 |
| D | 0 | 23937 | 2 |
| Mode M9 | |||
|---|---|---|---|
| Quadrant | BADHDUFLAG | Total packets | Discarded packets |
| A | 0 | 15 | 0 |
| B | 0 | 15 | 0 |
| C | 0 | 15 | 0 |
| D | 0 | 15 | 0 |
| Quadrant | Total seconds | Saturated seconds | Saturation percentage |
|---|---|---|---|
| A | 9268 | 45 | 0.485542% |
| B | 9268 | 139 | 1.499784% |
| C | 9268 | 63 | 0.679758% |
| D | 9268 | 356 | 3.841174% |
Noise dominated data is calculated using 1-second bins in cleaned event files. If a bin has >2000 counts, and if more than 50% of those come from <1% of pixels, then it is considered to be noise-dominated and hence unusable.
| Quadrant | # 1 sec bins | Bins with >0 counts | Bins with >2000 counts | High rate bins dominated by noise | Noise dominated (total time) | Noise dominated (detector-on time) | Marked lightcurve |
|---|---|---|---|---|---|---|---|
| A | 10864 | 9271 | 0 | 0 | 0.00% | 0.00% | 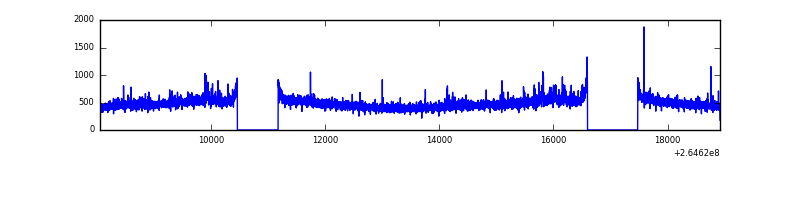 |
| B | 10864 | 9271 | 37 | 37 | 0.34% | 0.40% | 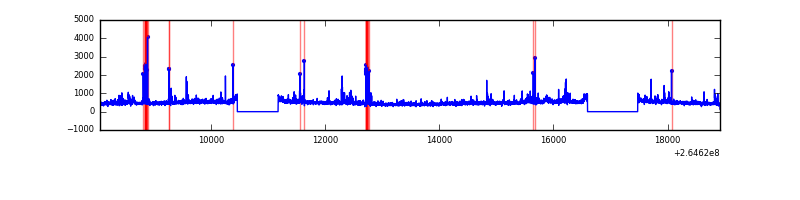 |
| C | 10864 | 9270 | 0 | 0 | 0.00% | 0.00% | 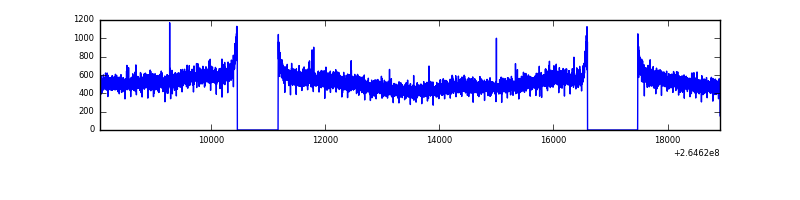 |
| D | 10864 | 9271 | 161 | 161 | 1.48% | 1.74% | 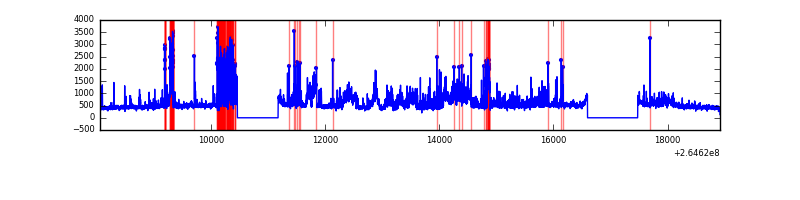 |
Top three noisy pixels from each quadrant. If the there are fewer than three noisy pixels in the level2.evt file, extra rows are filled as -1
| Pixel properties | Quadrant properties | ||||||
|---|---|---|---|---|---|---|---|
| Quadrant | DetID | PixID | Counts | Sigma | Mean | Median | Sigma |
| A | 12 | 189 | 105923 | 462.59 | 1123 | 1099 | 226.6 |
| A | 8 | 15 | 39350 | 168.8 | 1123 | 1099 | 226.6 |
| A | 9 | 143 | 15096 | 61.77 | 1123 | 1099 | 226.6 |
| B | 0 | 229 | 280011 | 1283.09 | 1119 | 1090 | 217.4 |
| B | 10 | 245 | 47394 | 213.01 | 1119 | 1090 | 217.4 |
| B | 0 | 189 | 44399 | 199.23 | 1119 | 1090 | 217.4 |
| C | 3 | 233 | 584282 | 2285.09 | 1089 | 1095 | 255.2 |
| C | 13 | 61 | 7711 | 25.92 | 1089 | 1095 | 255.2 |
| C | 14 | 234 | 2913 | 7.12 | 1089 | 1095 | 255.2 |
| D | 5 | 222 | 1157805 | 4557.62 | 1066 | 1041 | 253.8 |
| D | 12 | 110 | 667875 | 2627.31 | 1066 | 1041 | 253.8 |
| D | 10 | 199 | 40350 | 154.88 | 1066 | 1041 | 253.8 |
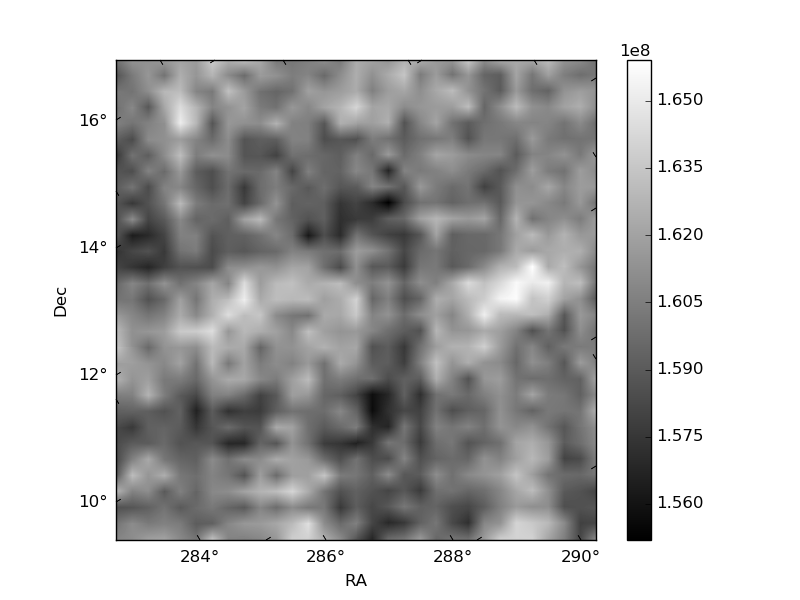
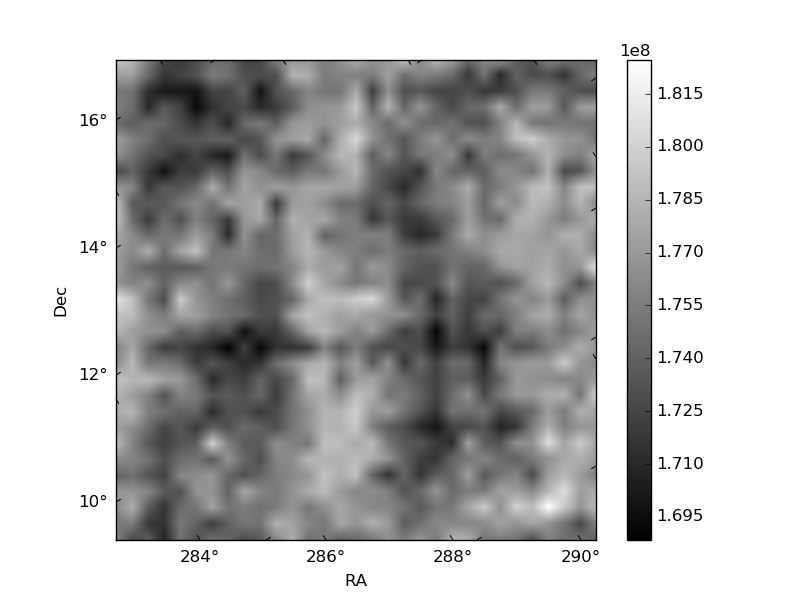
Histogram calculated using DETX and DETY for each event in the final _common_clean file
| Quadrant A | 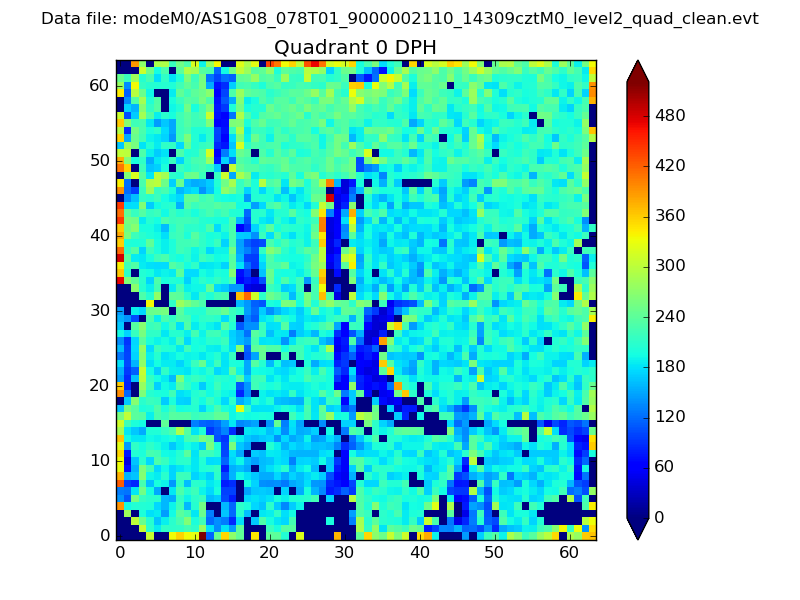 |
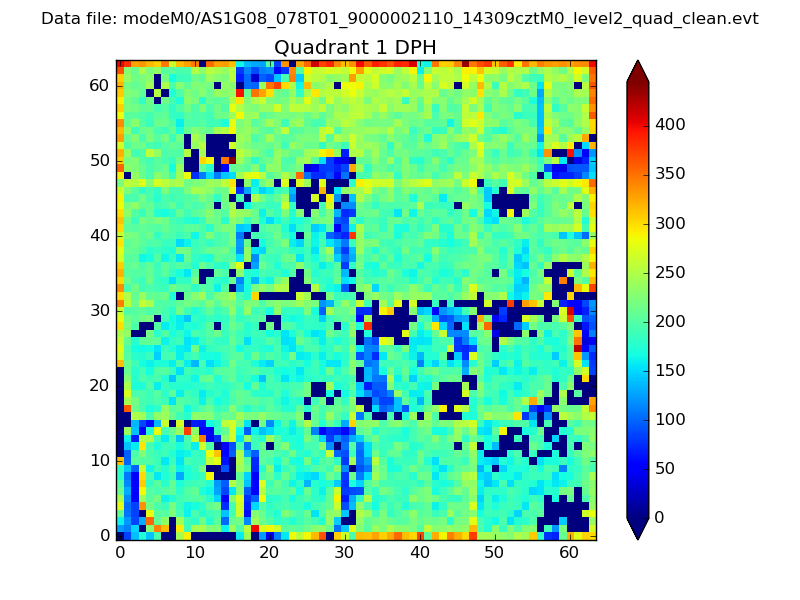 |
Quadrant B |
|---|---|---|---|
| Quadrant D | 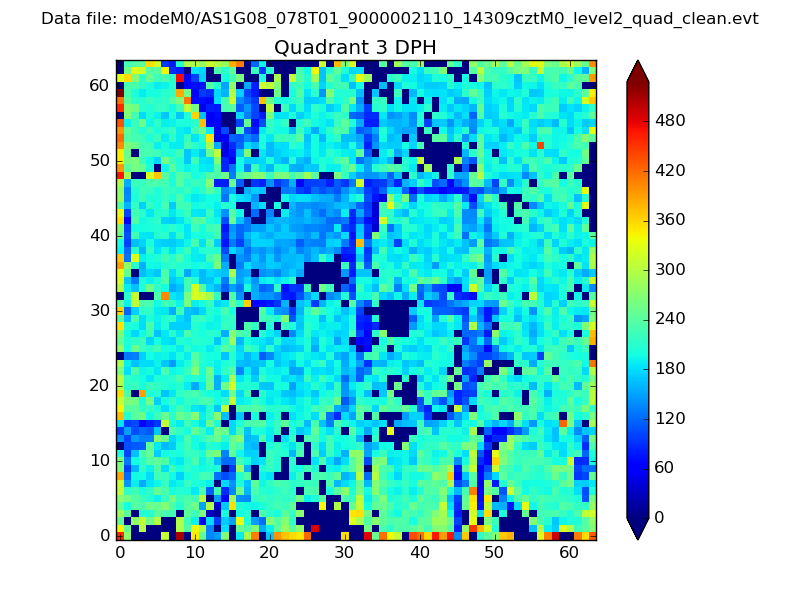 |
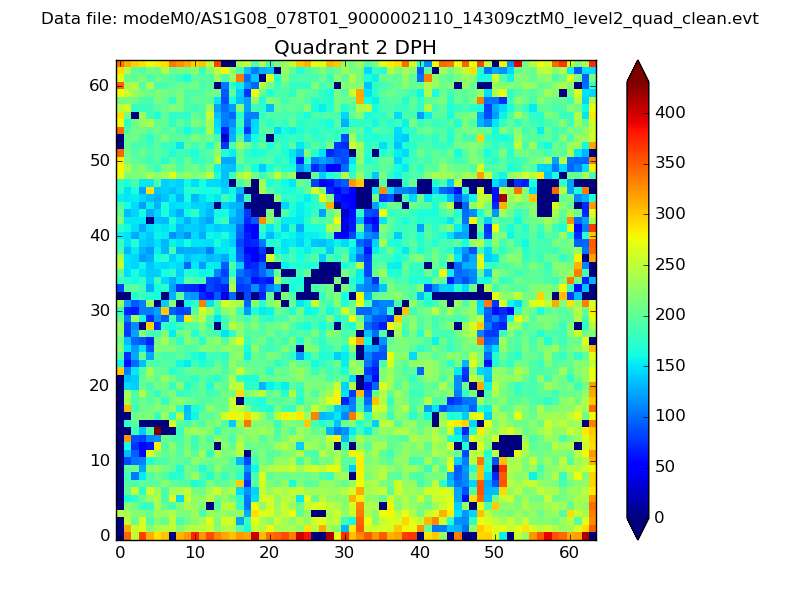 |
Quadrant C |
| Plot type | Count rate plots | Images |
|---|---|---|
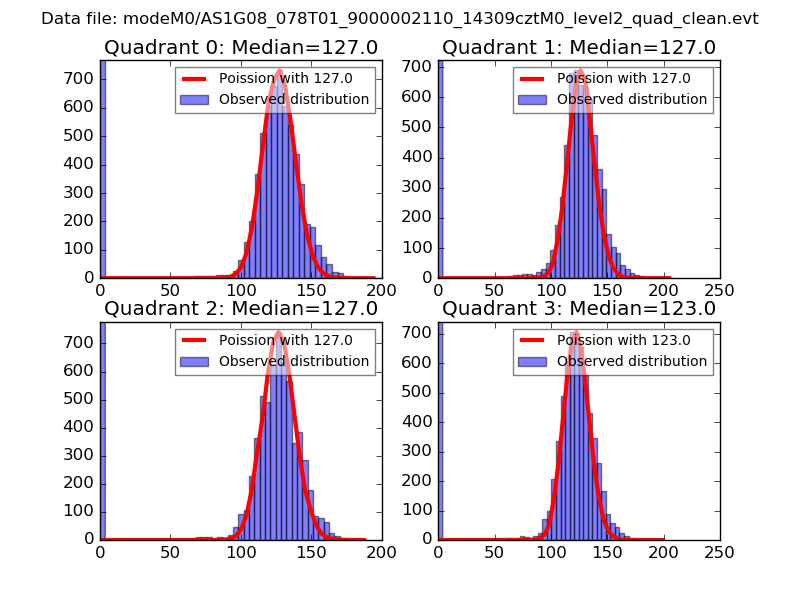
| Comparison with Poisson distribution Blue bars denote a histogram of data divided into 1 sec bins. Red curve is a Poisson curve with rate = median count rate of data. |
 |
 |
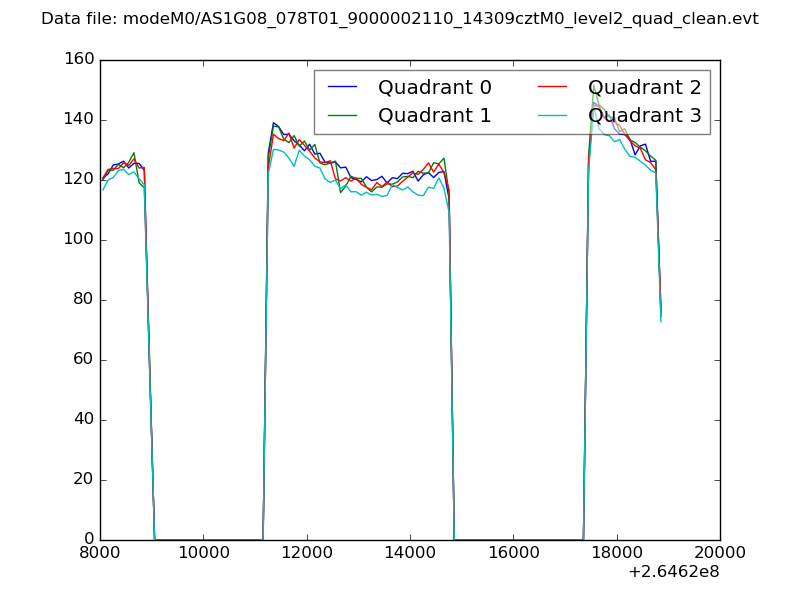
| Quadrant-wise count rates Data is divided into 100 sec bins |
 |
|
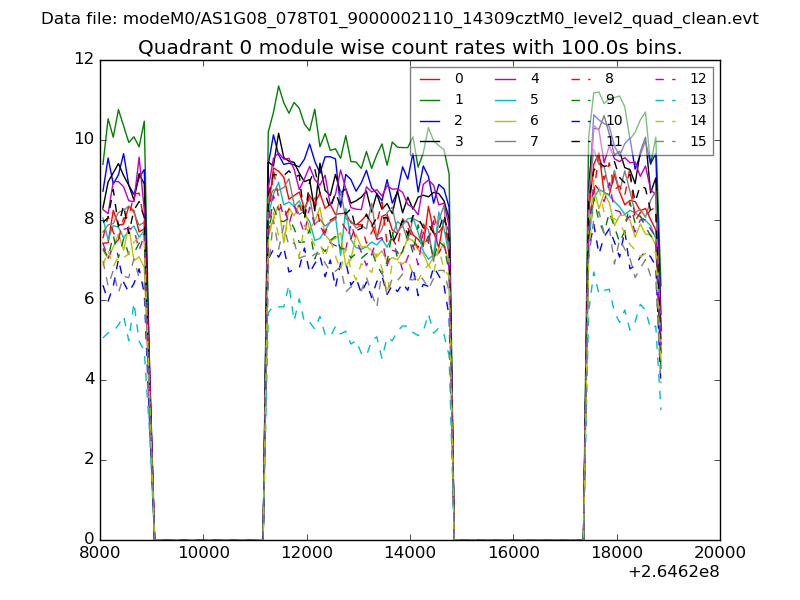
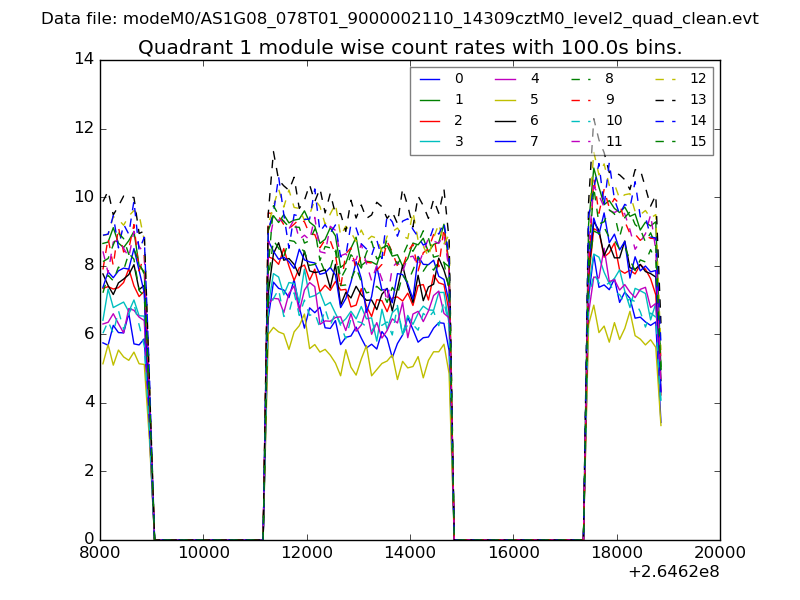
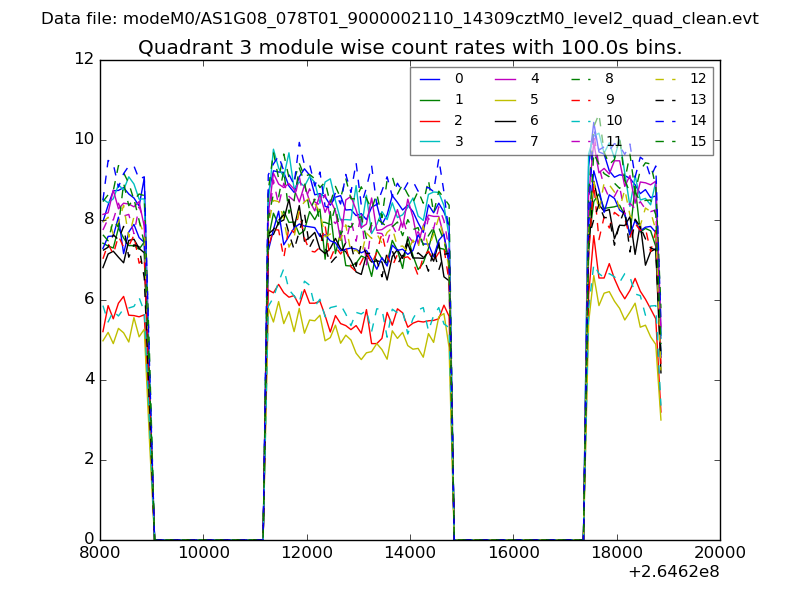
| Module-wise count rates for Quadrant A Data is divided into 100 sec bins |
 |
 |
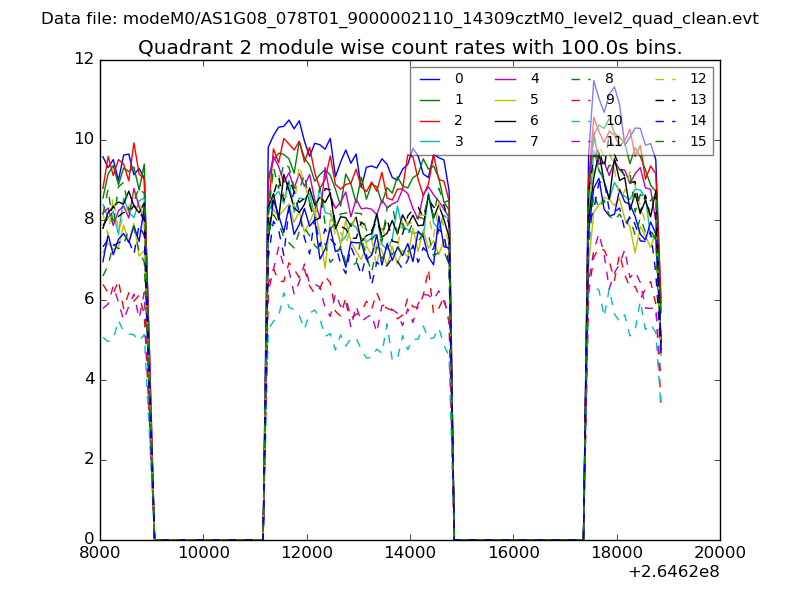
| Module-wise count rates for Quadrant B Data is divided into 100 sec bins |
 |
 |
| Module-wise count rates for Quadrant C Data is divided into 100 sec bins |
 |
 |
| Module-wise count rates for Quadrant D Data is divided into 100 sec bins |
 |
 |
| Parameter | Plot |
|---|---|
| CZT HV Monitor | 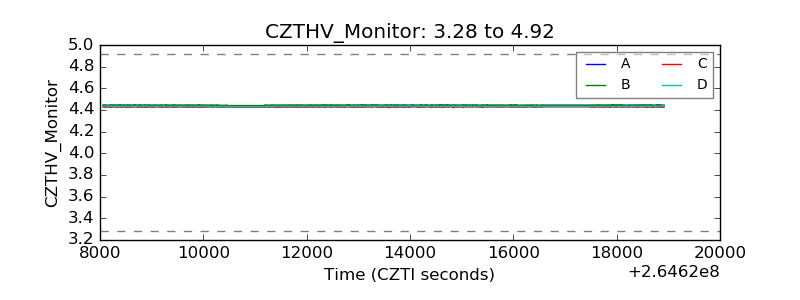 |
| D_VDD |  |
| Temperature 1 | 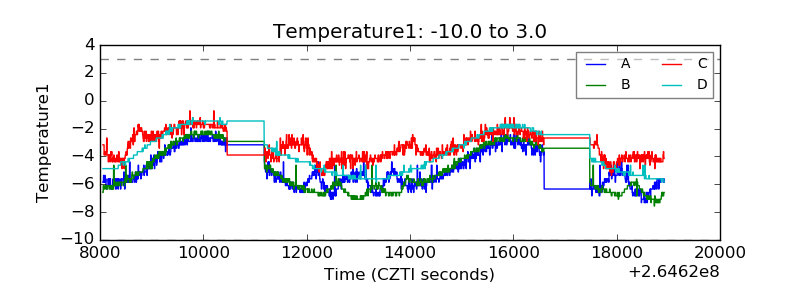 |
| Veto HV Monitor | 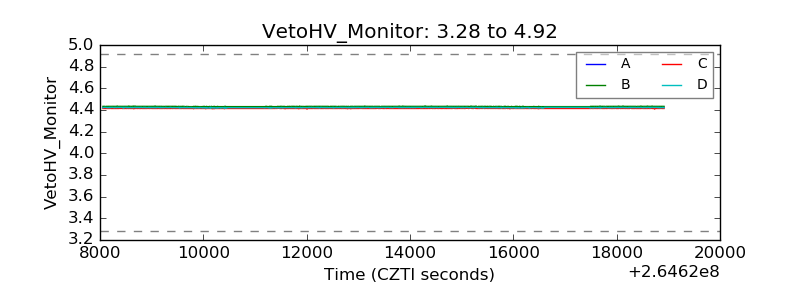 |
| Veto LLD |  |
| Alpha Counter | 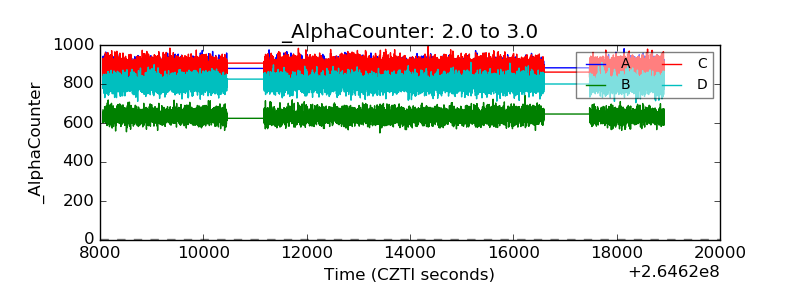 |
| _CPM_Rate | 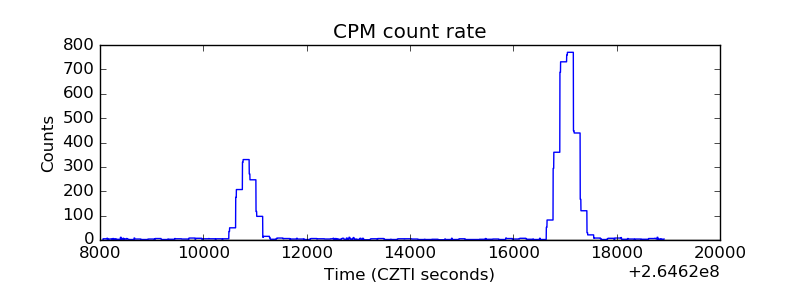 |
| CZT Counter | 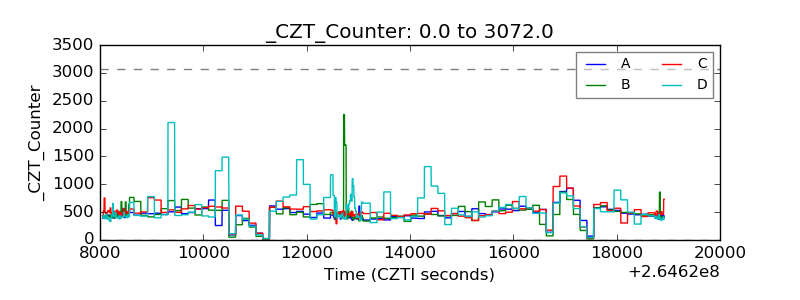 |
| +2.5 Volts monitor | 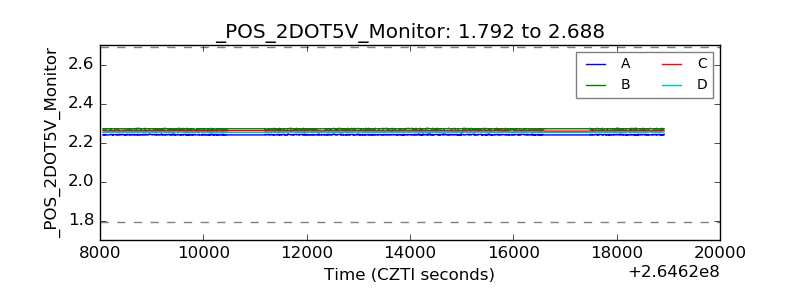 |
| +5 Volts monitor |  |
| _ROLL_ROT | 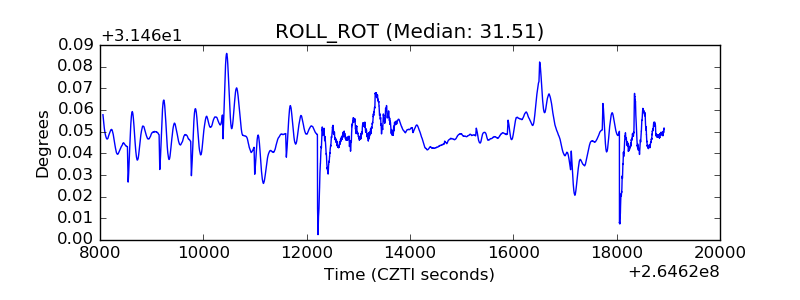 |
| _Roll_DEC | 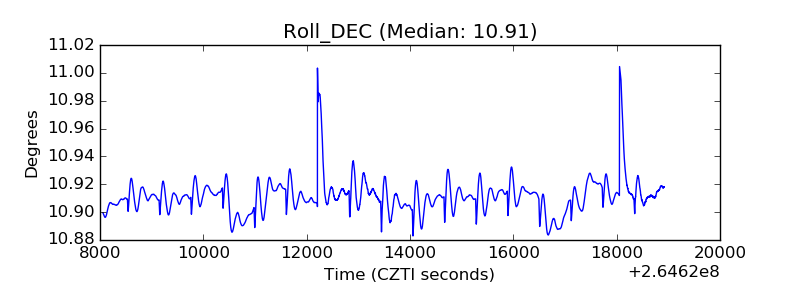 |
| _Roll_RA | 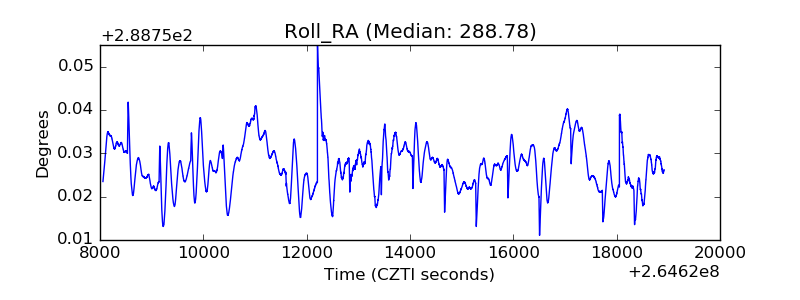 |
| Veto Counter | 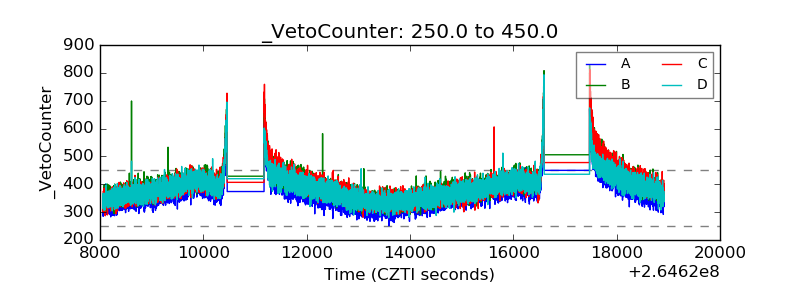 |