| Param | Original file | Final file |
|---|---|---|
| Filename | modeM0/AS1G08_078T01_9000002110_14310cztM0_level2.evt | modeM0/AS1G08_078T01_9000002110_14310cztM0_level2_quad_clean.evt |
| Size (bytes) | 451,779,840 | 92,712,960 |
| Size | 430.9 MB | 88.4 MB |
| Events in quadrant A | 3,405,775 | 592,051 |
| Events in quadrant B | 3,237,315 | 597,373 |
| Events in quadrant C | 3,396,961 | 590,304 |
| Events in quadrant D | 3,199,886 | 574,133 |
| Mode SS | |||
|---|---|---|---|
| Quadrant | BADHDUFLAG | Total packets | Discarded packets |
| A | 0 | 134 | 0 |
| B | 0 | 134 | 0 |
| C | 0 | 134 | 0 |
| D | 0 | 134 | 0 |
| Mode M0 | |||
|---|---|---|---|
| Quadrant | BADHDUFLAG | Total packets | Discarded packets |
| A | 0 | 14285 | 3 |
| B | 0 | 13863 | 2 |
| C | 0 | 14002 | 2 |
| D | 0 | 14102 | 2 |
| Mode M9 | |||
|---|---|---|---|
| Quadrant | BADHDUFLAG | Total packets | Discarded packets |
| A | 0 | 17 | 0 |
| B | 0 | 17 | 0 |
| C | 0 | 17 | 0 |
| D | 0 | 17 | 0 |
| Quadrant | Total seconds | Saturated seconds | Saturation percentage |
|---|---|---|---|
| A | 6503 | 27 | 0.415193% |
| B | 6503 | 56 | 0.861141% |
| C | 6503 | 18 | 0.276795% |
| D | 6503 | 26 | 0.399815% |
Noise dominated data is calculated using 1-second bins in cleaned event files. If a bin has >2000 counts, and if more than 50% of those come from <1% of pixels, then it is considered to be noise-dominated and hence unusable.
| Quadrant | # 1 sec bins | Bins with >0 counts | Bins with >2000 counts | High rate bins dominated by noise | Noise dominated (total time) | Noise dominated (detector-on time) | Marked lightcurve |
|---|---|---|---|---|---|---|---|
| A | 7534 | 6505 | 0 | 0 | 0.00% | 0.00% | 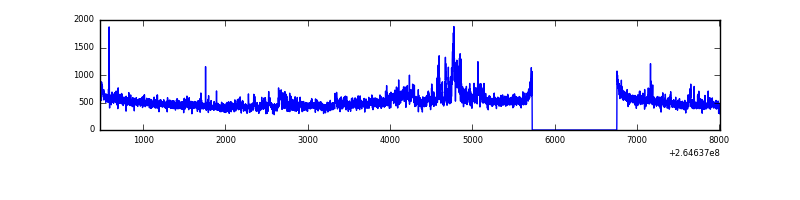 |
| B | 7534 | 6505 | 2 | 2 | 0.03% | 0.03% | 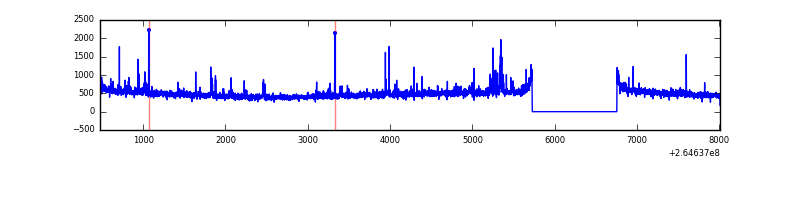 |
| C | 7534 | 6505 | 0 | 0 | 0.00% | 0.00% | 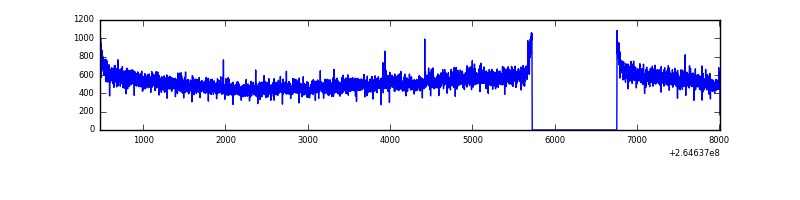 |
| D | 7534 | 6505 | 17 | 17 | 0.23% | 0.26% | 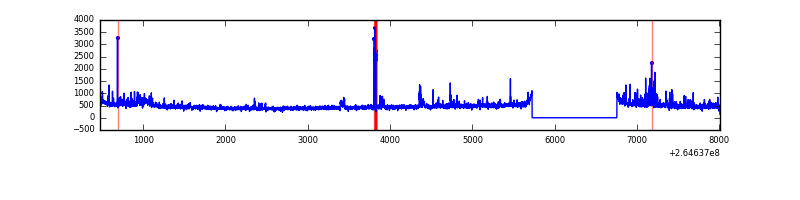 |
Top three noisy pixels from each quadrant. If the there are fewer than three noisy pixels in the level2.evt file, extra rows are filled as -1
| Pixel properties | Quadrant properties | ||||||
|---|---|---|---|---|---|---|---|
| Quadrant | DetID | PixID | Counts | Sigma | Mean | Median | Sigma |
| A | 12 | 189 | 300541 | 1895.95 | 784 | 770 | 158.1 |
| A | 8 | 15 | 64619 | 403.82 | 784 | 770 | 158.1 |
| A | 9 | 143 | 18849 | 114.34 | 784 | 770 | 158.1 |
| B | 0 | 229 | 107111 | 702.86 | 787 | 769 | 151.3 |
| B | 0 | 189 | 24993 | 160.11 | 787 | 769 | 151.3 |
| B | 12 | 111 | 17937 | 113.47 | 787 | 769 | 151.3 |
| C | 3 | 233 | 400018 | 2211.57 | 768 | 771 | 180.5 |
| C | 13 | 61 | 5415 | 25.72 | 768 | 771 | 180.5 |
| C | 14 | 220 | 2712 | 10.75 | 768 | 771 | 180.5 |
| D | 5 | 222 | 192748 | 1056.95 | 760 | 745 | 181.7 |
| D | 10 | 70 | 46046 | 249.38 | 760 | 745 | 181.7 |
| D | 12 | 110 | 42138 | 227.86 | 760 | 745 | 181.7 |
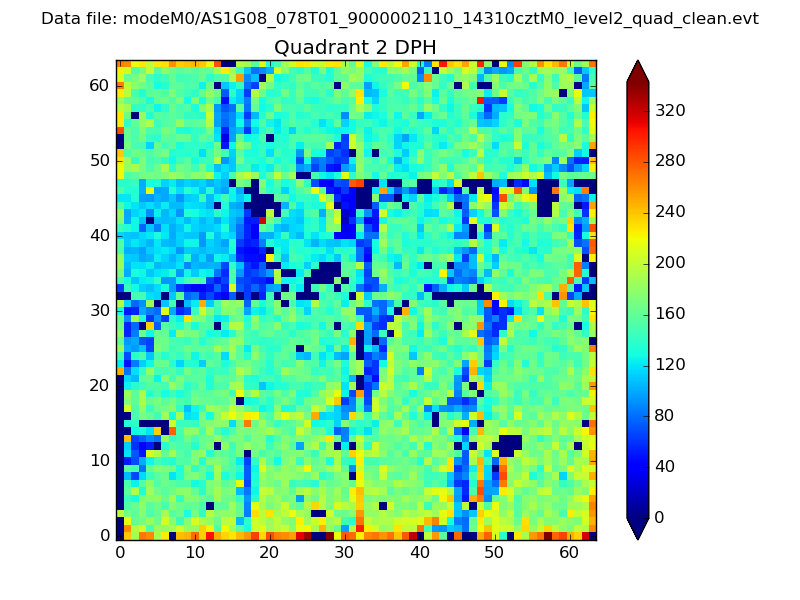
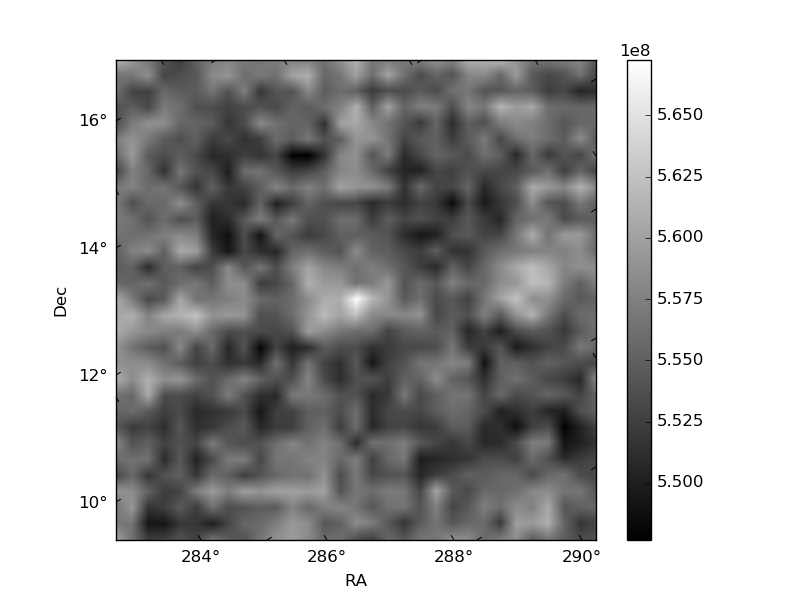
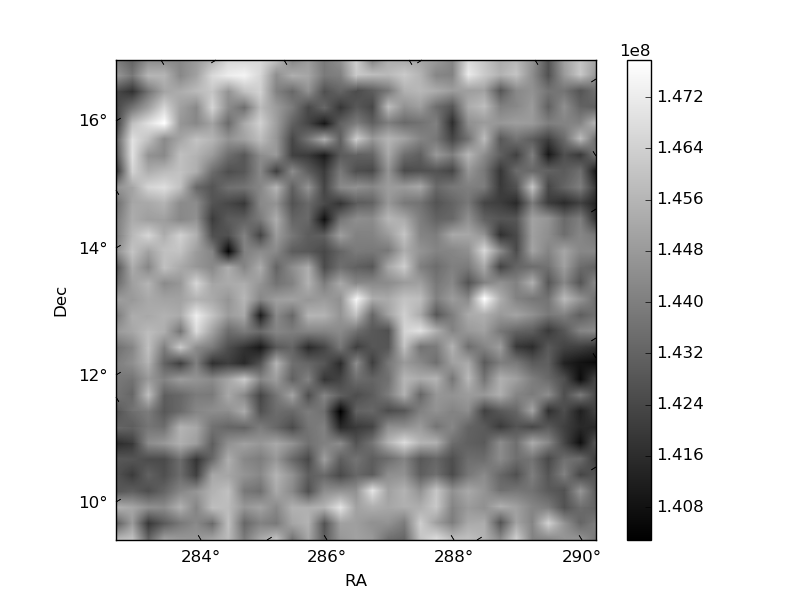
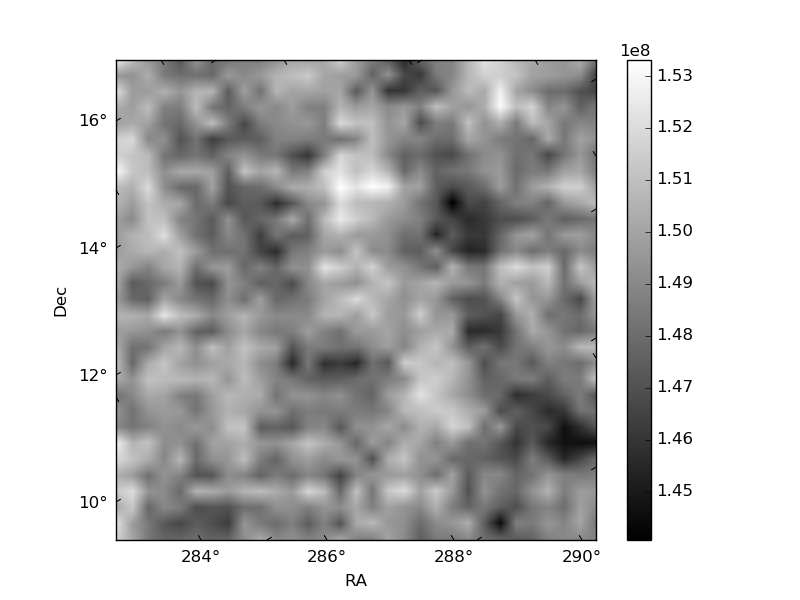
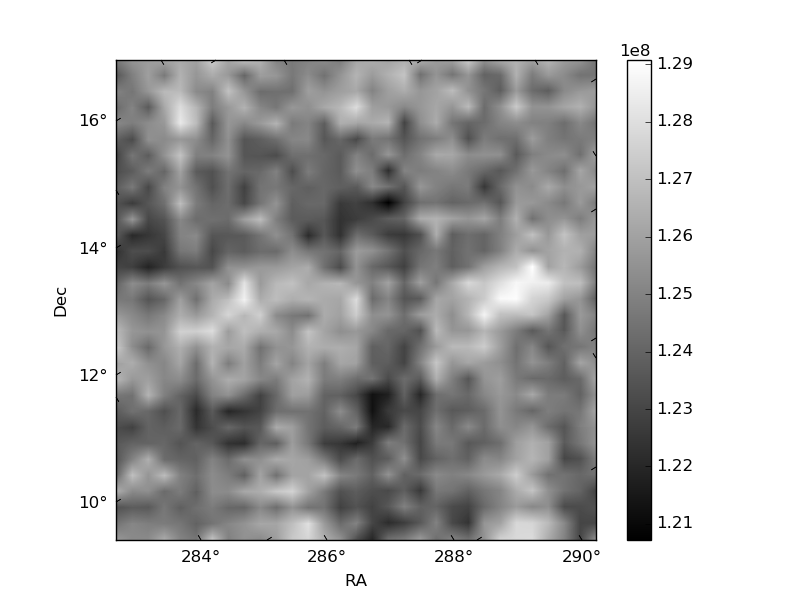
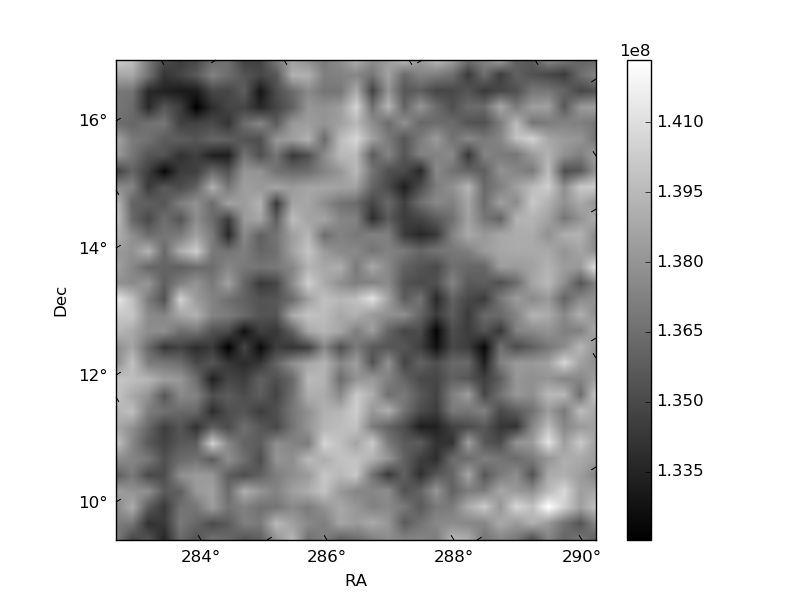
Histogram calculated using DETX and DETY for each event in the final _common_clean file
| Quadrant A | 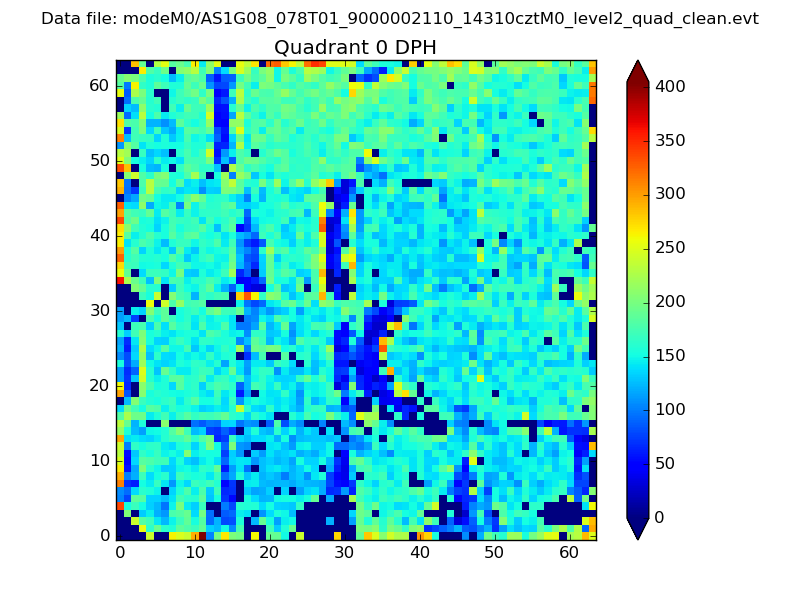 |
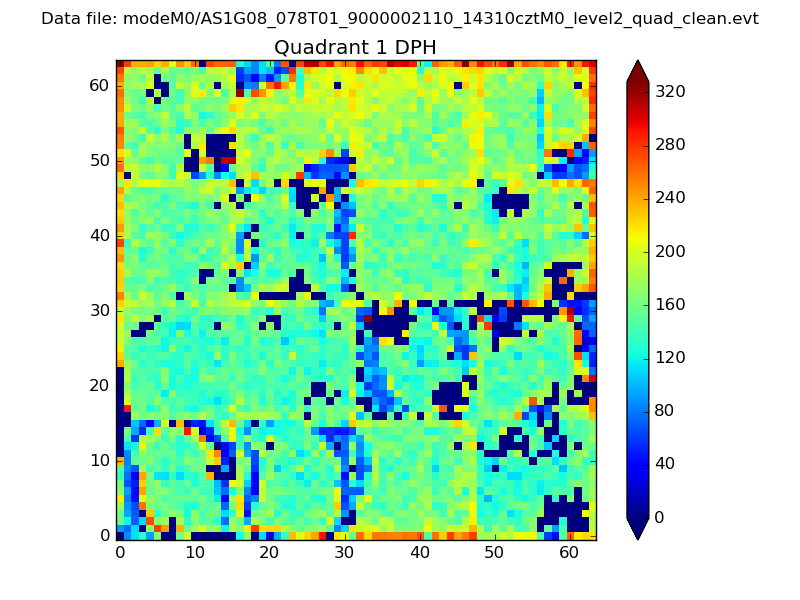 |
Quadrant B |
|---|---|---|---|
| Quadrant D | 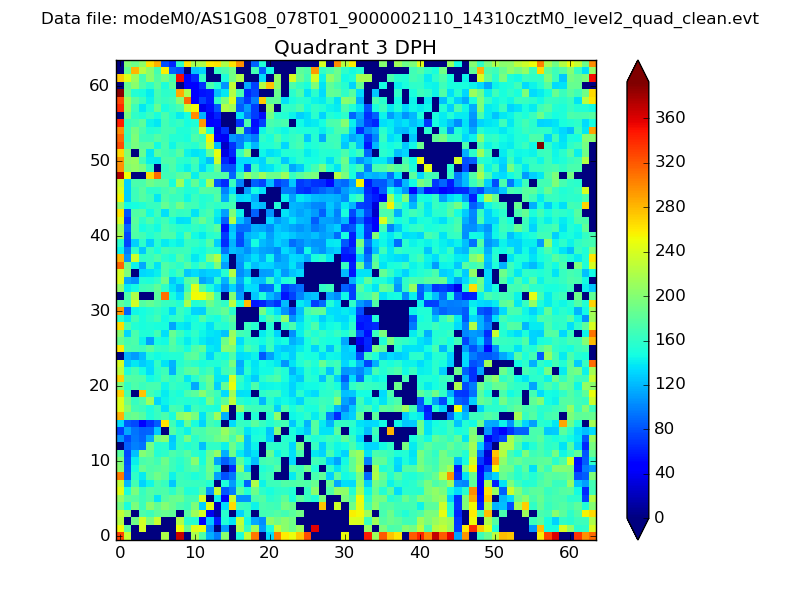 |
 |
Quadrant C |
| Plot type | Count rate plots | Images |
|---|---|---|
| Comparison with Poisson distribution Blue bars denote a histogram of data divided into 1 sec bins. Red curve is a Poisson curve with rate = median count rate of data. |
 |
 |
| Quadrant-wise count rates Data is divided into 100 sec bins |
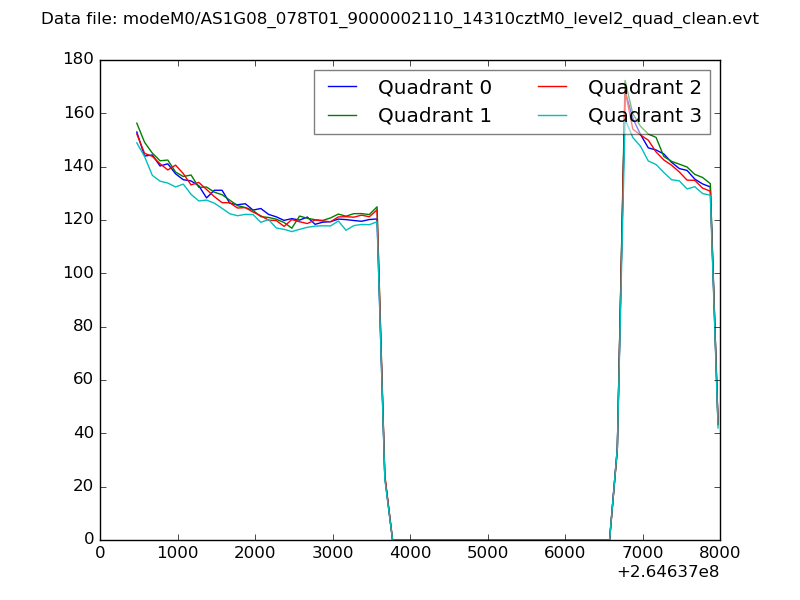 |
|
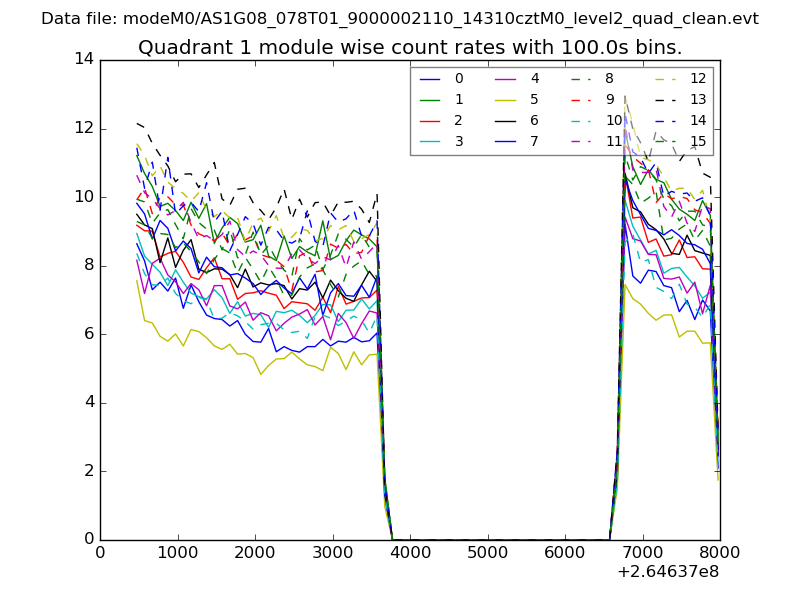
| Module-wise count rates for Quadrant A Data is divided into 100 sec bins |
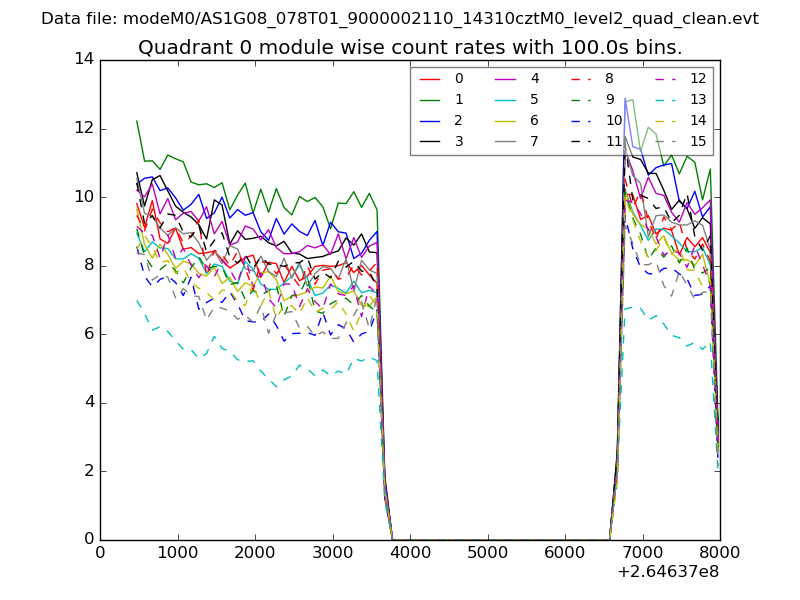 |
 |
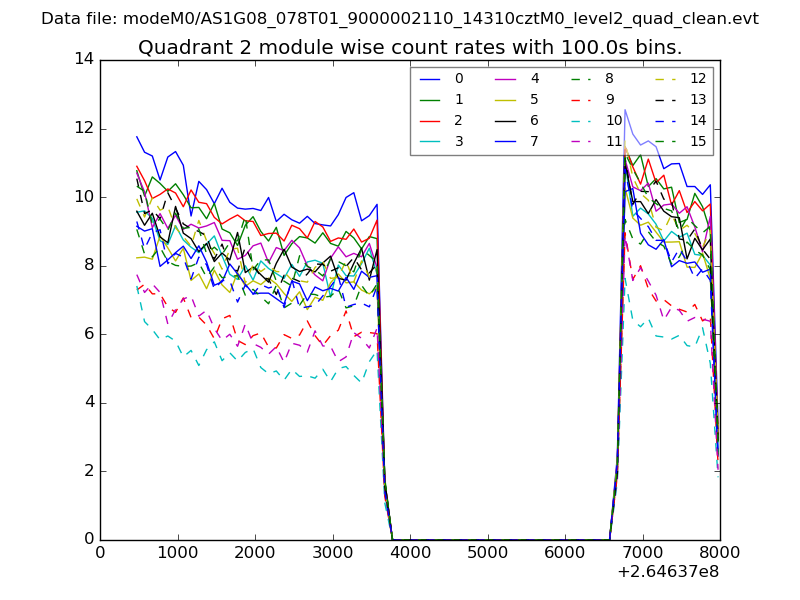
| Module-wise count rates for Quadrant B Data is divided into 100 sec bins |
 |
 |
| Module-wise count rates for Quadrant C Data is divided into 100 sec bins |
 |
 |
| Module-wise count rates for Quadrant D Data is divided into 100 sec bins |
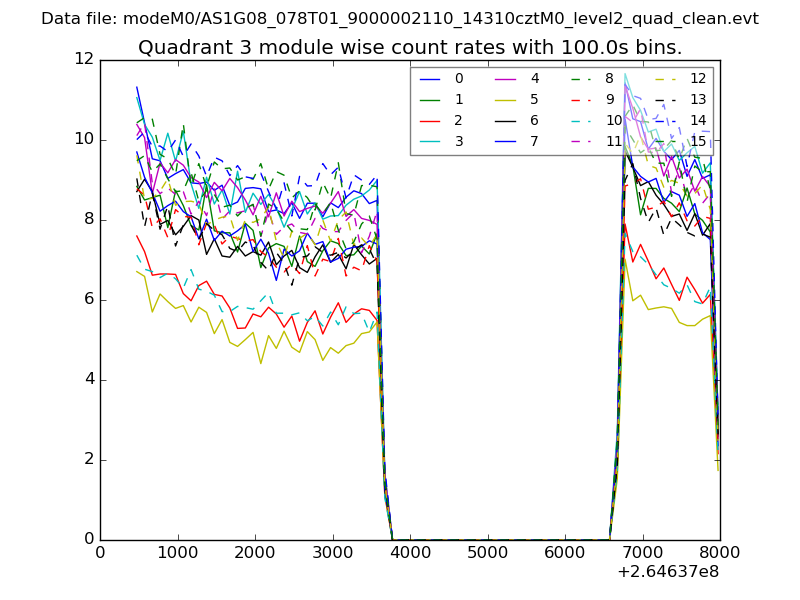 |
 |
| Parameter | Plot |
|---|---|
| CZT HV Monitor | 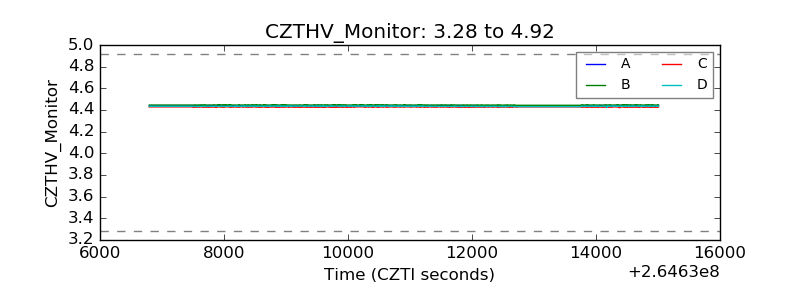 |
| D_VDD | 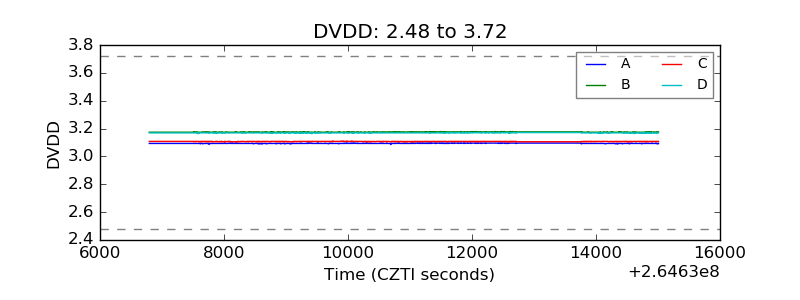 |
| Temperature 1 | 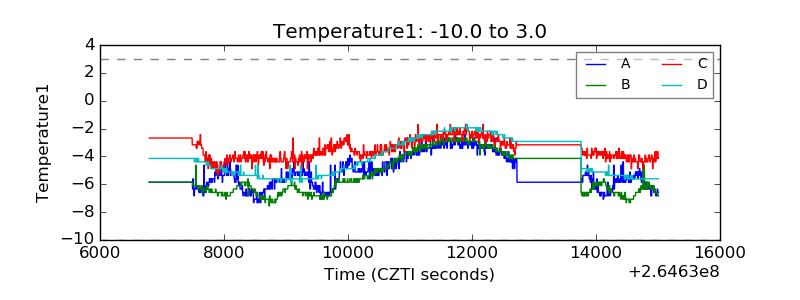 |
| Veto HV Monitor | 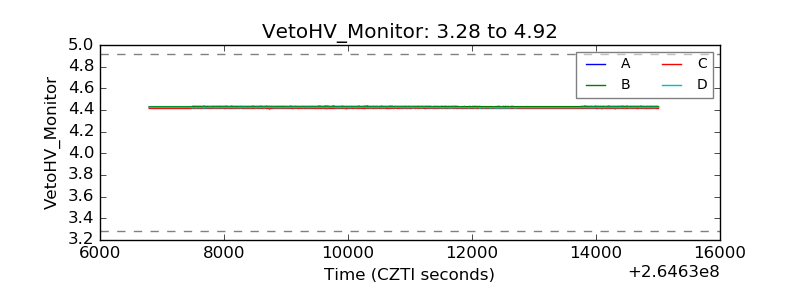 |
| Veto LLD | 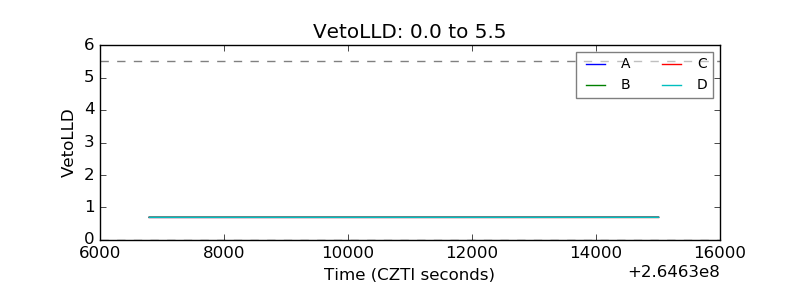 |
| Alpha Counter | 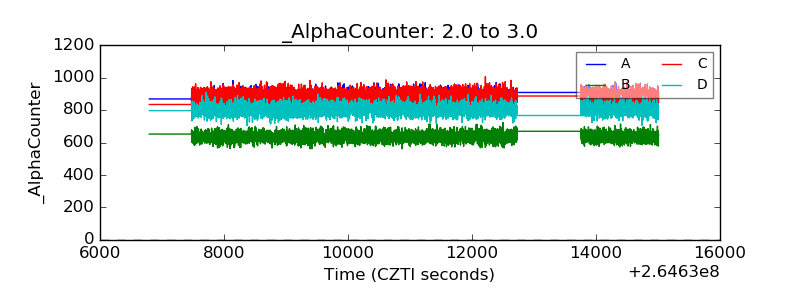 |
| _CPM_Rate | 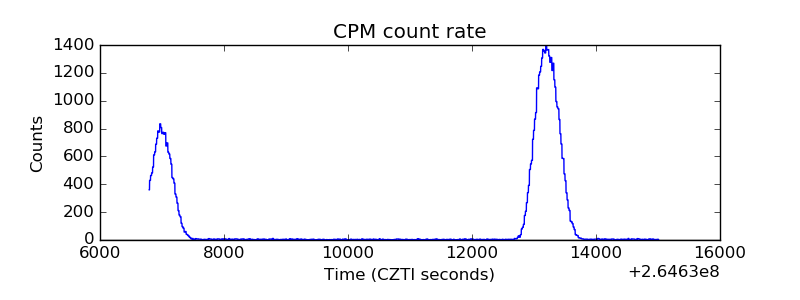 |
| CZT Counter | 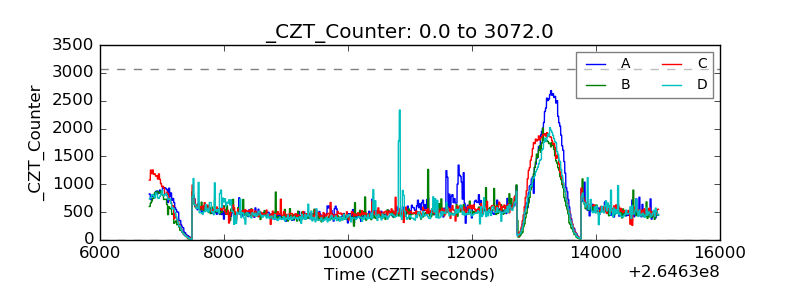 |
| +2.5 Volts monitor | 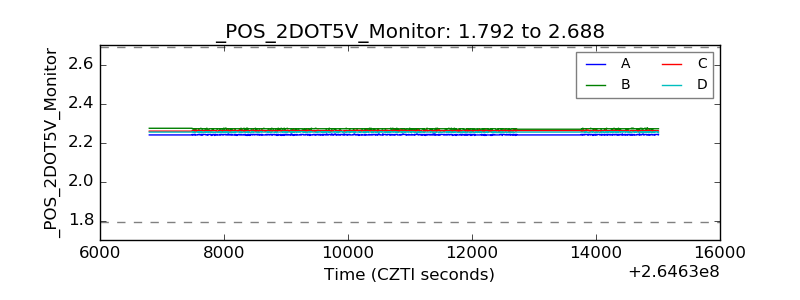 |
| +5 Volts monitor |  |
| _ROLL_ROT | 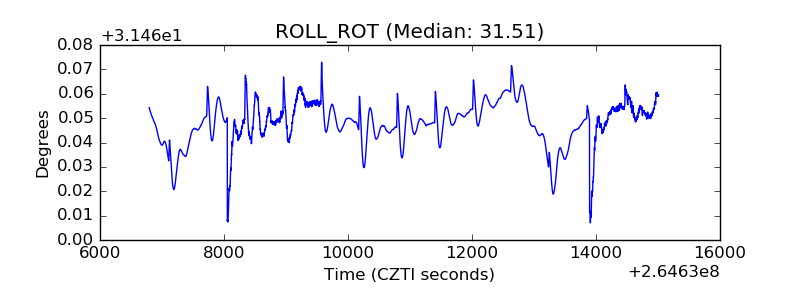 |
| _Roll_DEC | 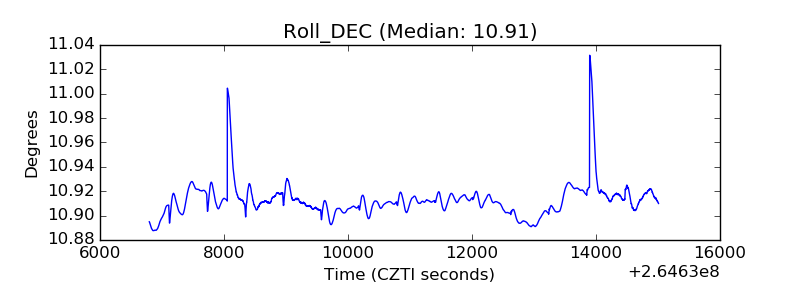 |
| _Roll_RA | 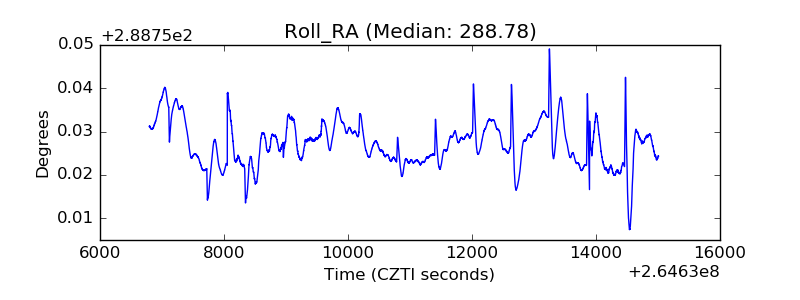 |
| Veto Counter | 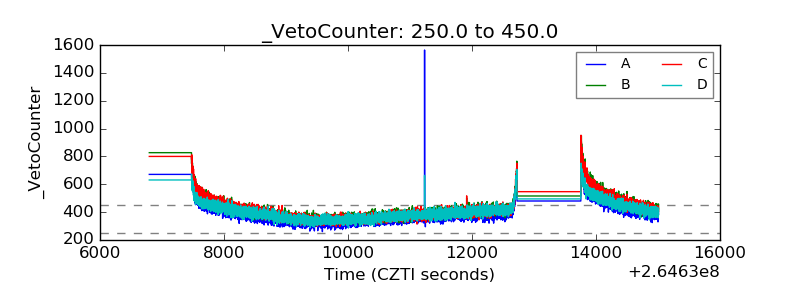 |