| Param | Original file | Final file |
|---|---|---|
| Filename | modeM0/AS1G08_078T01_9000002110_14313cztM0_level2.evt | modeM0/AS1G08_078T01_9000002110_14313cztM0_level2_quad_clean.evt |
| Size (bytes) | 81,544,320 | 26,282,880 |
| Size | 77.8 MB | 25.1 MB |
| Events in quadrant A | 620,053 | 178,293 |
| Events in quadrant B | 577,749 | 182,594 |
| Events in quadrant C | 615,629 | 175,871 |
| Events in quadrant D | 574,795 | 171,540 |
| Mode SS | |||
|---|---|---|---|
| Quadrant | BADHDUFLAG | Total packets | Discarded packets |
| A | 0 | 28 | 6 |
| B | 0 | 28 | 6 |
| C | 0 | 28 | 6 |
| D | 0 | 28 | 4 |
| Mode M0 | |||
|---|---|---|---|
| Quadrant | BADHDUFLAG | Total packets | Discarded packets |
| A | 0 | 3348 | 843 |
| B | 0 | 3201 | 842 |
| C | 0 | 3241 | 826 |
| D | 0 | 3426 | 1027 |
| Mode M9 | |||
|---|---|---|---|
| Quadrant | BADHDUFLAG | Total packets | Discarded packets |
| A | 0 | 5 | 5 |
| B | 0 | 3 | 3 |
| C | 0 | 2 | 2 |
| D | 0 | 5 | 5 |
| Quadrant | Total seconds | Saturated seconds | Saturation percentage |
|---|---|---|---|
| A | 1141 | 0 | 0.000000% |
| B | 1150 | 0 | 0.000000% |
| C | 1162 | 0 | 0.000000% |
| D | 1152 | 1 | 0.086806% |
Noise dominated data is calculated using 1-second bins in cleaned event files. If a bin has >2000 counts, and if more than 50% of those come from <1% of pixels, then it is considered to be noise-dominated and hence unusable.
| Quadrant | # 1 sec bins | Bins with >0 counts | Bins with >2000 counts | High rate bins dominated by noise | Noise dominated (total time) | Noise dominated (detector-on time) | Marked lightcurve |
|---|---|---|---|---|---|---|---|
| A | 1305 | 1195 | 0 | 0 | 0.00% | 0.00% | 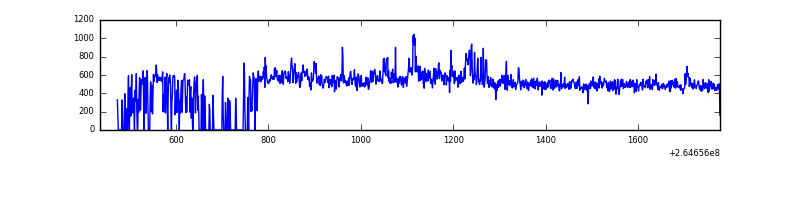 |
| B | 1316 | 1203 | 0 | 0 | 0.00% | 0.00% | 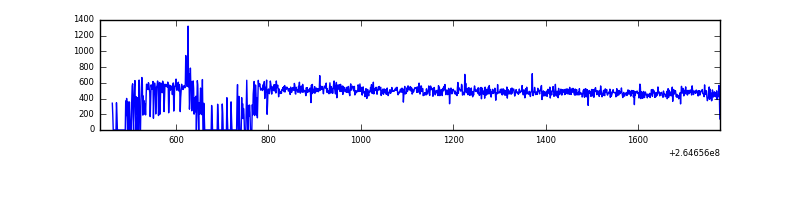 |
| C | 1331 | 1211 | 0 | 0 | 0.00% | 0.00% | 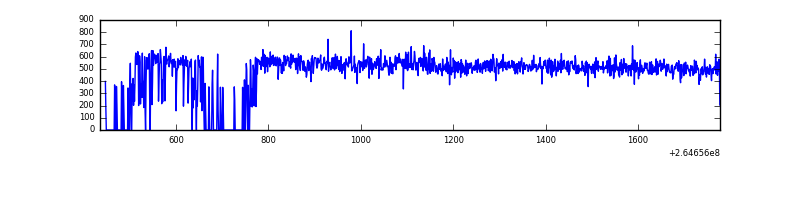 |
| D | 1343 | 1199 | 1 | 1 | 0.07% | 0.08% | 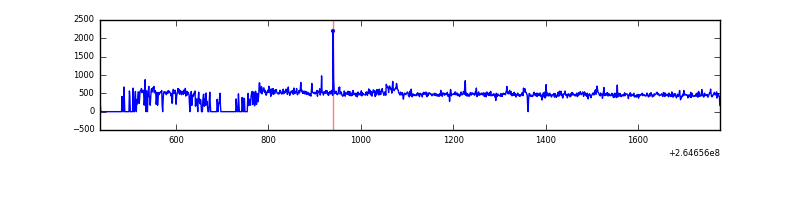 |
Top three noisy pixels from each quadrant. If the there are fewer than three noisy pixels in the level2.evt file, extra rows are filled as -1
| Pixel properties | Quadrant properties | ||||||
|---|---|---|---|---|---|---|---|
| Quadrant | DetID | PixID | Counts | Sigma | Mean | Median | Sigma |
| A | 11 | 29 | 31616 | 1011.85 | 145 | 143 | 31.1 |
| A | 12 | 189 | 15029 | 478.58 | 145 | 143 | 31.1 |
| A | 8 | 15 | 10322 | 327.25 | 145 | 143 | 31.1 |
| B | 4 | 48 | 4112 | 133.64 | 146 | 143 | 29.7 |
| B | 12 | 111 | 3072 | 98.62 | 146 | 143 | 29.7 |
| B | 11 | 111 | 2503 | 79.46 | 146 | 143 | 29.7 |
| C | 3 | 233 | 62092 | 1801.68 | 141 | 143 | 34.4 |
| C | 13 | 61 | 1071 | 26.99 | 141 | 143 | 34.4 |
| C | 14 | 234 | 472 | 9.57 | 141 | 143 | 34.4 |
| D | 5 | 222 | 19927 | 565.21 | 140 | 136 | 35.0 |
| D | 1 | 52 | 17617 | 499.24 | 140 | 136 | 35.0 |
| D | 12 | 110 | 4678 | 129.72 | 140 | 136 | 35.0 |
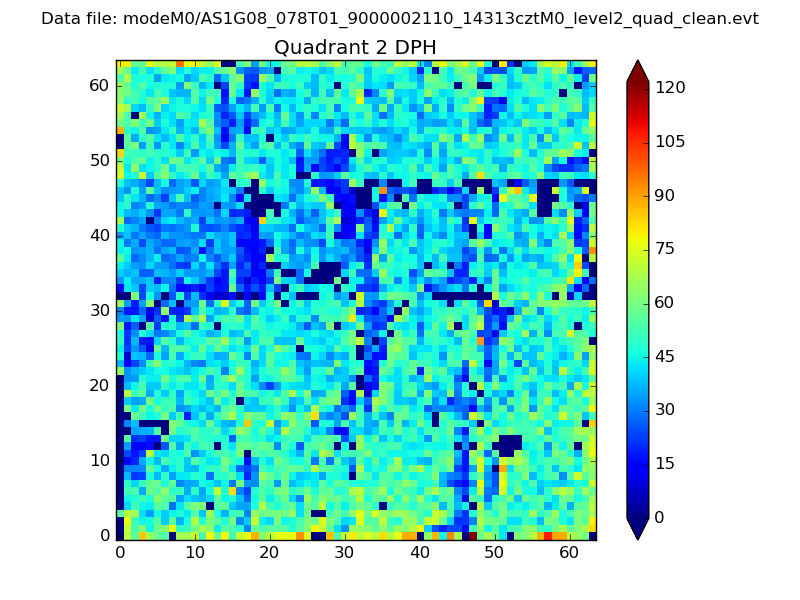
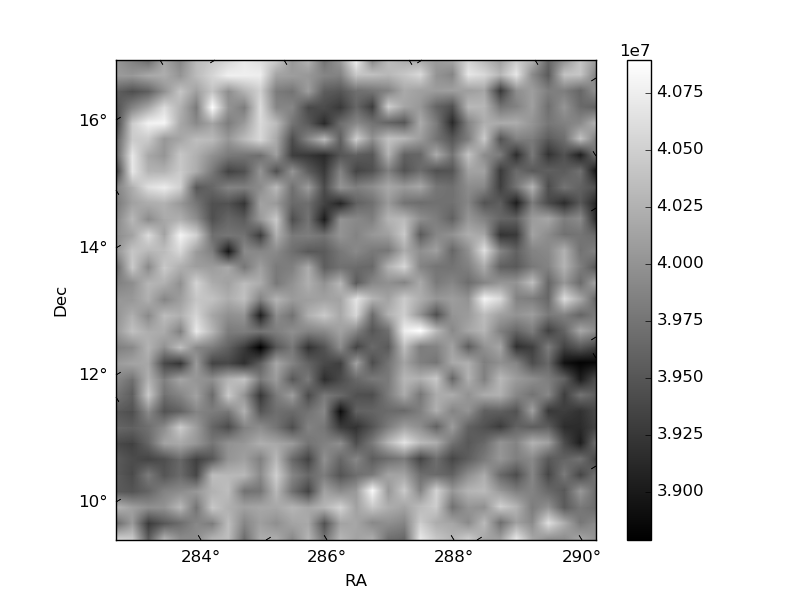
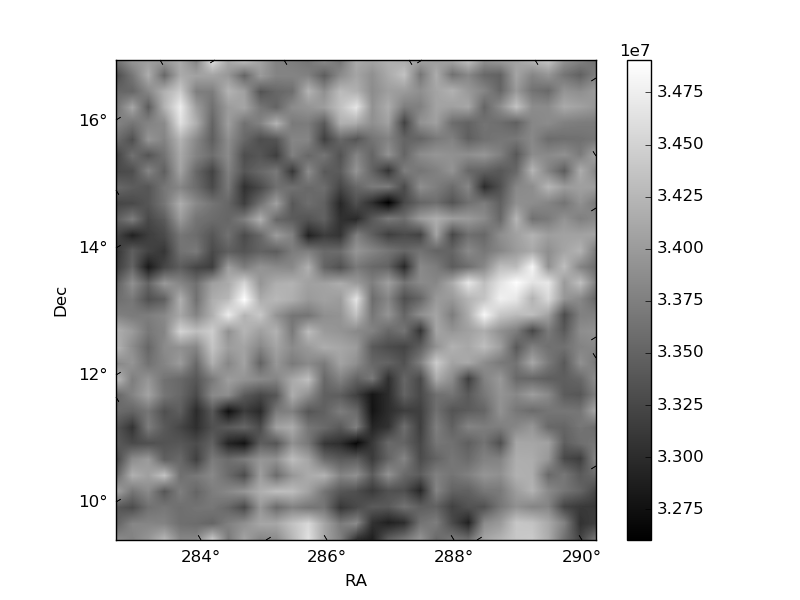
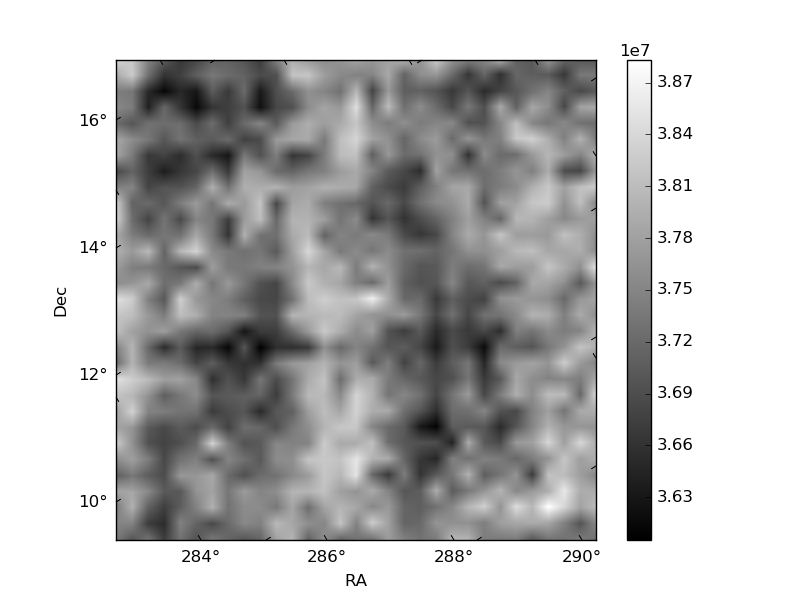
Histogram calculated using DETX and DETY for each event in the final _common_clean file
| Quadrant A | 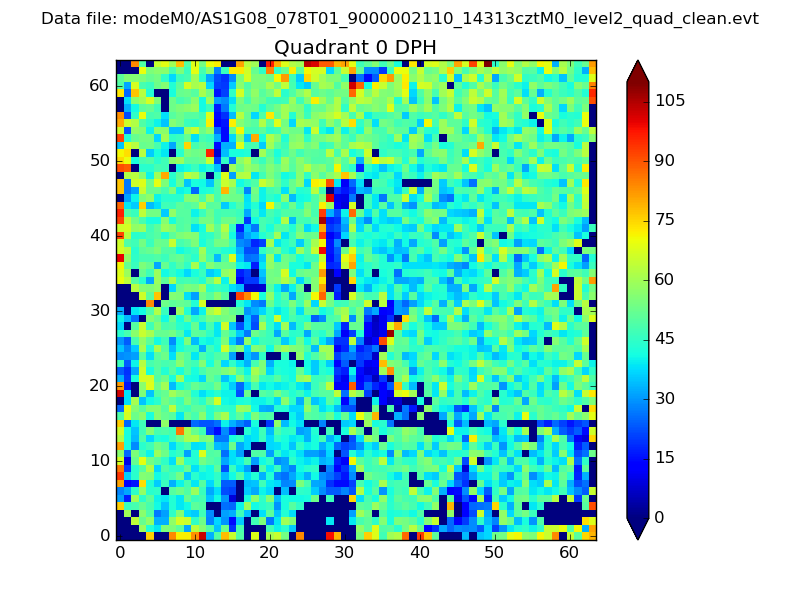 |
 |
Quadrant B |
|---|---|---|---|
| Quadrant D |  |
 |
Quadrant C |
| Plot type | Count rate plots | Images |
|---|---|---|
| Comparison with Poisson distribution Blue bars denote a histogram of data divided into 1 sec bins. Red curve is a Poisson curve with rate = median count rate of data. |
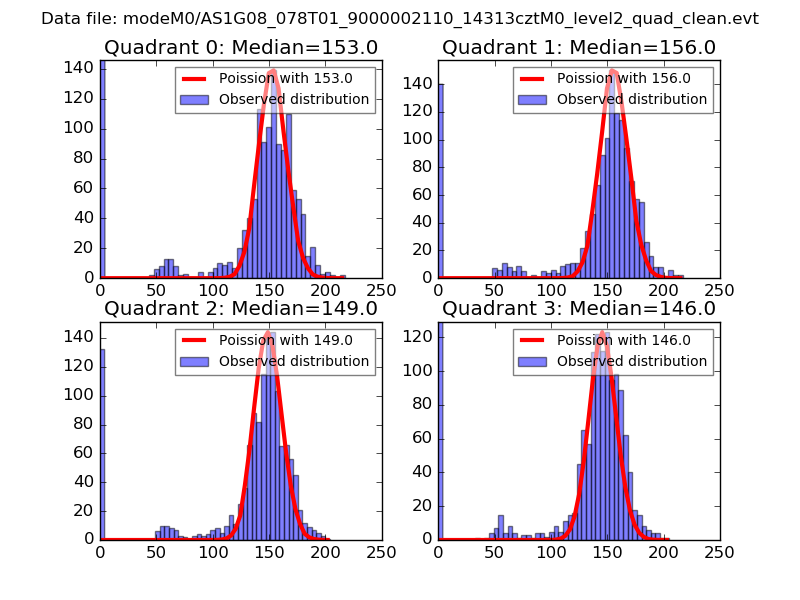 |
 |
| Quadrant-wise count rates Data is divided into 100 sec bins |
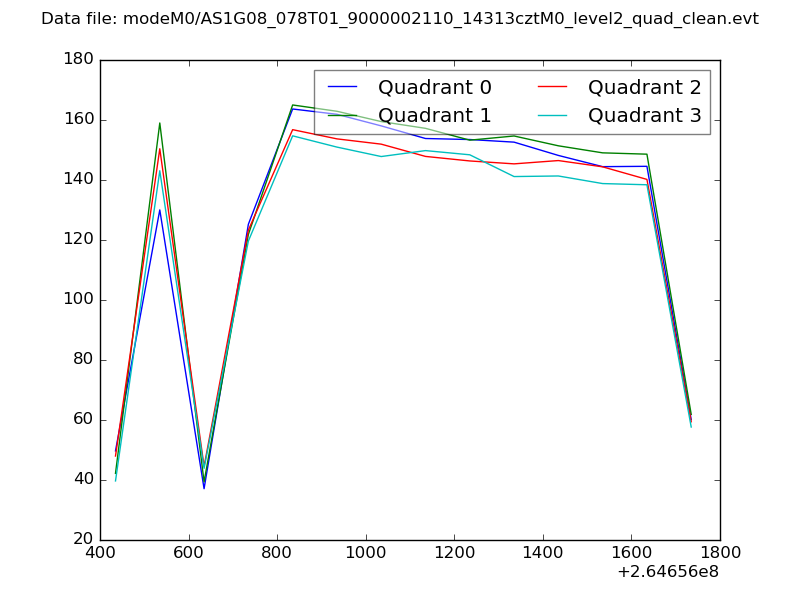 |
|
| Module-wise count rates for Quadrant A Data is divided into 100 sec bins |
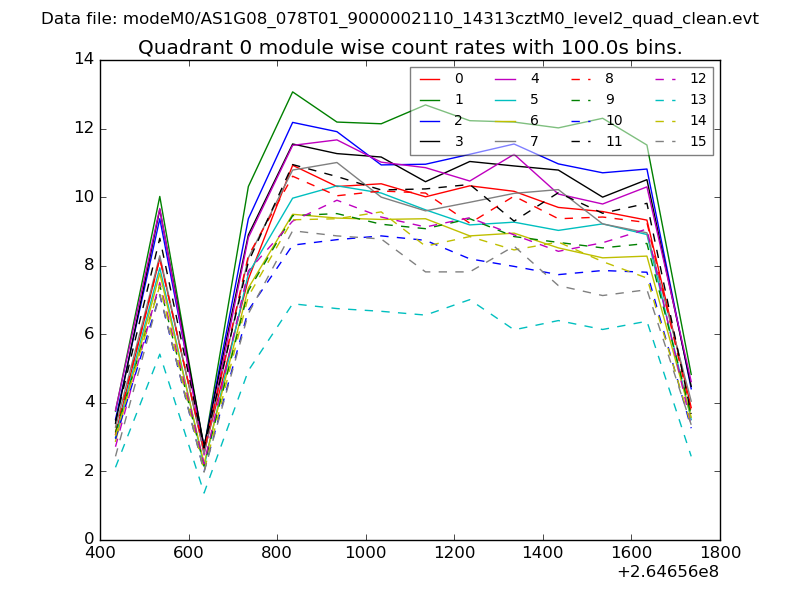 |
 |
| Module-wise count rates for Quadrant B Data is divided into 100 sec bins |
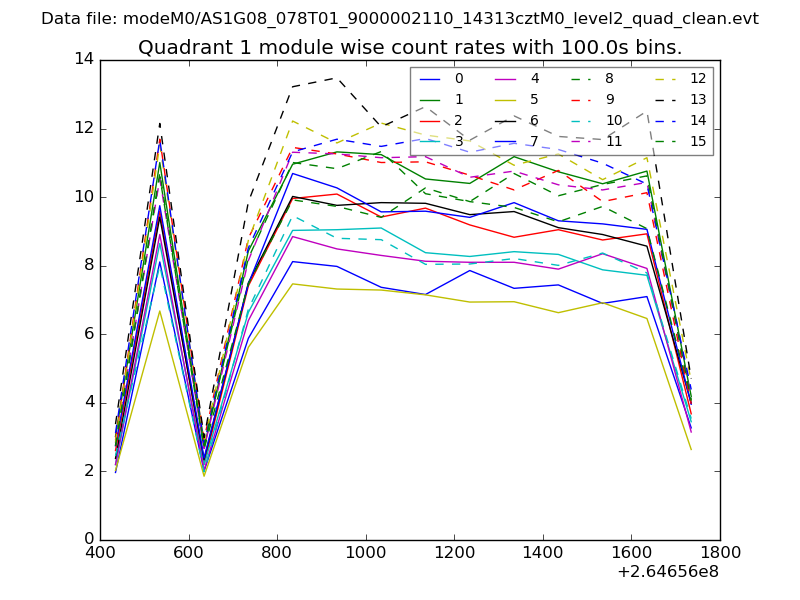 |
 |
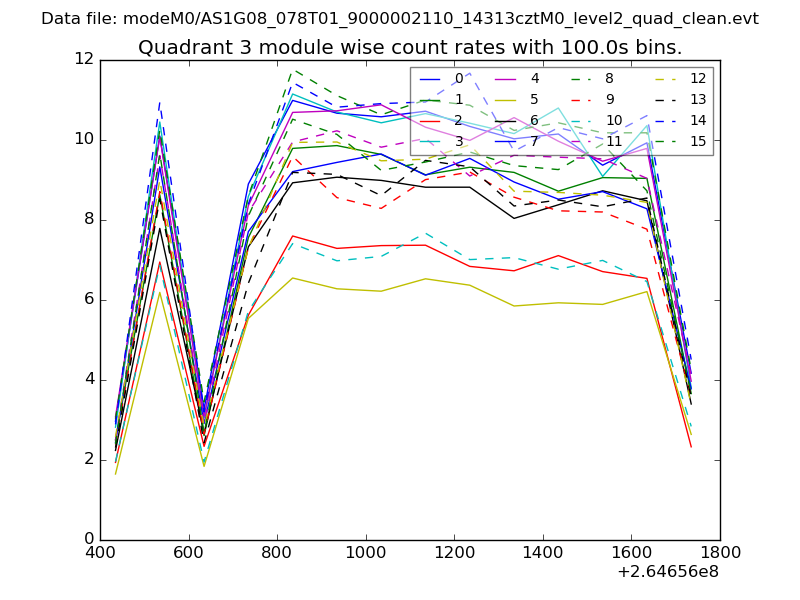
| Module-wise count rates for Quadrant C Data is divided into 100 sec bins |
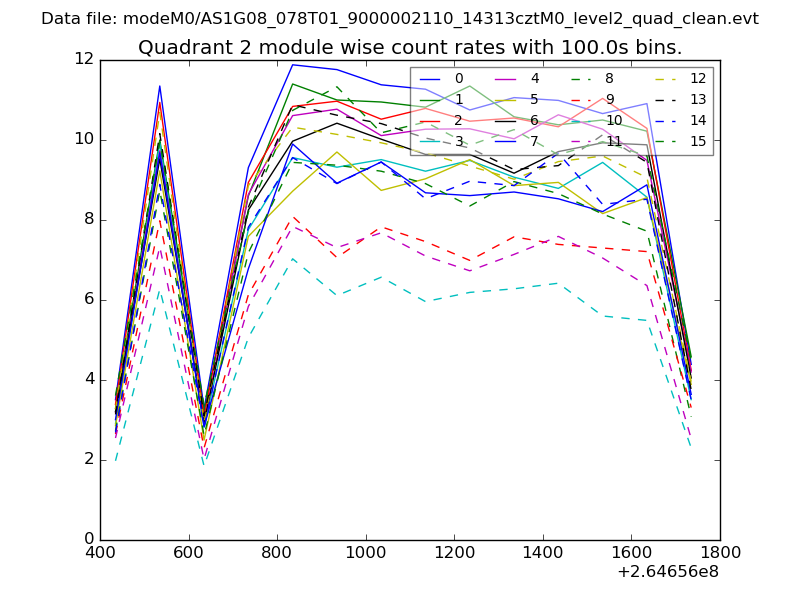 |
 |
| Module-wise count rates for Quadrant D Data is divided into 100 sec bins |
 |
 |
| Parameter | Plot |
|---|---|
| CZT HV Monitor | 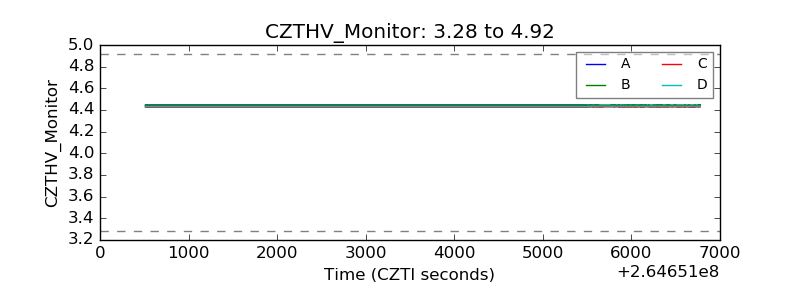 |
| D_VDD | 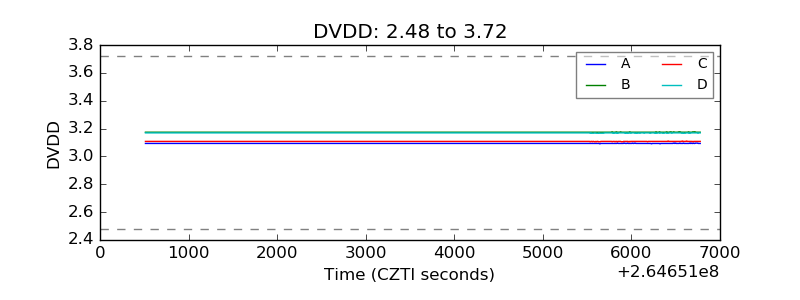 |
| Temperature 1 | 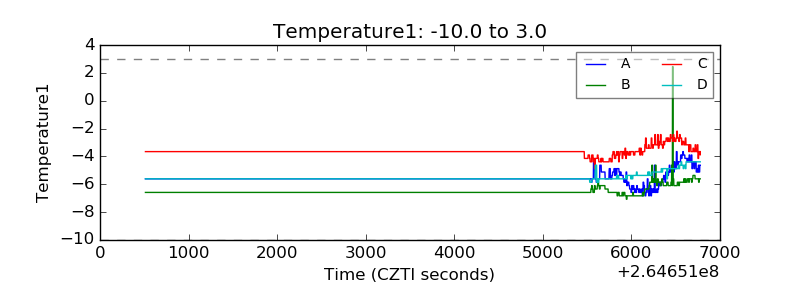 |
| Veto HV Monitor | 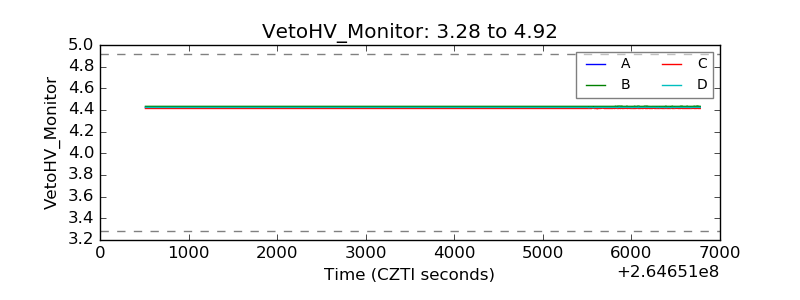 |
| Veto LLD | 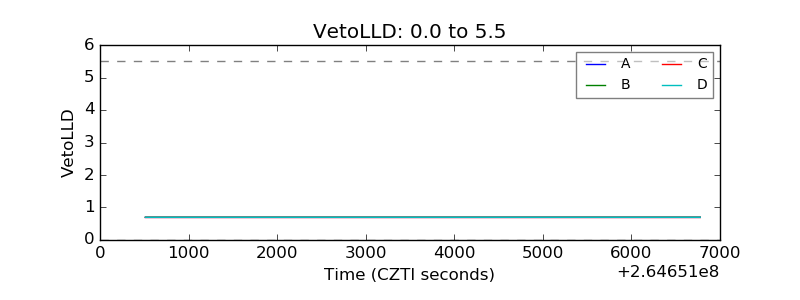 |
| Alpha Counter | 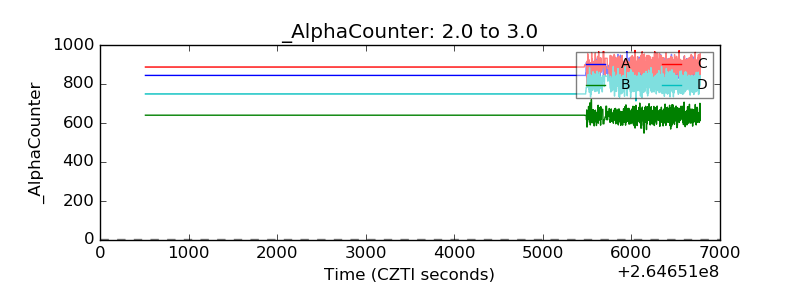 |
| _CPM_Rate | 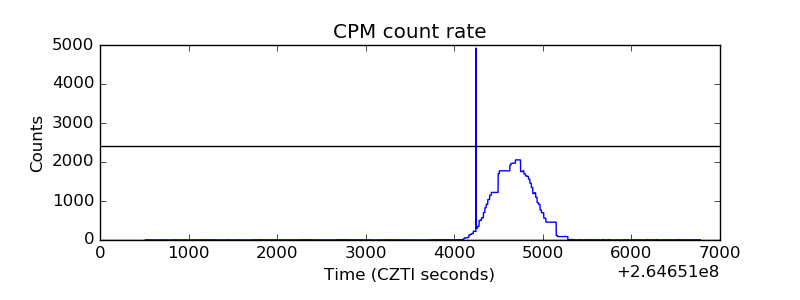 |
| CZT Counter | 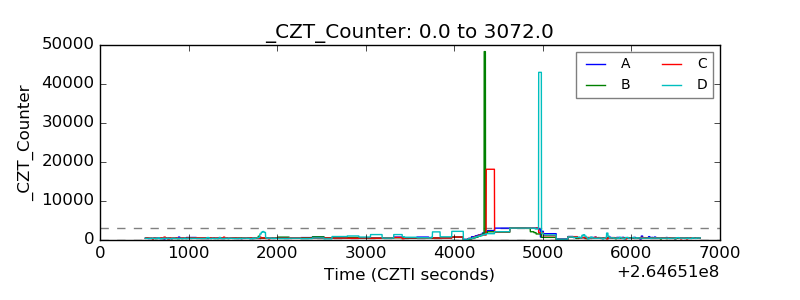 |
| +2.5 Volts monitor |  |
| +5 Volts monitor |  |
| _ROLL_ROT | 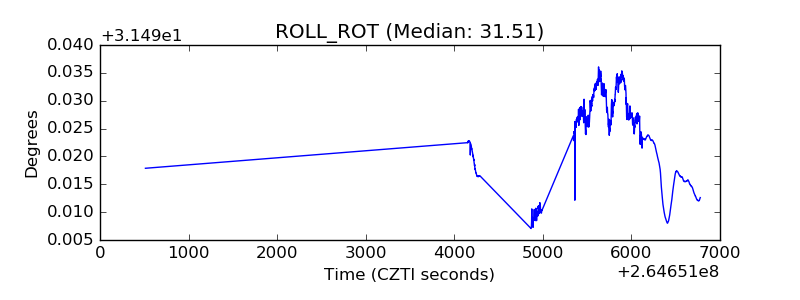 |
| _Roll_DEC | 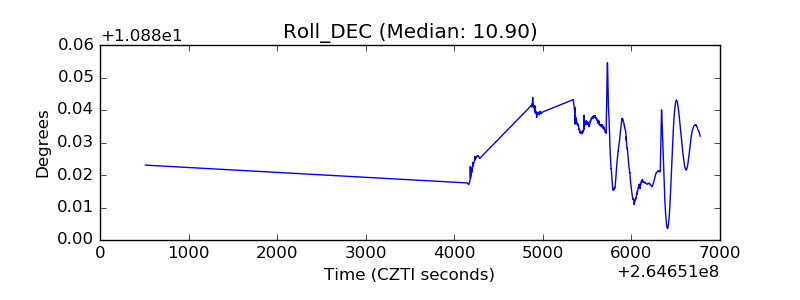 |
| _Roll_RA |  |
| Veto Counter | 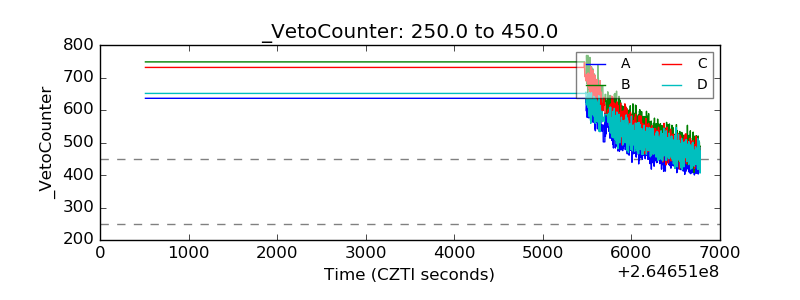 |