| Param | Original file | Final file |
|---|---|---|
| Filename | modeM0/AS1G08_078T01_9000002110_14315cztM0_level2.evt | modeM0/AS1G08_078T01_9000002110_14315cztM0_level2_quad_clean.evt |
| Size (bytes) | 480,087,360 | 82,679,040 |
| Size | 457.8 MB | 78.8 MB |
| Events in quadrant A | 3,121,710 | 532,932 |
| Events in quadrant B | 3,414,766 | 533,555 |
| Events in quadrant C | 3,222,665 | 515,793 |
| Events in quadrant D | 4,374,224 | 503,280 |
| Mode SS | |||
|---|---|---|---|
| Quadrant | BADHDUFLAG | Total packets | Discarded packets |
| A | 0 | 122 | 0 |
| B | 0 | 122 | 0 |
| C | 0 | 122 | 0 |
| D | 0 | 122 | 0 |
| Mode M0 | |||
|---|---|---|---|
| Quadrant | BADHDUFLAG | Total packets | Discarded packets |
| A | 0 | 12564 | 2 |
| B | 0 | 13648 | 1 |
| C | 0 | 12784 | 1 |
| D | 0 | 16843 | 1 |
| Mode M9 | |||
|---|---|---|---|
| Quadrant | BADHDUFLAG | Total packets | Discarded packets |
| A | 0 | 13 | 0 |
| B | 0 | 13 | 0 |
| C | 0 | 13 | 0 |
| D | 0 | 13 | 0 |
| Quadrant | Total seconds | Saturated seconds | Saturation percentage |
|---|---|---|---|
| A | 5985 | 44 | 0.735171% |
| B | 5985 | 117 | 1.954887% |
| C | 5985 | 19 | 0.317460% |
| D | 5985 | 271 | 4.527987% |
Noise dominated data is calculated using 1-second bins in cleaned event files. If a bin has >2000 counts, and if more than 50% of those come from <1% of pixels, then it is considered to be noise-dominated and hence unusable.
| Quadrant | # 1 sec bins | Bins with >0 counts | Bins with >2000 counts | High rate bins dominated by noise | Noise dominated (total time) | Noise dominated (detector-on time) | Marked lightcurve |
|---|---|---|---|---|---|---|---|
| A | 7301 | 5987 | 0 | 0 | 0.00% | 0.00% | 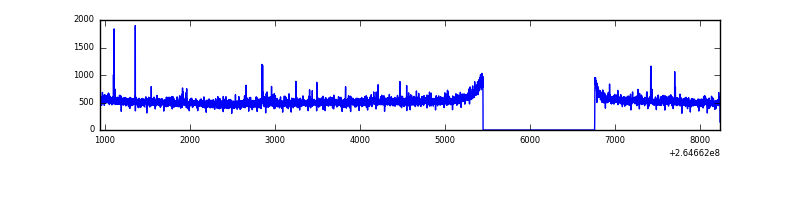 |
| B | 7301 | 5987 | 35 | 35 | 0.48% | 0.58% | 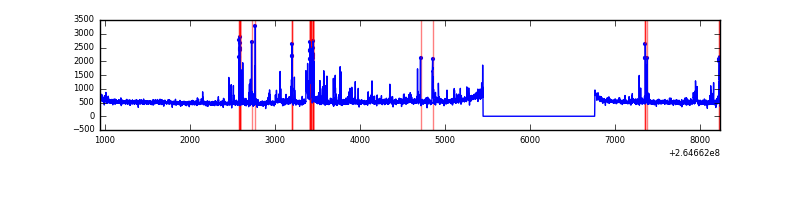 |
| C | 7301 | 5987 | 0 | 0 | 0.00% | 0.00% |  |
| D | 7301 | 5987 | 176 | 176 | 2.41% | 2.94% |  |
Top three noisy pixels from each quadrant. If the there are fewer than three noisy pixels in the level2.evt file, extra rows are filled as -1
| Pixel properties | Quadrant properties | ||||||
|---|---|---|---|---|---|---|---|
| Quadrant | DetID | PixID | Counts | Sigma | Mean | Median | Sigma |
| A | 12 | 189 | 30585 | 186.85 | 792 | 777 | 159.5 |
| A | 4 | 2 | 19042 | 114.49 | 792 | 777 | 159.5 |
| A | 8 | 15 | 15319 | 91.15 | 792 | 777 | 159.5 |
| B | 0 | 229 | 309587 | 2088.09 | 775 | 758 | 147.9 |
| B | 0 | 219 | 30865 | 203.56 | 775 | 758 | 147.9 |
| B | 4 | 173 | 20590 | 134.09 | 775 | 758 | 147.9 |
| C | 3 | 233 | 315148 | 1818.32 | 746 | 750 | 172.9 |
| C | 13 | 61 | 5255 | 26.05 | 746 | 750 | 172.9 |
| C | 3 | 202 | 1788 | 6.0 | 746 | 750 | 172.9 |
| D | 1 | 52 | 918529 | 5127.96 | 745 | 729 | 179.0 |
| D | 12 | 110 | 316833 | 1766.15 | 745 | 729 | 179.0 |
| D | 5 | 222 | 152413 | 847.49 | 745 | 729 | 179.0 |
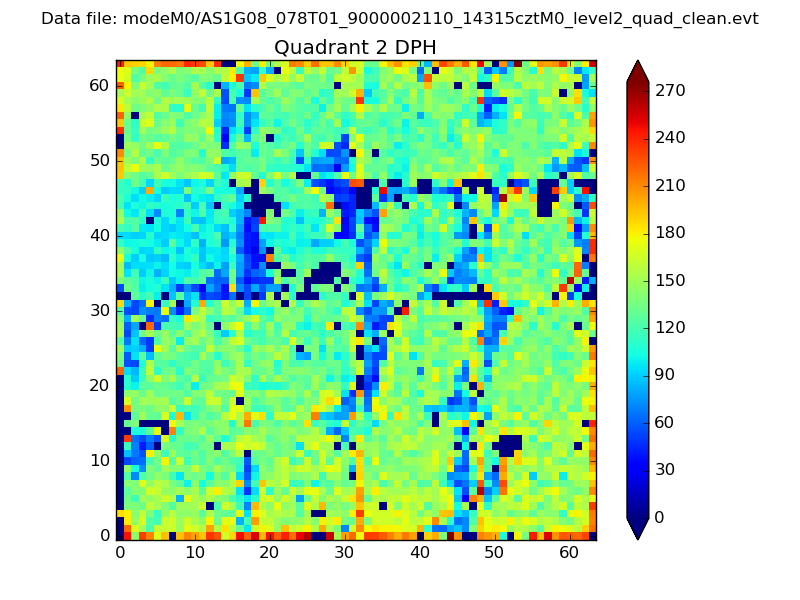
Histogram calculated using DETX and DETY for each event in the final _common_clean file
| Quadrant A | 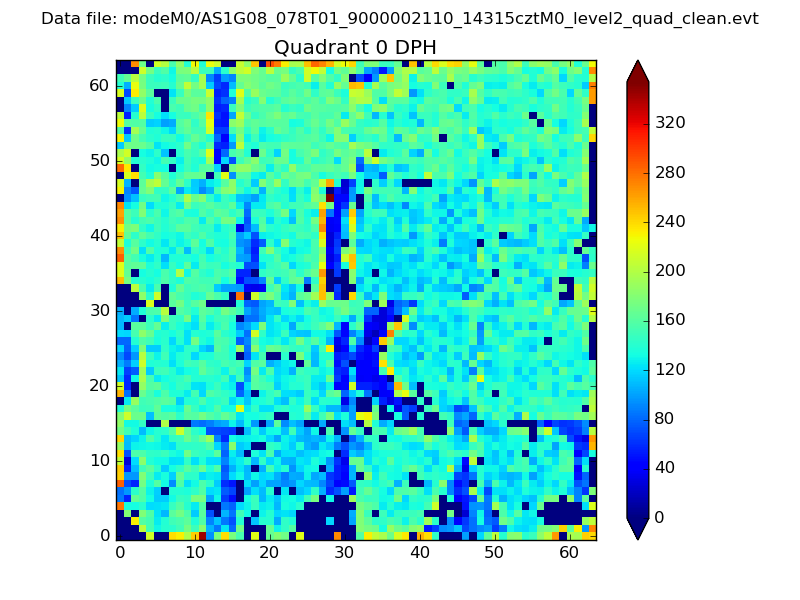 |
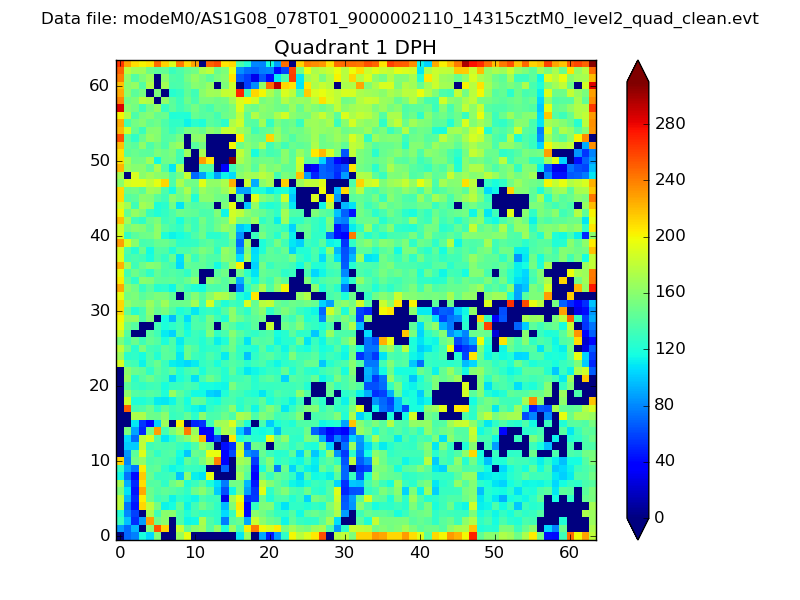 |
Quadrant B |
|---|---|---|---|
| Quadrant D | 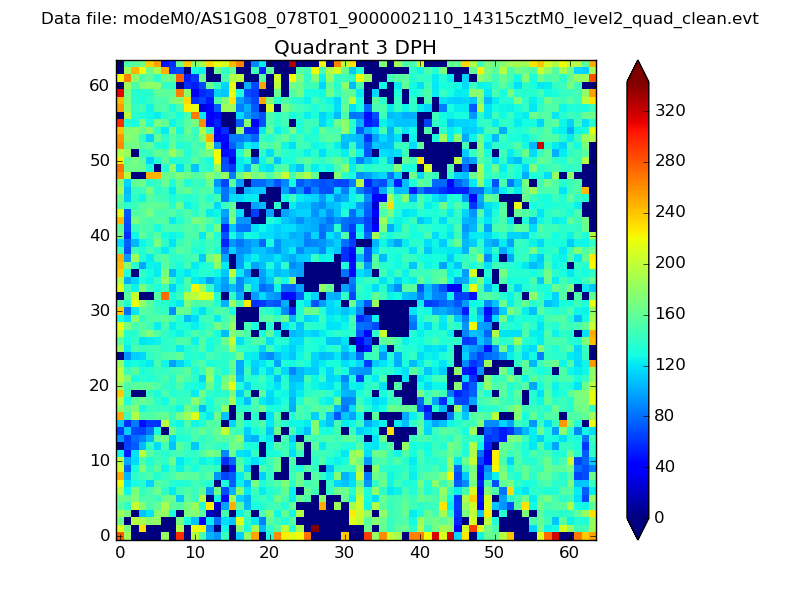 |
 |
Quadrant C |
| Plot type | Count rate plots | Images |
|---|---|---|
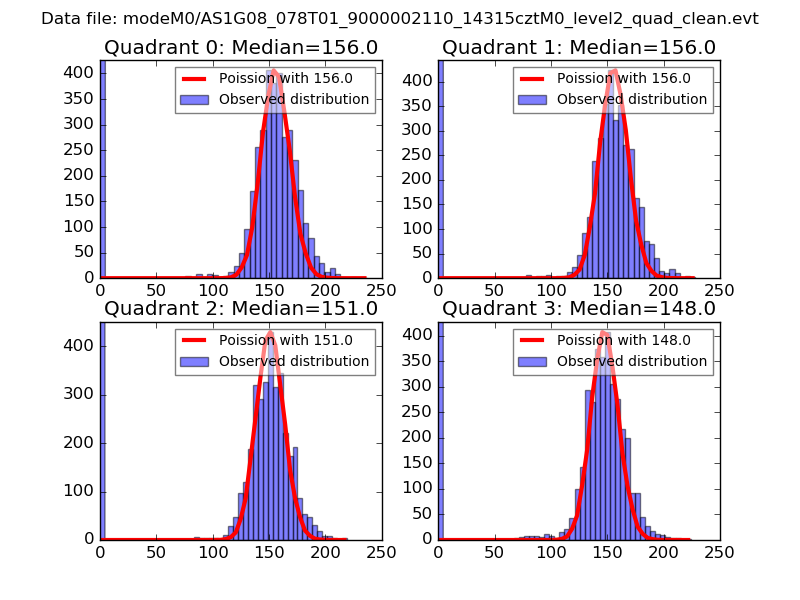
| Comparison with Poisson distribution Blue bars denote a histogram of data divided into 1 sec bins. Red curve is a Poisson curve with rate = median count rate of data. |
 |
 |
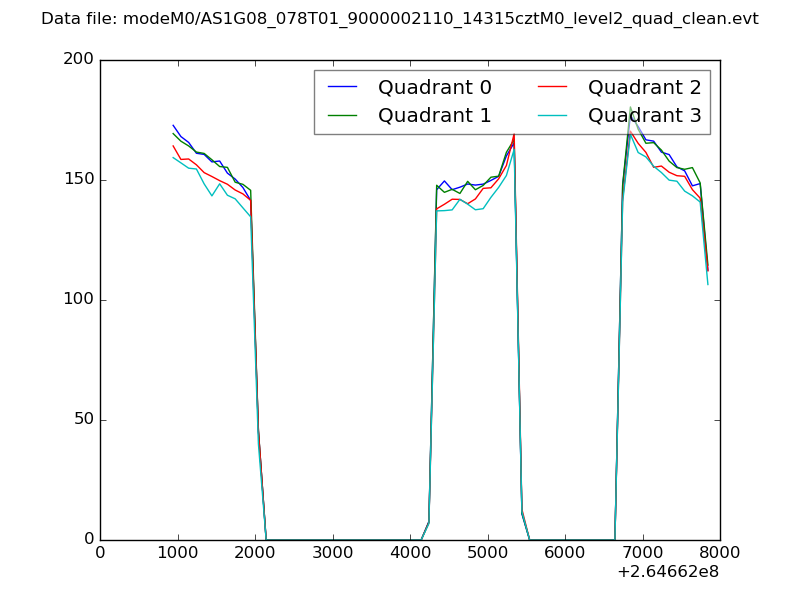
| Quadrant-wise count rates Data is divided into 100 sec bins |
 |
|
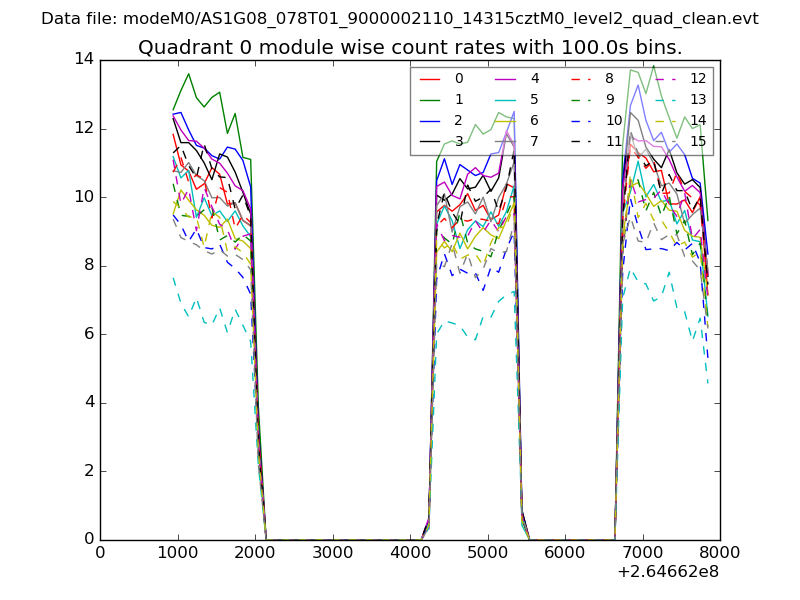
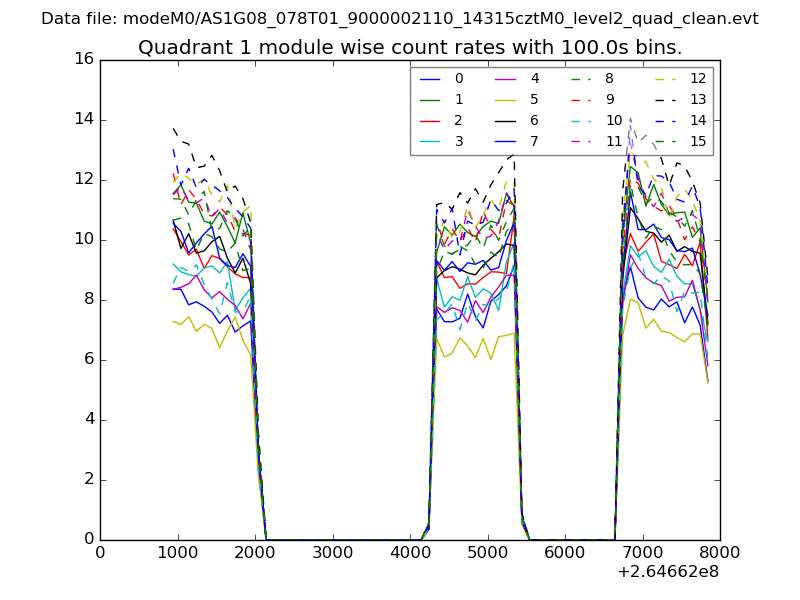
| Module-wise count rates for Quadrant A Data is divided into 100 sec bins |
 |
 |
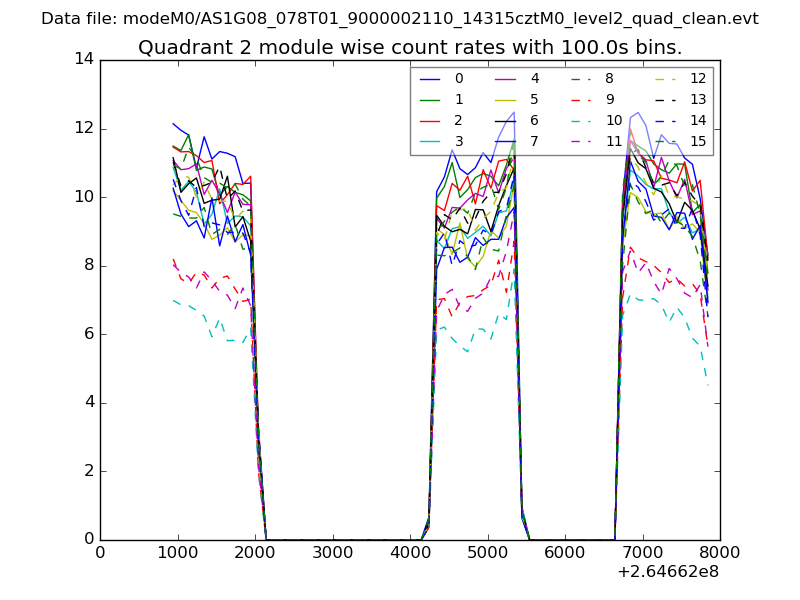
| Module-wise count rates for Quadrant B Data is divided into 100 sec bins |
 |
 |
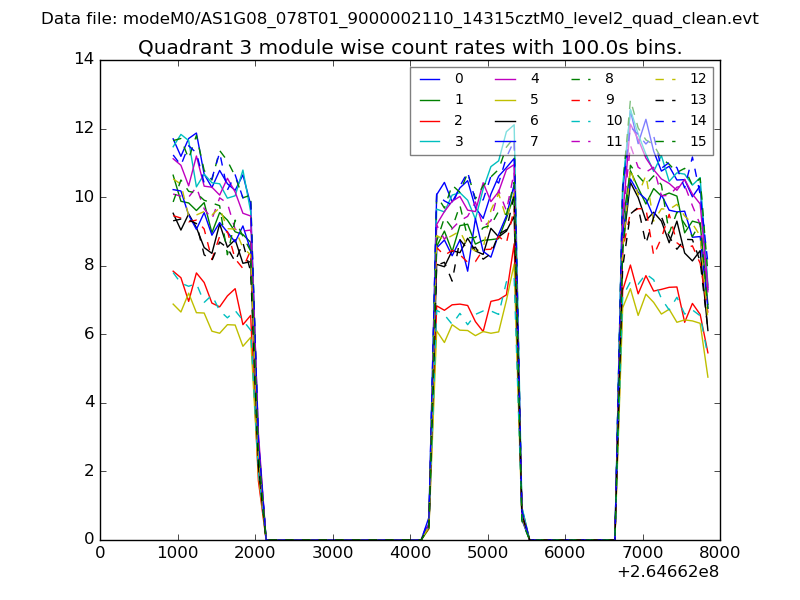
| Module-wise count rates for Quadrant C Data is divided into 100 sec bins |
 |
 |
| Module-wise count rates for Quadrant D Data is divided into 100 sec bins |
 |
 |
| Parameter | Plot |
|---|---|
| CZT HV Monitor | 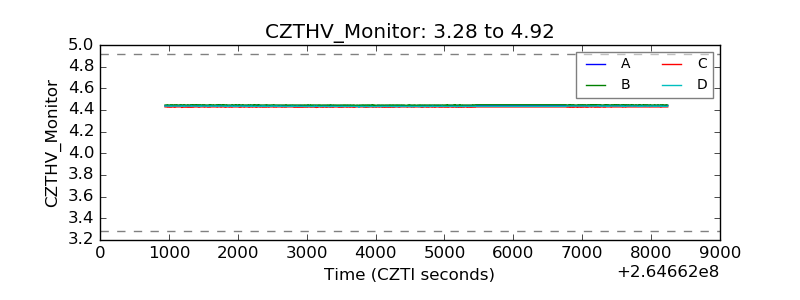 |
| D_VDD | 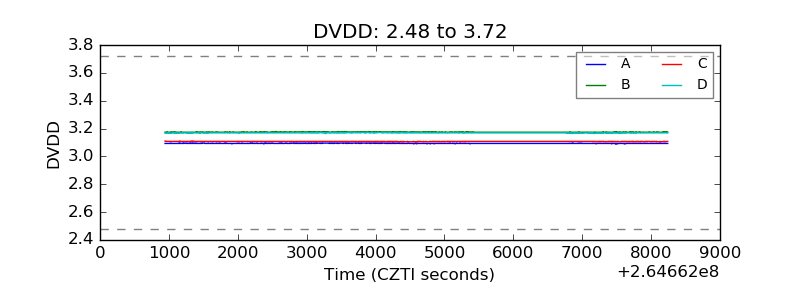 |
| Temperature 1 | 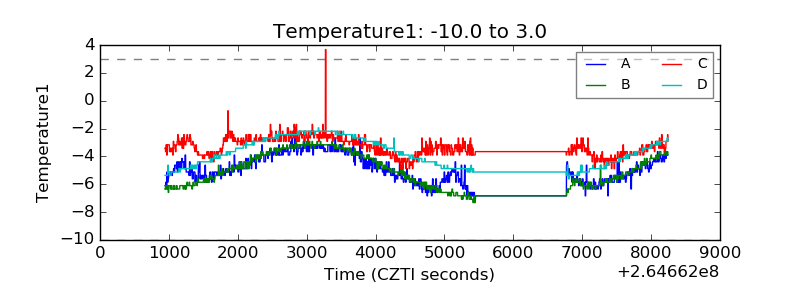 |
| Veto HV Monitor | 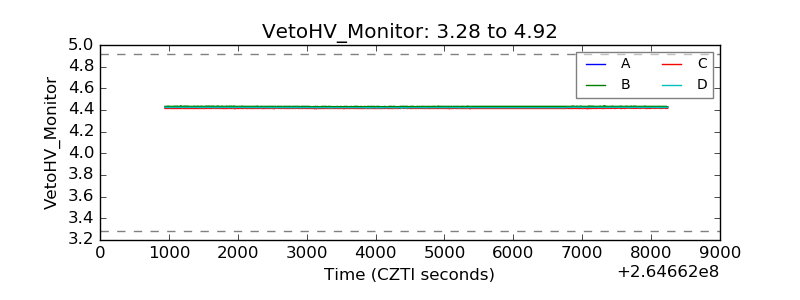 |
| Veto LLD | 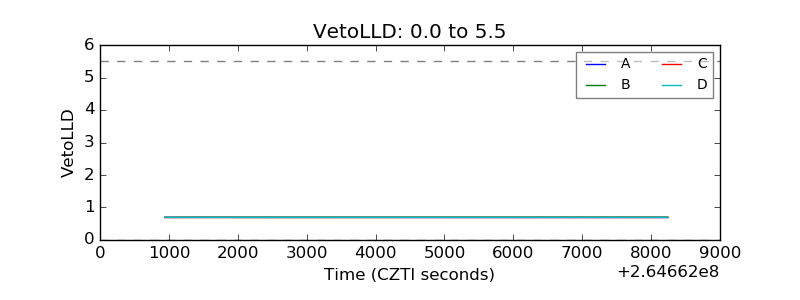 |
| Alpha Counter | 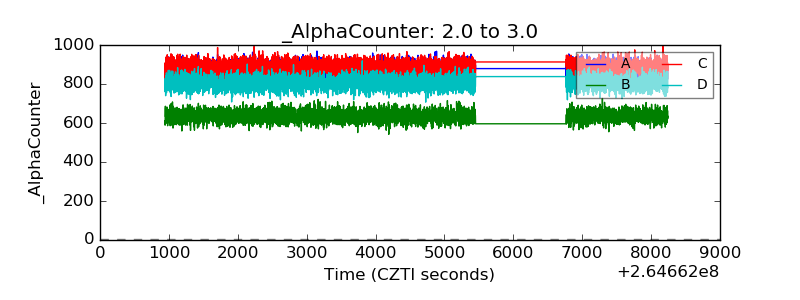 |
| _CPM_Rate | 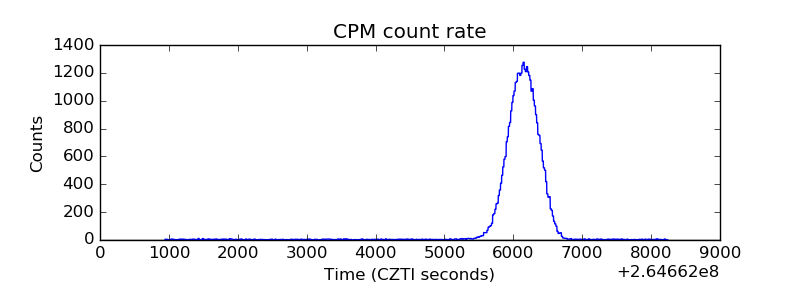 |
| CZT Counter | 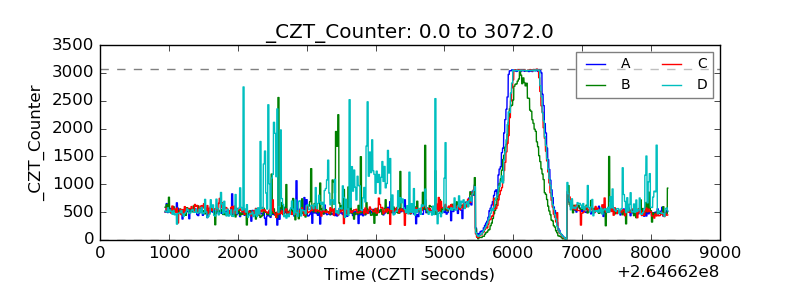 |
| +2.5 Volts monitor |  |
| +5 Volts monitor |  |
| _ROLL_ROT | 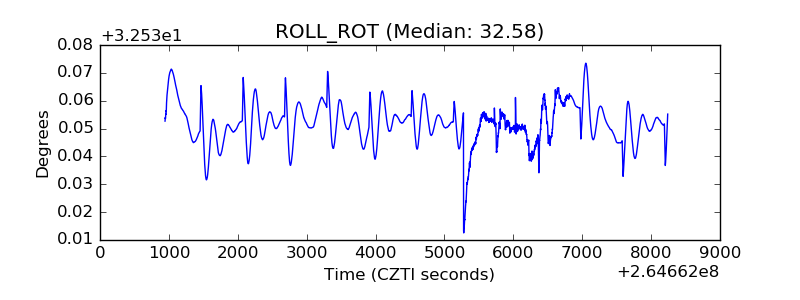 |
| _Roll_DEC | 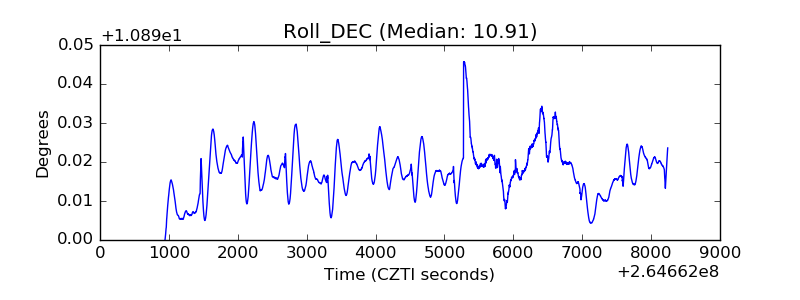 |
| _Roll_RA | 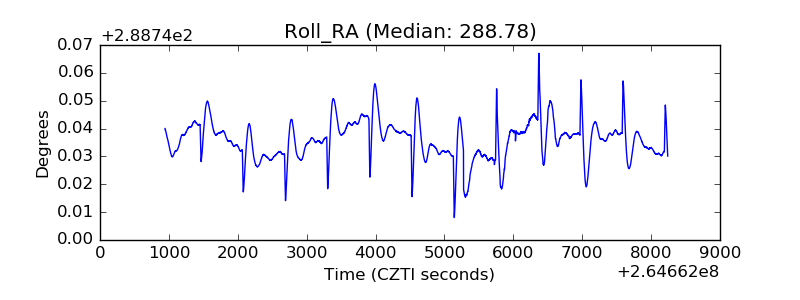 |
| Veto Counter | 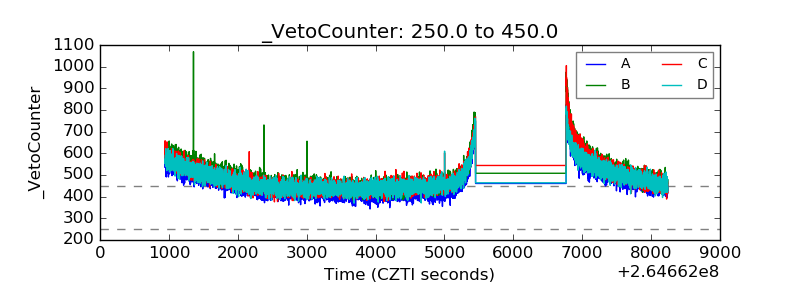 |