| Param | Original file | Final file |
|---|---|---|
| Filename | modeM0/AS1G08_078T01_9000002110_14318cztM0_level2.evt | modeM0/AS1G08_078T01_9000002110_14318cztM0_level2_quad_clean.evt |
| Size (bytes) | 513,239,040 | 72,184,320 |
| Size | 489.5 MB | 68.8 MB |
| Events in quadrant A | 3,504,964 | 434,947 |
| Events in quadrant B | 3,657,983 | 430,645 |
| Events in quadrant C | 3,505,428 | 425,852 |
| Events in quadrant D | 4,402,124 | 408,771 |
| Mode SS | |||
|---|---|---|---|
| Quadrant | BADHDUFLAG | Total packets | Discarded packets |
| A | 0 | 142 | 0 |
| B | 0 | 142 | 0 |
| C | 0 | 142 | 0 |
| D | 0 | 142 | 0 |
| Mode M0 | |||
|---|---|---|---|
| Quadrant | BADHDUFLAG | Total packets | Discarded packets |
| A | 0 | 14649 | 2 |
| B | 0 | 15168 | 1 |
| C | 0 | 14374 | 1 |
| D | 0 | 17674 | 1 |
| Mode M9 | |||
|---|---|---|---|
| Quadrant | BADHDUFLAG | Total packets | Discarded packets |
| A | 0 | 6 | 0 |
| B | 0 | 6 | 0 |
| C | 0 | 6 | 0 |
| D | 0 | 6 | 0 |
| Quadrant | Total seconds | Saturated seconds | Saturation percentage |
|---|---|---|---|
| A | 6966 | 80 | 1.148435% |
| B | 6966 | 129 | 1.851852% |
| C | 6966 | 50 | 0.717772% |
| D | 6966 | 210 | 3.014643% |
Noise dominated data is calculated using 1-second bins in cleaned event files. If a bin has >2000 counts, and if more than 50% of those come from <1% of pixels, then it is considered to be noise-dominated and hence unusable.
| Quadrant | # 1 sec bins | Bins with >0 counts | Bins with >2000 counts | High rate bins dominated by noise | Noise dominated (total time) | Noise dominated (detector-on time) | Marked lightcurve |
|---|---|---|---|---|---|---|---|
| A | 7562 | 6967 | 1 | 1 | 0.01% | 0.01% | 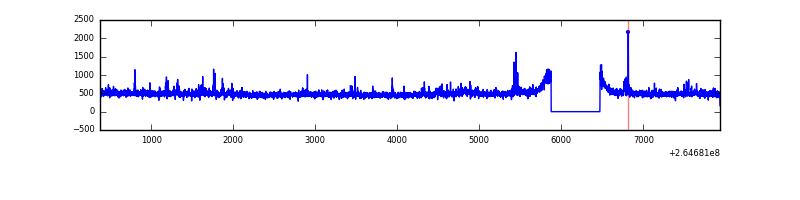 |
| B | 7562 | 6967 | 29 | 29 | 0.38% | 0.42% | 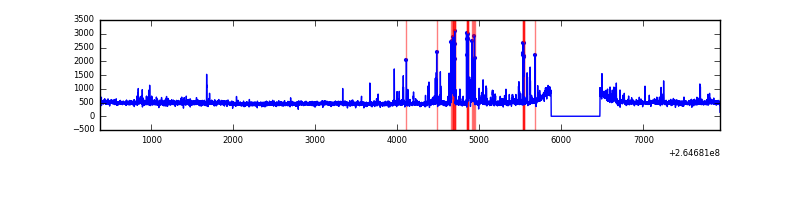 |
| C | 7562 | 6967 | 0 | 0 | 0.00% | 0.00% | 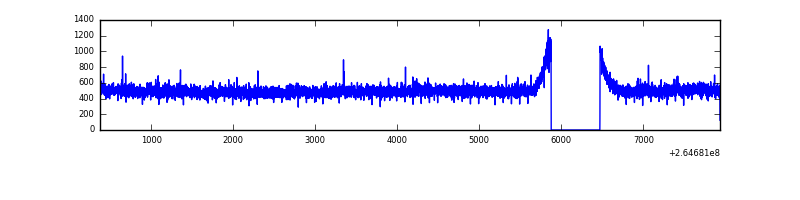 |
| D | 7562 | 6967 | 131 | 131 | 1.73% | 1.88% | 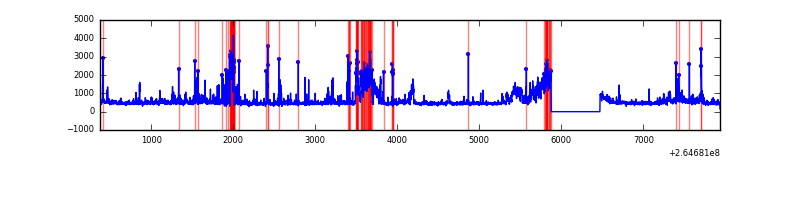 |
Top three noisy pixels from each quadrant. If the there are fewer than three noisy pixels in the level2.evt file, extra rows are filled as -1
| Pixel properties | Quadrant properties | ||||||
|---|---|---|---|---|---|---|---|
| Quadrant | DetID | PixID | Counts | Sigma | Mean | Median | Sigma |
| A | 9 | 143 | 80041 | 450.97 | 859 | 841 | 175.6 |
| A | 12 | 189 | 77113 | 434.3 | 859 | 841 | 175.6 |
| A | 8 | 15 | 37094 | 206.43 | 859 | 841 | 175.6 |
| B | 0 | 229 | 231199 | 1393.74 | 850 | 826 | 165.3 |
| B | 4 | 48 | 34082 | 201.2 | 850 | 826 | 165.3 |
| B | 0 | 219 | 24648 | 144.12 | 850 | 826 | 165.3 |
| C | 3 | 233 | 287042 | 1494.17 | 825 | 830 | 191.6 |
| C | 13 | 61 | 5952 | 26.74 | 825 | 830 | 191.6 |
| C | 10 | 22 | 3410 | 13.47 | 825 | 830 | 191.6 |
| D | 12 | 110 | 538146 | 2747.99 | 814 | 794 | 195.5 |
| D | 1 | 52 | 322079 | 1643.03 | 814 | 794 | 195.5 |
| D | 5 | 222 | 212162 | 1080.92 | 814 | 794 | 195.5 |
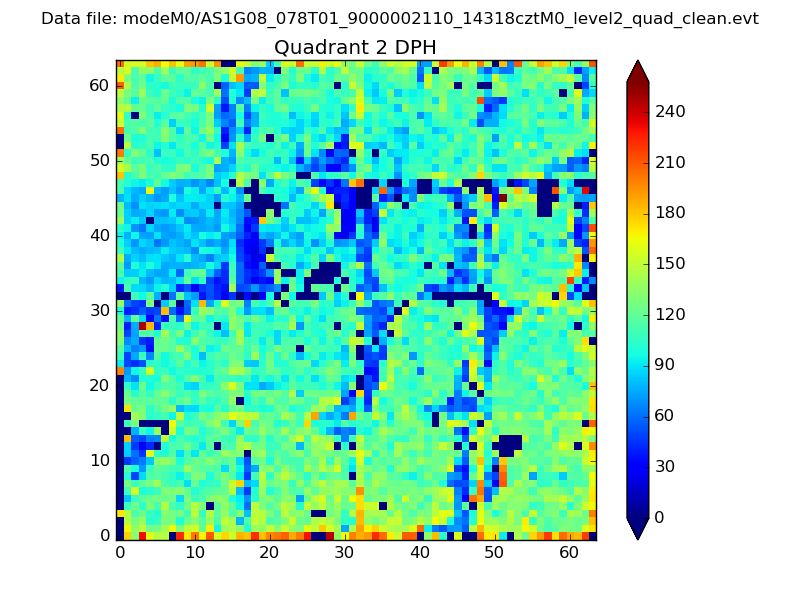
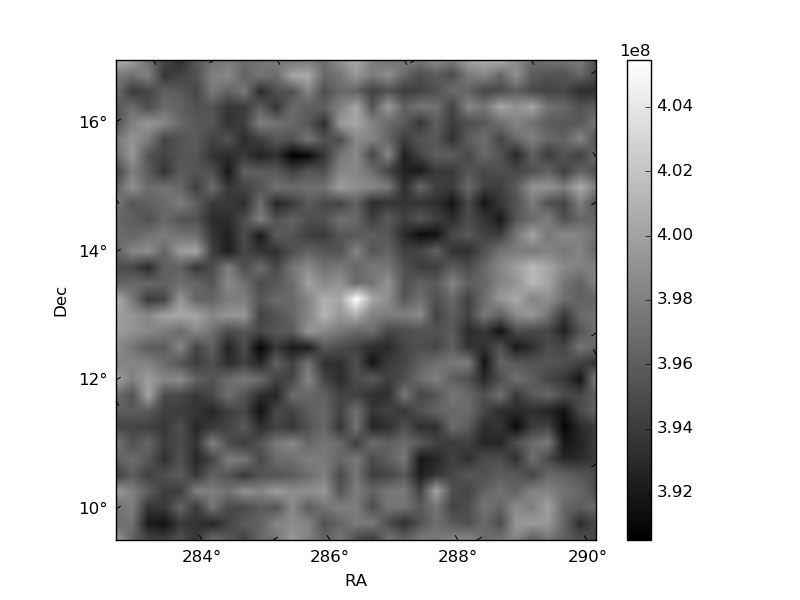
Histogram calculated using DETX and DETY for each event in the final _common_clean file
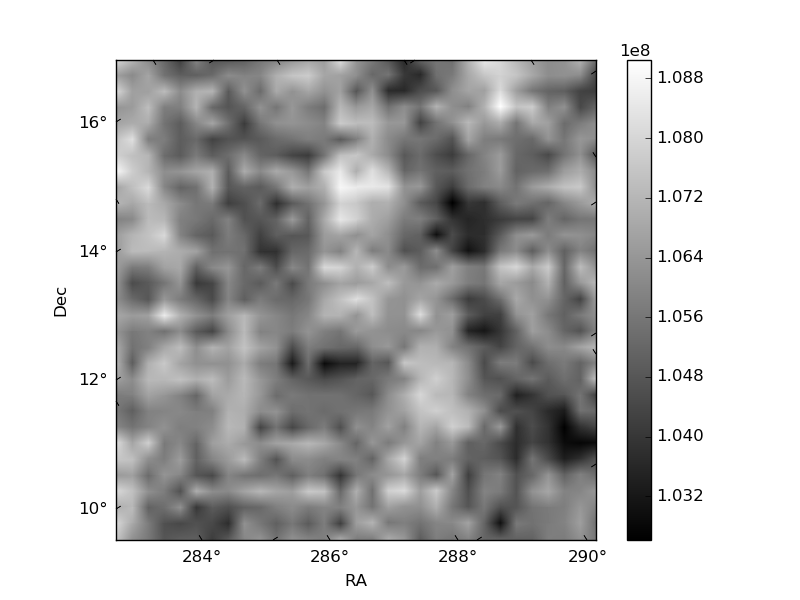
| Quadrant A | 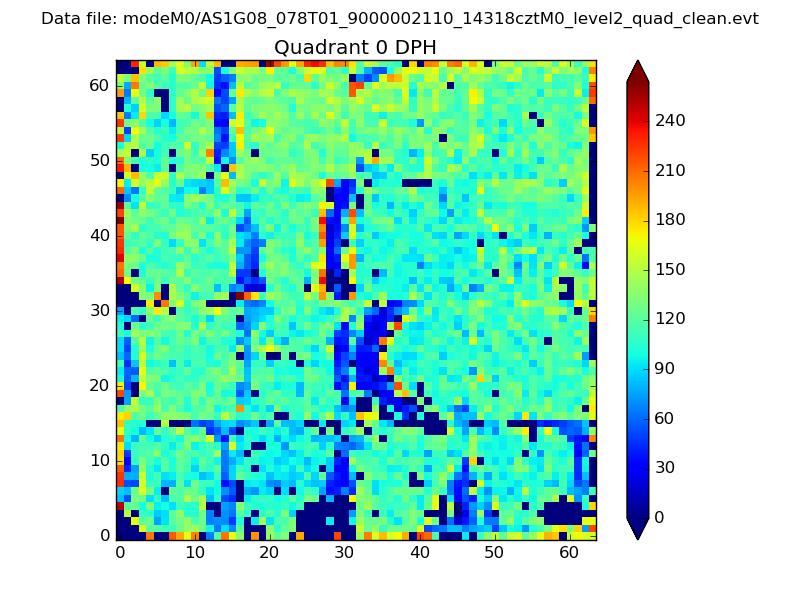 |
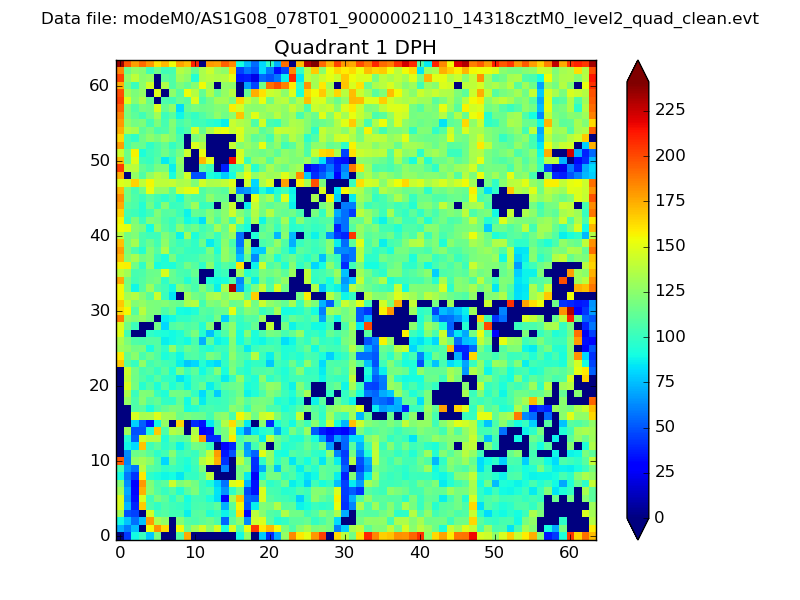 |
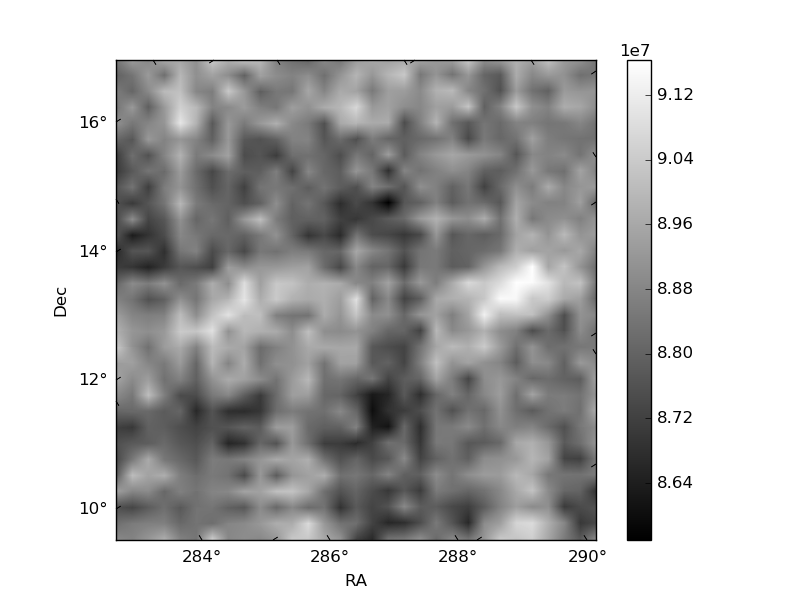
Quadrant B |
|---|---|---|---|
| Quadrant D | 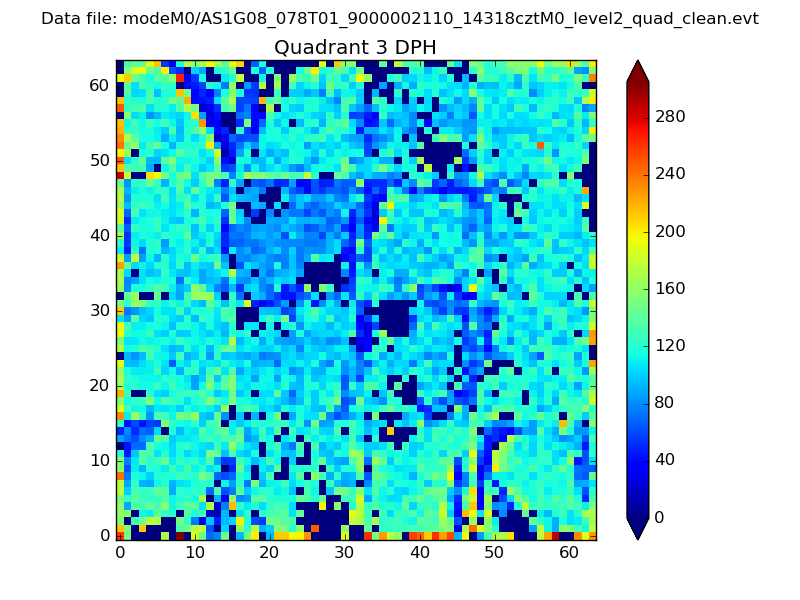 |
 |
Quadrant C |
| Plot type | Count rate plots | Images |
|---|---|---|
| Comparison with Poisson distribution Blue bars denote a histogram of data divided into 1 sec bins. Red curve is a Poisson curve with rate = median count rate of data. |
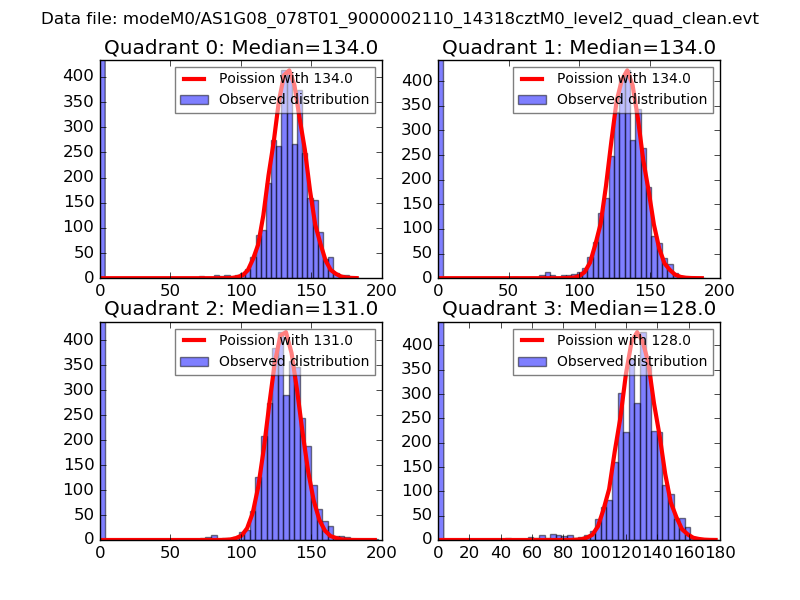 |
 |
| Quadrant-wise count rates Data is divided into 100 sec bins |
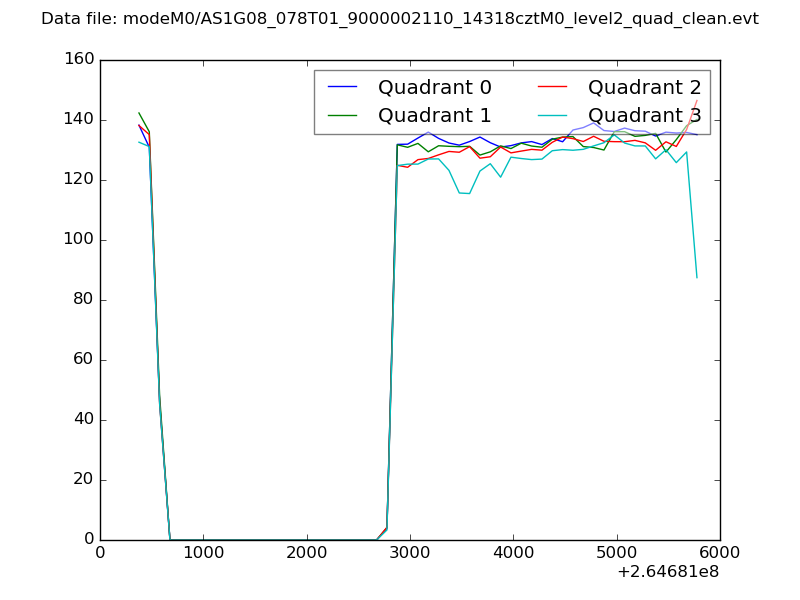 |
|
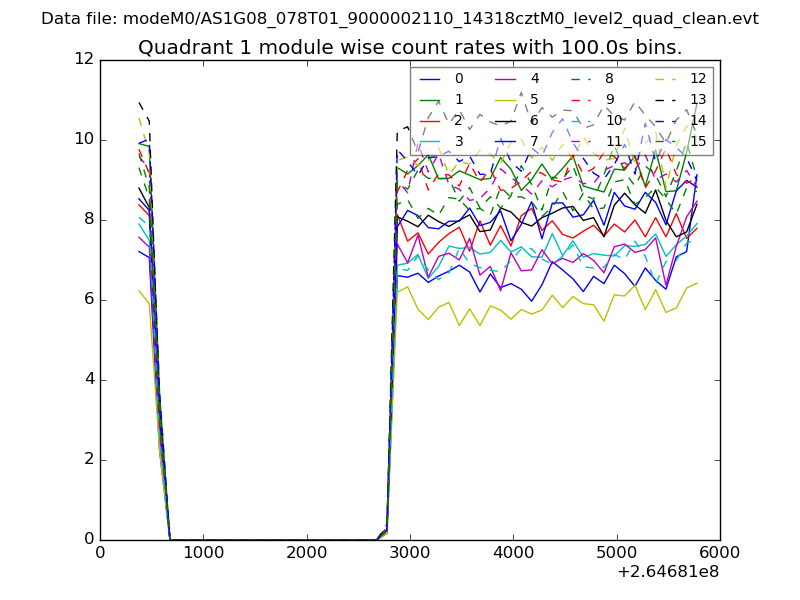
| Module-wise count rates for Quadrant A Data is divided into 100 sec bins |
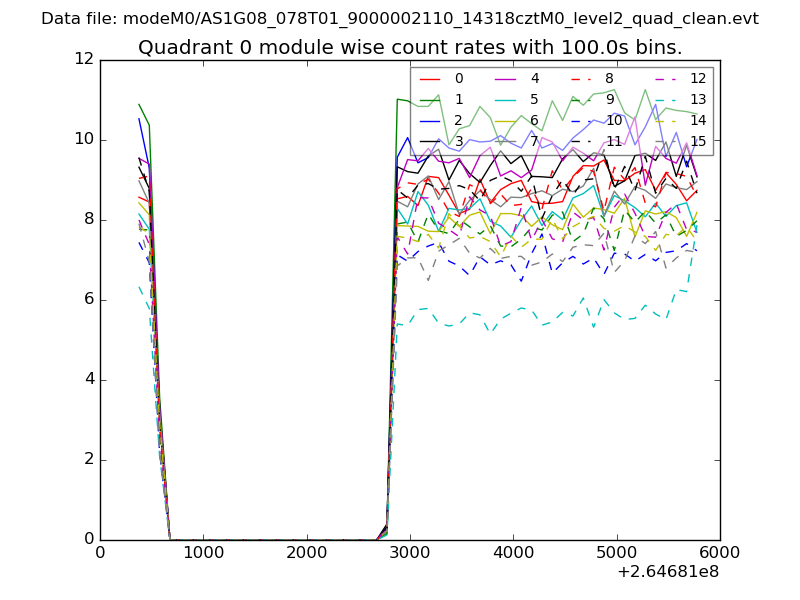 |
 |
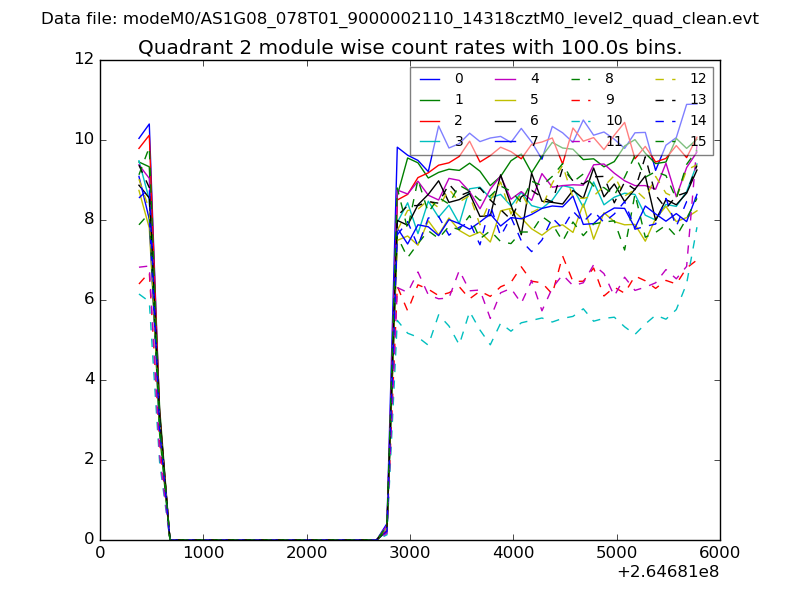
| Module-wise count rates for Quadrant B Data is divided into 100 sec bins |
 |
 |
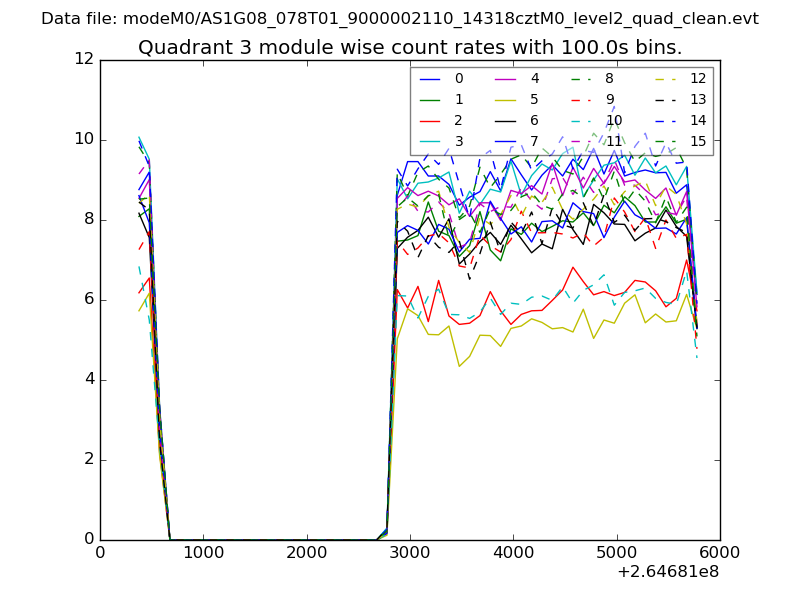
| Module-wise count rates for Quadrant C Data is divided into 100 sec bins |
 |
 |
| Module-wise count rates for Quadrant D Data is divided into 100 sec bins |
 |
 |
| Parameter | Plot |
|---|---|
| CZT HV Monitor | 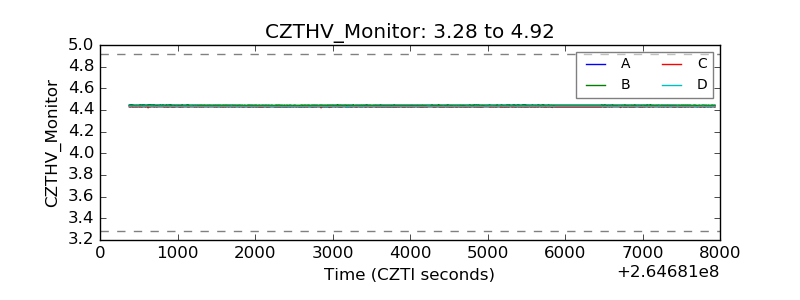 |
| D_VDD | 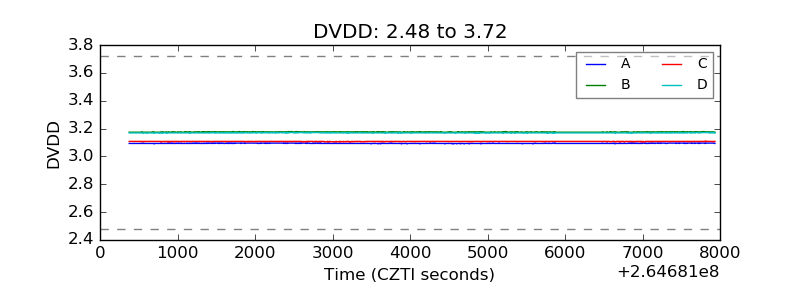 |
| Temperature 1 | 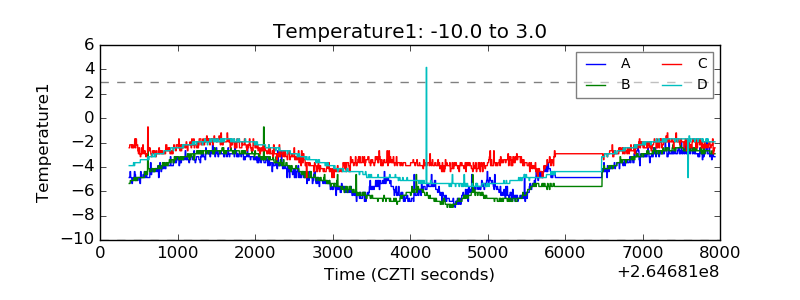 |
| Veto HV Monitor | 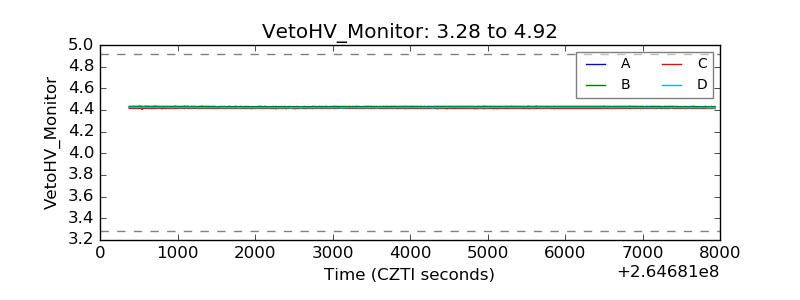 |
| Veto LLD | 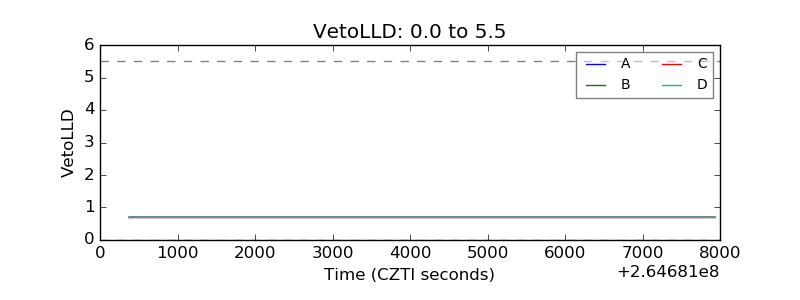 |
| Alpha Counter | 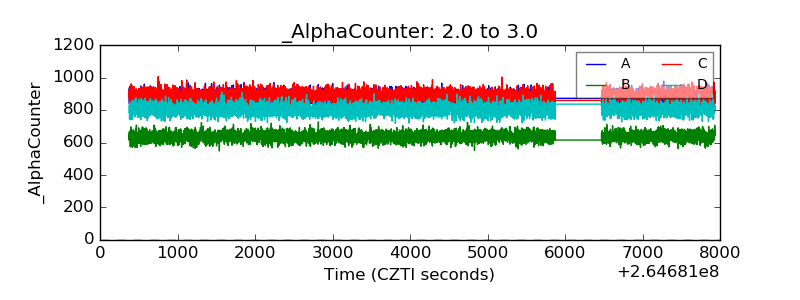 |
| _CPM_Rate | 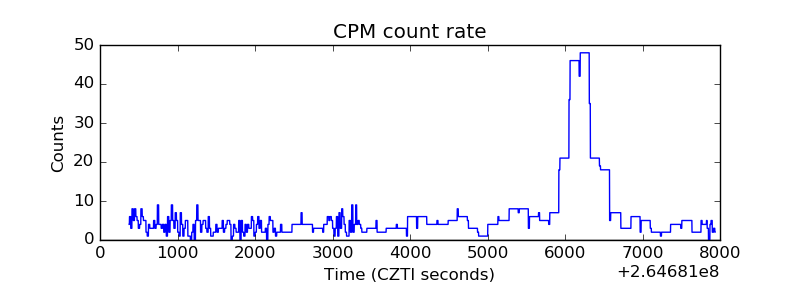 |
| CZT Counter | 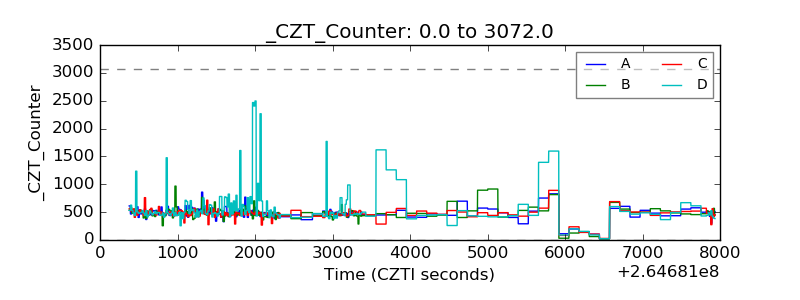 |
| +2.5 Volts monitor | 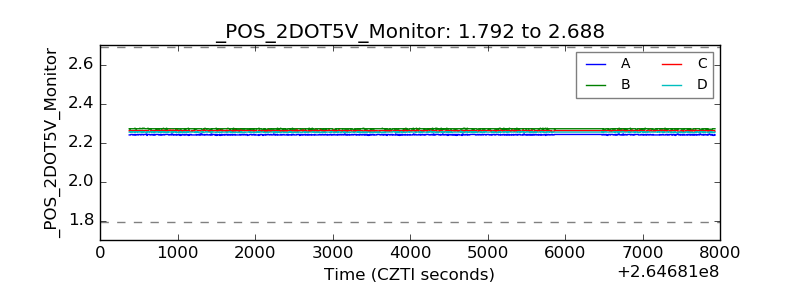 |
| +5 Volts monitor |  |
| _ROLL_ROT | 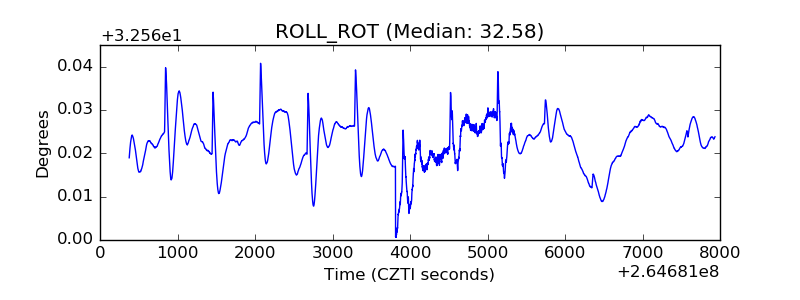 |
| _Roll_DEC | 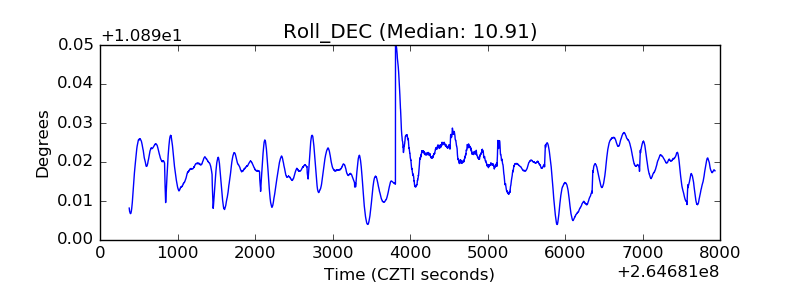 |
| _Roll_RA | 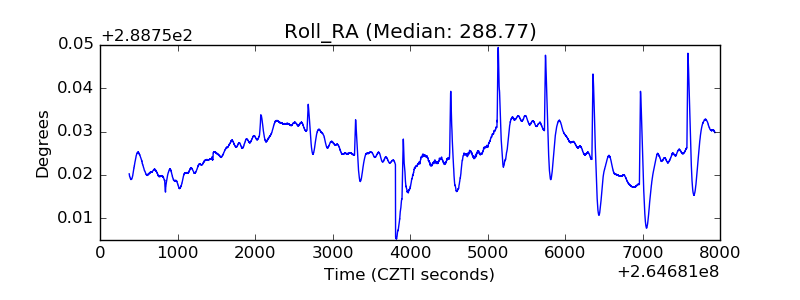 |
| Veto Counter | 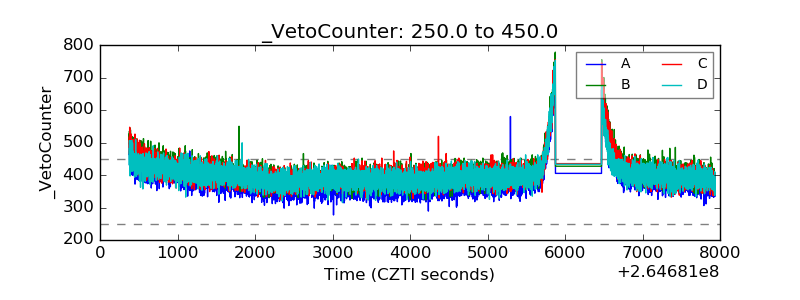 |