| Param | Original file | Final file |
|---|---|---|
| Filename | modeM0/AS1G08_078T01_9000002110_14319cztM0_level2.evt | modeM0/AS1G08_078T01_9000002110_14319cztM0_level2_quad_clean.evt |
| Size (bytes) | 637,577,280 | 81,106,560 |
| Size | 608.0 MB | 77.3 MB |
| Events in quadrant A | 3,959,204 | 490,965 |
| Events in quadrant B | 3,994,373 | 490,341 |
| Events in quadrant C | 4,113,284 | 481,831 |
| Events in quadrant D | 6,717,781 | 454,238 |
| Mode SS | |||
|---|---|---|---|
| Quadrant | BADHDUFLAG | Total packets | Discarded packets |
| A | 0 | 158 | 0 |
| B | 0 | 158 | 0 |
| C | 0 | 158 | 0 |
| D | 0 | 158 | 0 |
| Mode M0 | |||
|---|---|---|---|
| Quadrant | BADHDUFLAG | Total packets | Discarded packets |
| A | 0 | 16572 | 3 |
| B | 0 | 16721 | 2 |
| C | 0 | 16568 | 2 |
| D | 0 | 25316 | 2 |
| Mode M9 | |||
|---|---|---|---|
| Quadrant | BADHDUFLAG | Total packets | Discarded packets |
| A | 0 | 8 | 0 |
| B | 0 | 8 | 0 |
| C | 0 | 8 | 0 |
| D | 0 | 8 | 0 |
| Quadrant | Total seconds | Saturated seconds | Saturation percentage |
|---|---|---|---|
| A | 7747 | 254 | 3.278689% |
| B | 7747 | 277 | 3.575578% |
| C | 7747 | 213 | 2.749451% |
| D | 7747 | 698 | 9.009939% |
Noise dominated data is calculated using 1-second bins in cleaned event files. If a bin has >2000 counts, and if more than 50% of those come from <1% of pixels, then it is considered to be noise-dominated and hence unusable.
| Quadrant | # 1 sec bins | Bins with >0 counts | Bins with >2000 counts | High rate bins dominated by noise | Noise dominated (total time) | Noise dominated (detector-on time) | Marked lightcurve |
|---|---|---|---|---|---|---|---|
| A | 8538 | 7748 | 3 | 3 | 0.04% | 0.04% | 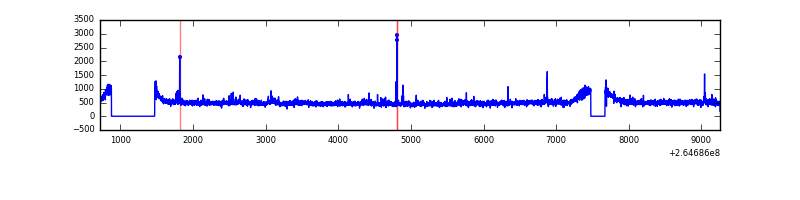 |
| B | 8538 | 7748 | 1 | 1 | 0.01% | 0.01% | 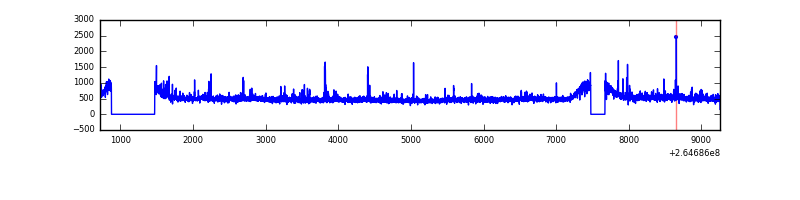 |
| C | 8538 | 7748 | 0 | 0 | 0.00% | 0.00% | 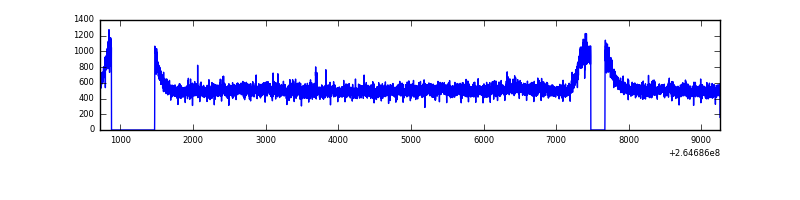 |
| D | 8538 | 7748 | 357 | 357 | 4.18% | 4.61% | 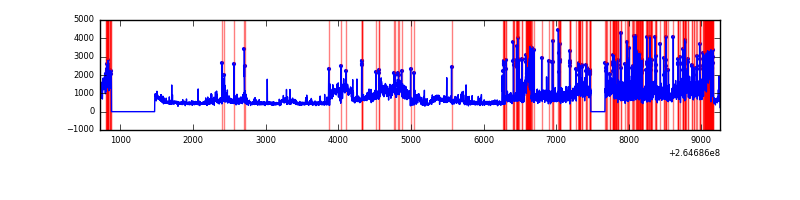 |
Top three noisy pixels from each quadrant. If the there are fewer than three noisy pixels in the level2.evt file, extra rows are filled as -1
| Pixel properties | Quadrant properties | ||||||
|---|---|---|---|---|---|---|---|
| Quadrant | DetID | PixID | Counts | Sigma | Mean | Median | Sigma |
| A | 12 | 189 | 121115 | 598.0 | 983 | 960 | 200.9 |
| A | 8 | 15 | 33612 | 162.51 | 983 | 960 | 200.9 |
| A | 9 | 143 | 18620 | 87.89 | 983 | 960 | 200.9 |
| B | 0 | 229 | 51248 | 264.69 | 972 | 947 | 190.0 |
| B | 10 | 245 | 37895 | 194.43 | 972 | 947 | 190.0 |
| B | 0 | 219 | 29308 | 149.24 | 972 | 947 | 190.0 |
| C | 3 | 233 | 411143 | 1843.74 | 948 | 954 | 222.5 |
| C | 13 | 61 | 6733 | 25.98 | 948 | 954 | 222.5 |
| C | 10 | 22 | 4653 | 16.63 | 948 | 954 | 222.5 |
| D | 5 | 222 | 1885102 | 8590.97 | 913 | 889 | 219.3 |
| D | 12 | 110 | 961328 | 4379.07 | 913 | 889 | 219.3 |
| D | 1 | 52 | 178917 | 811.71 | 913 | 889 | 219.3 |
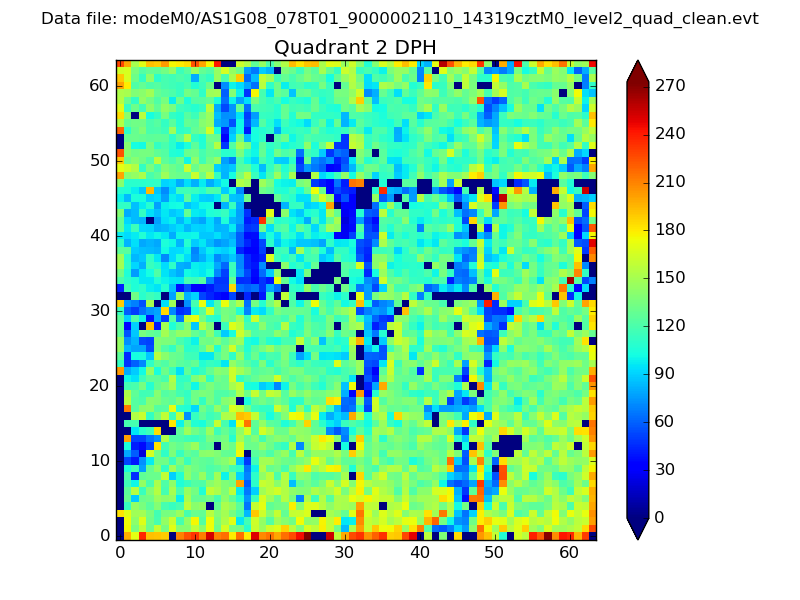
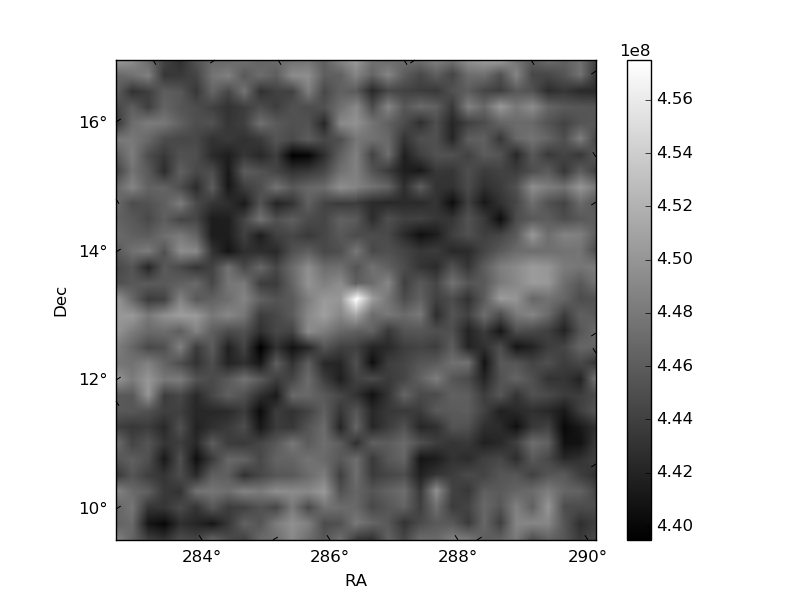
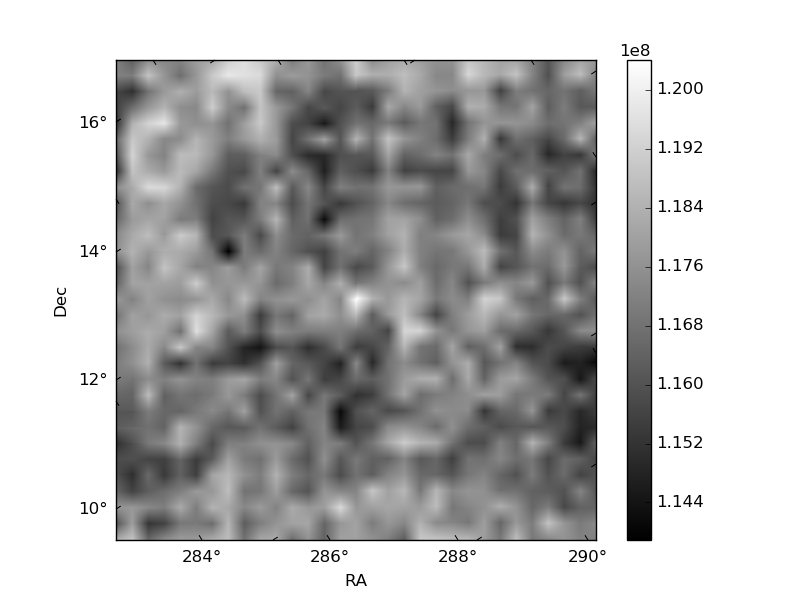
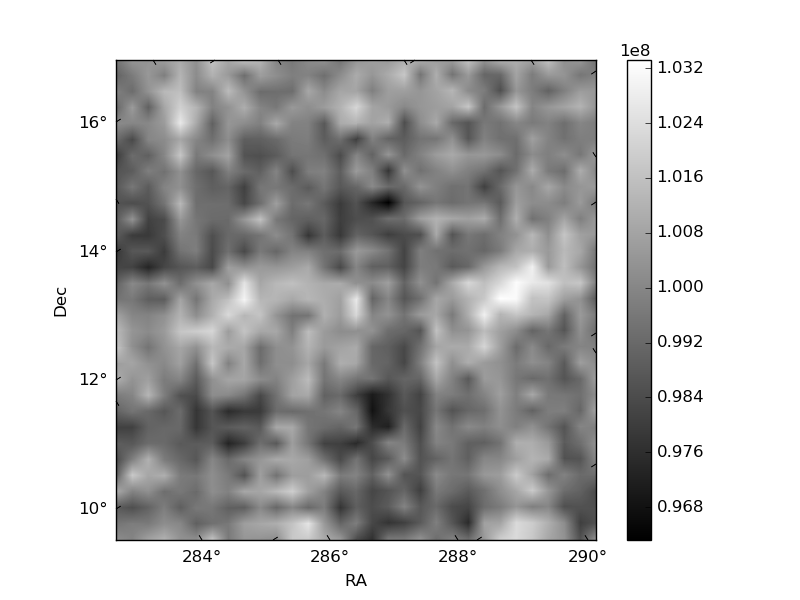
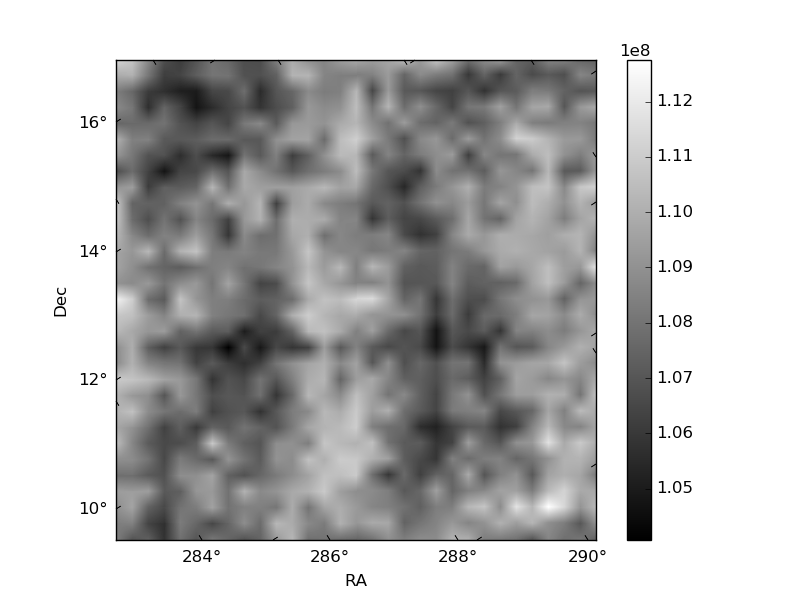
Histogram calculated using DETX and DETY for each event in the final _common_clean file
| Quadrant A | 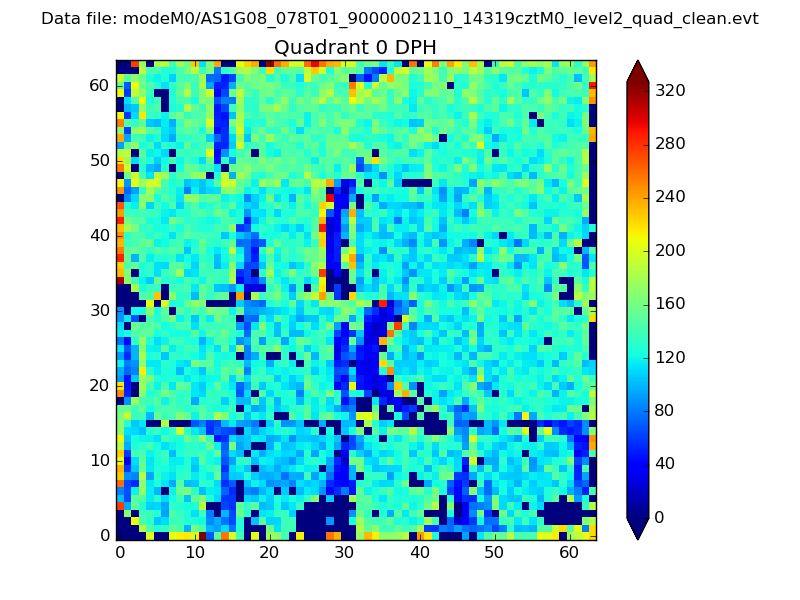 |
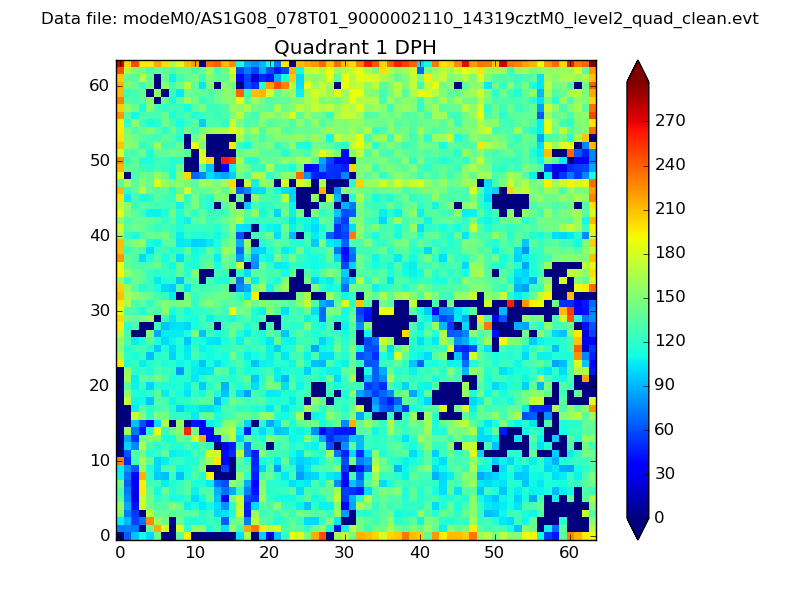 |
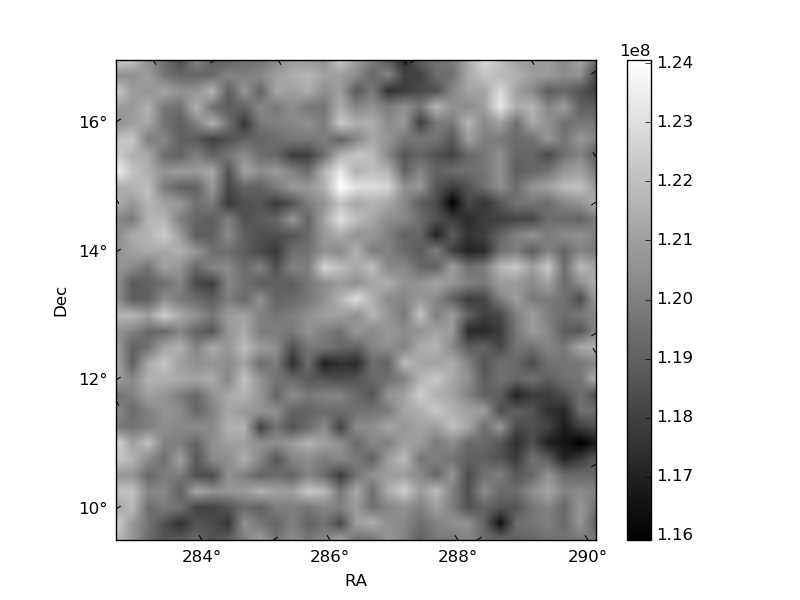
Quadrant B |
|---|---|---|---|
| Quadrant D | 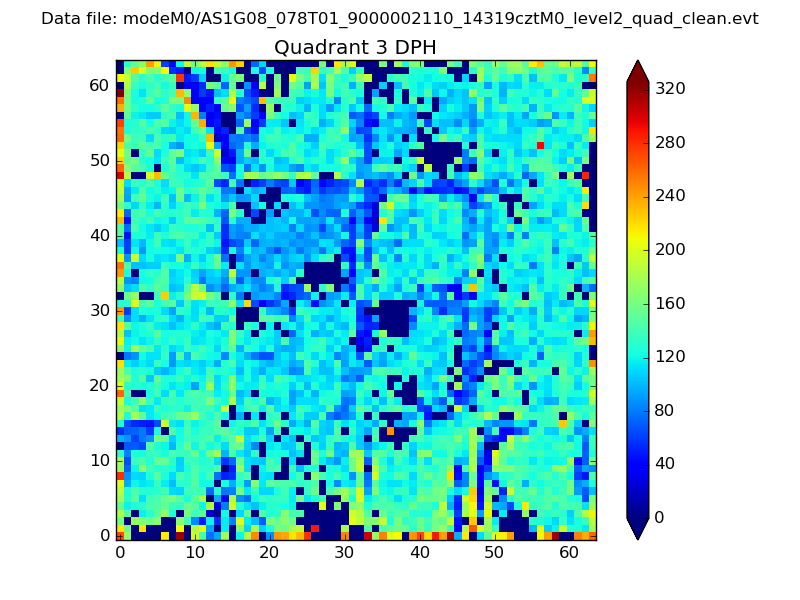 |
 |
Quadrant C |
| Plot type | Count rate plots | Images |
|---|---|---|
| Comparison with Poisson distribution Blue bars denote a histogram of data divided into 1 sec bins. Red curve is a Poisson curve with rate = median count rate of data. |
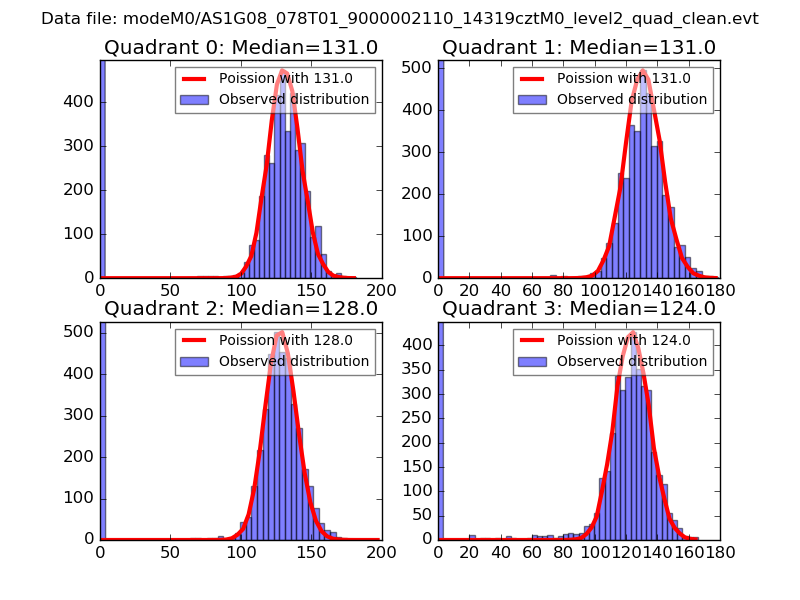 |
 |
| Quadrant-wise count rates Data is divided into 100 sec bins |
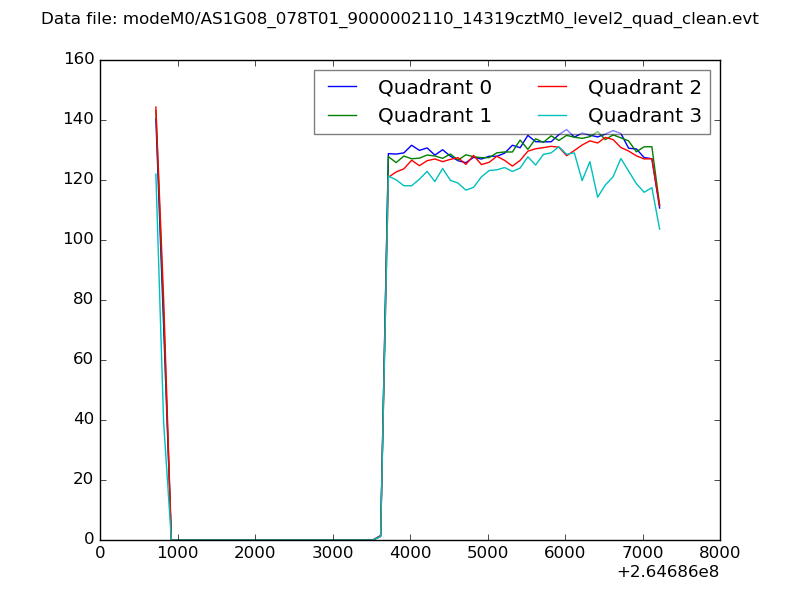 |
|
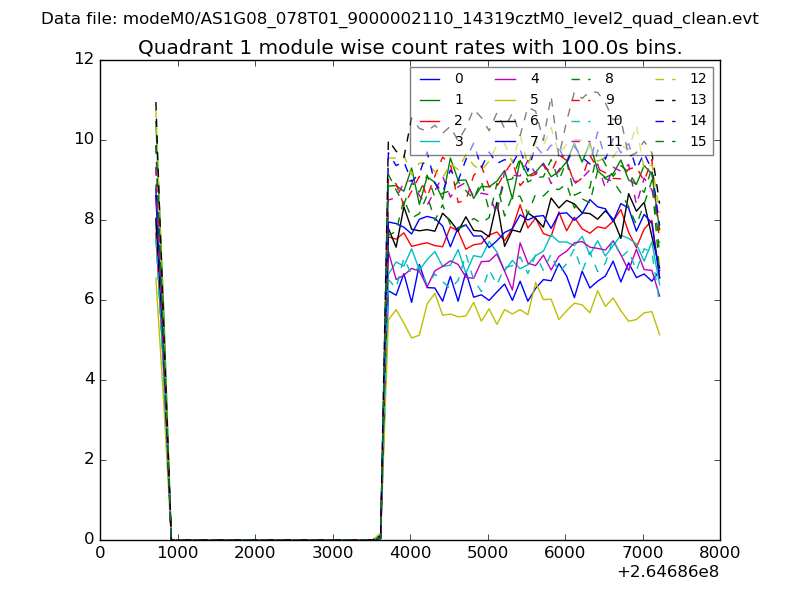
| Module-wise count rates for Quadrant A Data is divided into 100 sec bins |
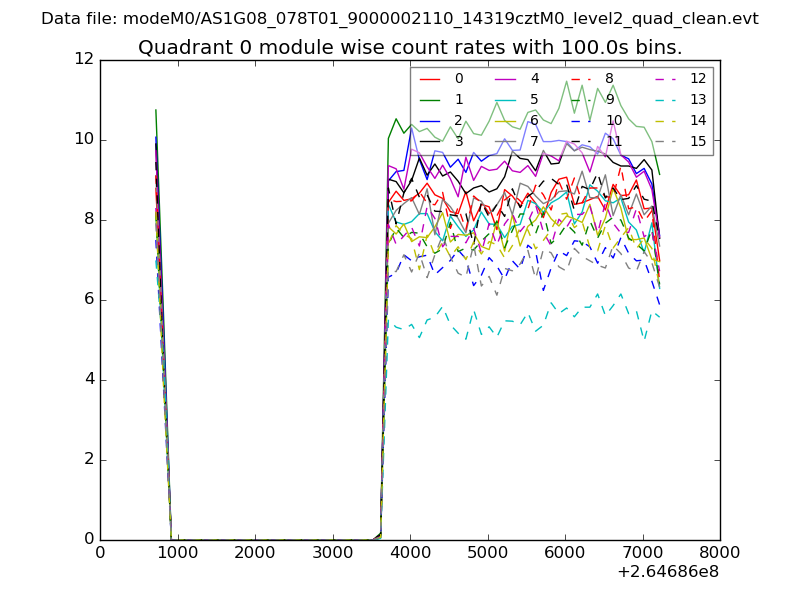 |
 |
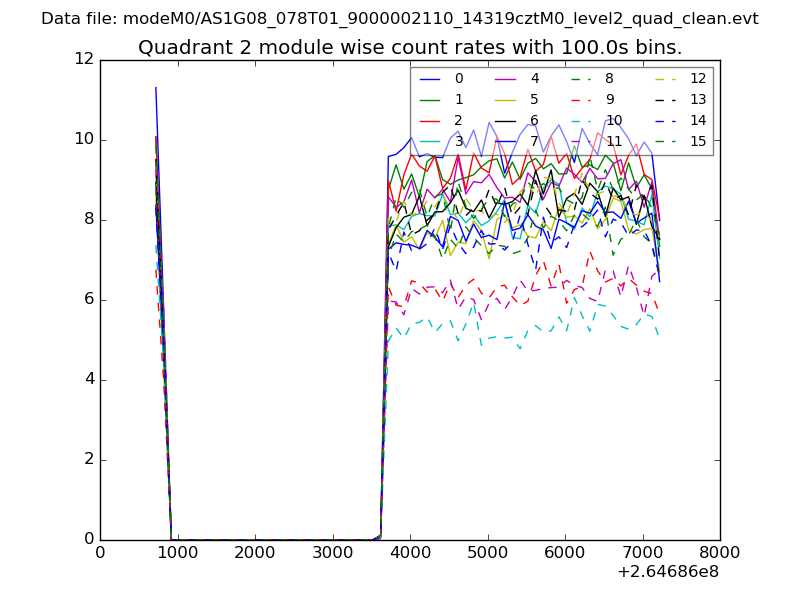
| Module-wise count rates for Quadrant B Data is divided into 100 sec bins |
 |
 |
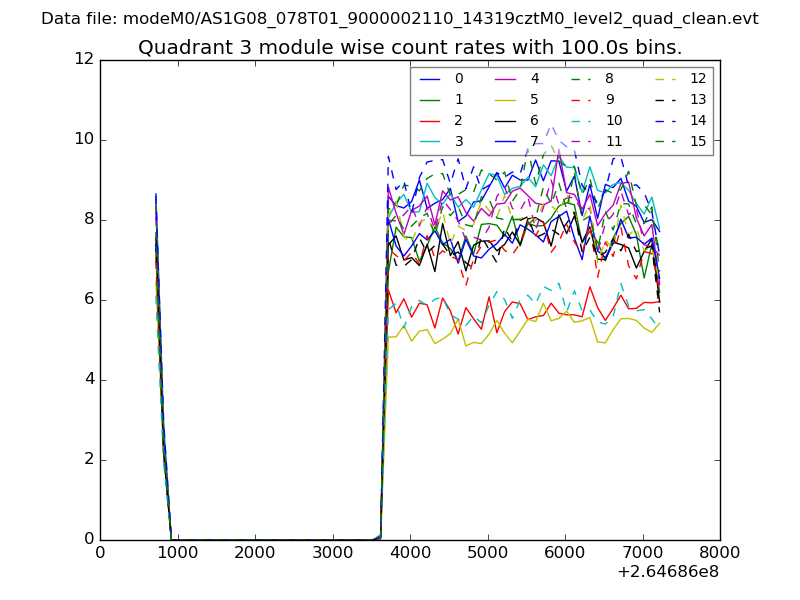
| Module-wise count rates for Quadrant C Data is divided into 100 sec bins |
 |
 |
| Module-wise count rates for Quadrant D Data is divided into 100 sec bins |
 |
 |
| Parameter | Plot |
|---|---|
| CZT HV Monitor | 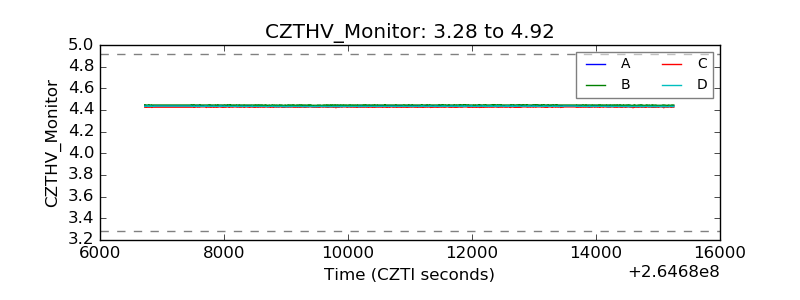 |
| D_VDD | 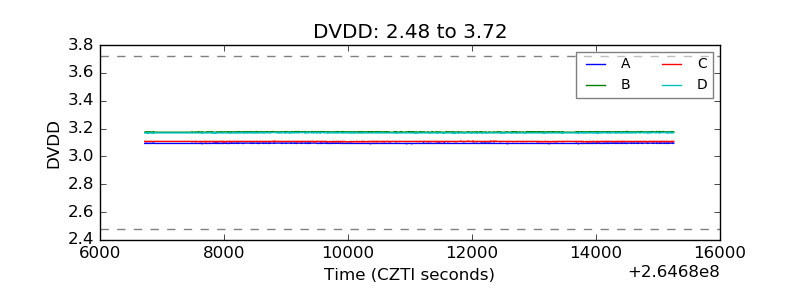 |
| Temperature 1 | 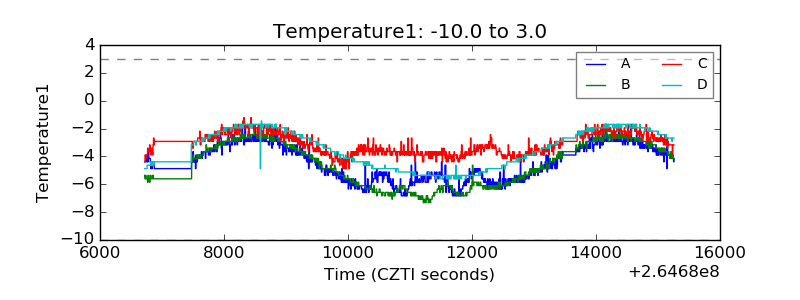 |
| Veto HV Monitor | 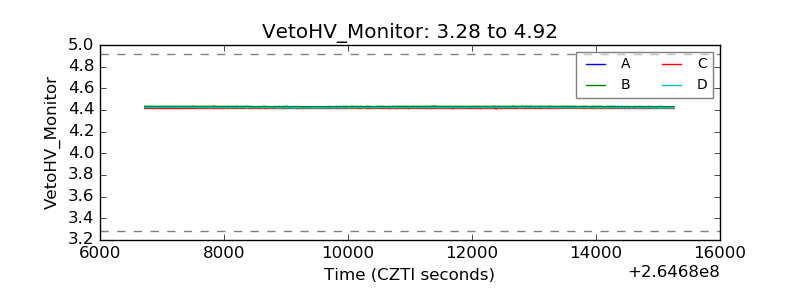 |
| Veto LLD | 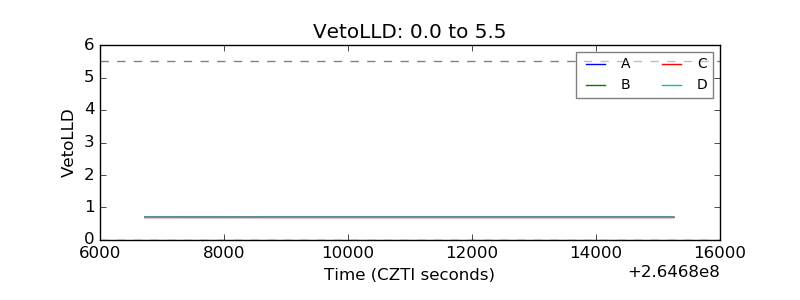 |
| Alpha Counter | 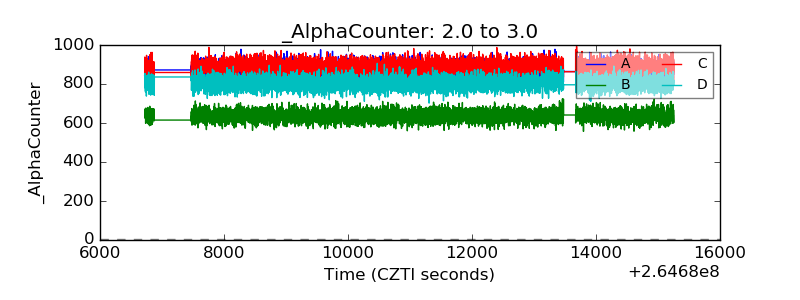 |
| _CPM_Rate | 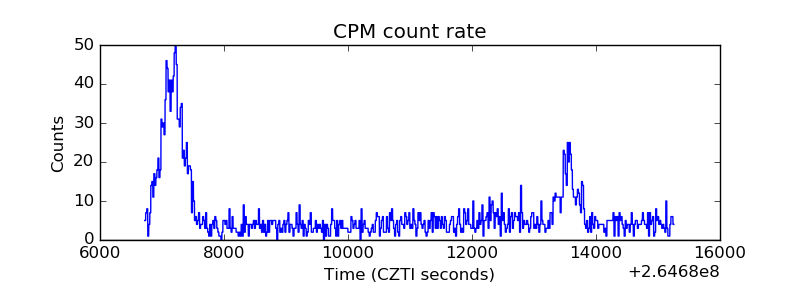 |
| CZT Counter | 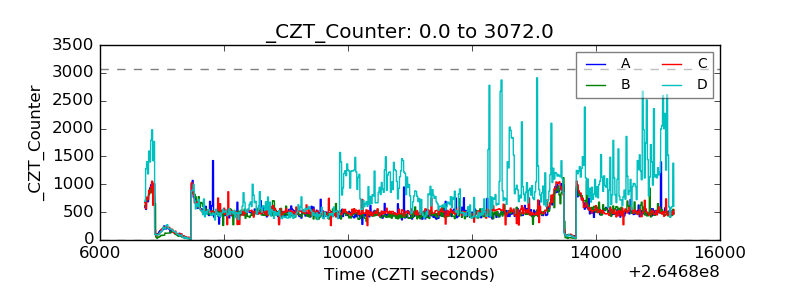 |
| +2.5 Volts monitor |  |
| +5 Volts monitor |  |
| _ROLL_ROT | 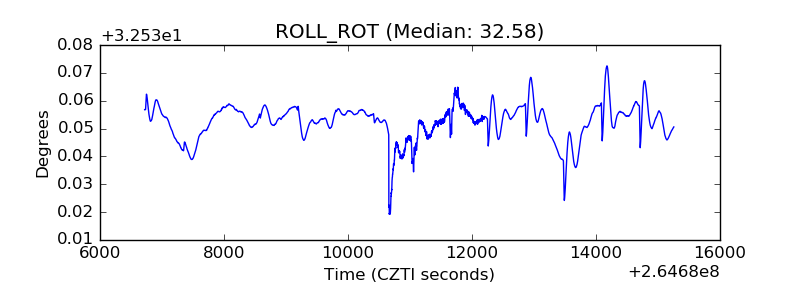 |
| _Roll_DEC | 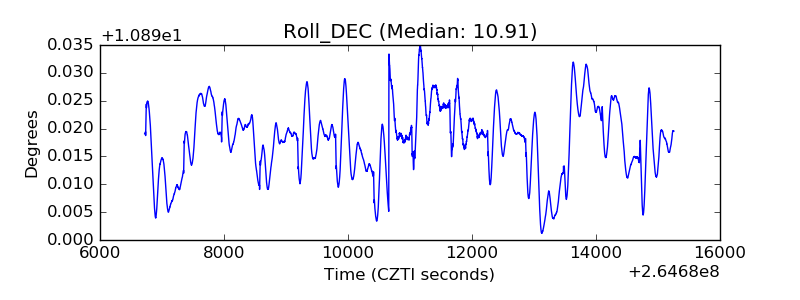 |
| _Roll_RA | 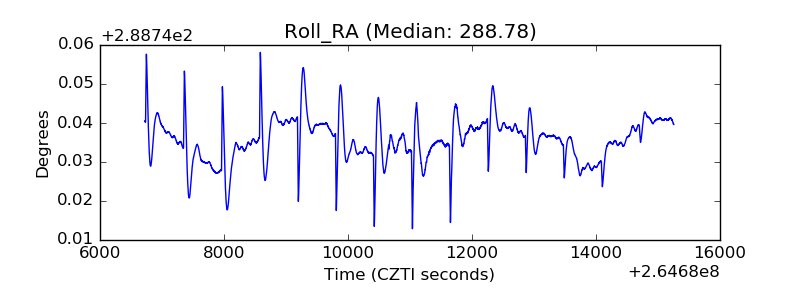 |
| Veto Counter | 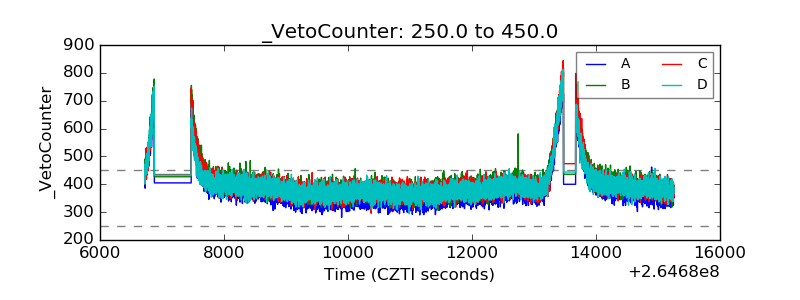 |