| Param | Original file | Final file |
|---|---|---|
| Filename | modeM0/AS1G08_078T01_9000002110_14323cztM0_level2.evt | modeM0/AS1G08_078T01_9000002110_14323cztM0_level2_quad_clean.evt |
| Size (bytes) | 1,285,536,960 | 242,233,920 |
| Size | 1.2 GB | 231.0 MB |
| Events in quadrant A | 8,666,384 | 1,542,947 |
| Events in quadrant B | 9,380,835 | 1,535,712 |
| Events in quadrant C | 9,427,791 | 1,517,797 |
| Events in quadrant D | 10,222,002 | 1,480,661 |
| Mode SS | |||
|---|---|---|---|
| Quadrant | BADHDUFLAG | Total packets | Discarded packets |
| A | 0 | 372 | 0 |
| B | 0 | 372 | 0 |
| C | 0 | 372 | 0 |
| D | 0 | 372 | 0 |
| Mode M0 | |||
|---|---|---|---|
| Quadrant | BADHDUFLAG | Total packets | Discarded packets |
| A | 0 | 37610 | 4 |
| B | 0 | 39827 | 3 |
| C | 0 | 38423 | 3 |
| D | 0 | 42469 | 3 |
| Mode M9 | |||
|---|---|---|---|
| Quadrant | BADHDUFLAG | Total packets | Discarded packets |
| A | 0 | 19 | 0 |
| B | 0 | 19 | 0 |
| C | 0 | 19 | 0 |
| D | 0 | 19 | 0 |
| Quadrant | Total seconds | Saturated seconds | Saturation percentage |
|---|---|---|---|
| A | 18282 | 84 | 0.459468% |
| B | 18282 | 202 | 1.104912% |
| C | 18282 | 99 | 0.541516% |
| D | 18282 | 249 | 1.361995% |
Noise dominated data is calculated using 1-second bins in cleaned event files. If a bin has >2000 counts, and if more than 50% of those come from <1% of pixels, then it is considered to be noise-dominated and hence unusable.
| Quadrant | # 1 sec bins | Bins with >0 counts | Bins with >2000 counts | High rate bins dominated by noise | Noise dominated (total time) | Noise dominated (detector-on time) | Marked lightcurve |
|---|---|---|---|---|---|---|---|
| A | 20198 | 18286 | 1 | 1 | 0.00% | 0.01% | 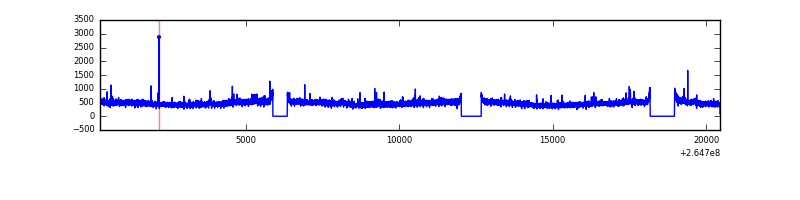 |
| B | 20198 | 18286 | 31 | 31 | 0.15% | 0.17% | 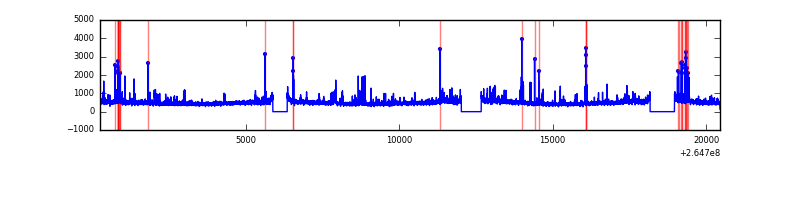 |
| C | 20198 | 18286 | 5 | 5 | 0.02% | 0.03% | 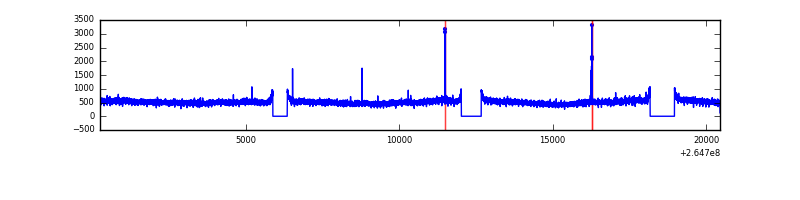 |
| D | 20198 | 18286 | 132 | 132 | 0.65% | 0.72% | 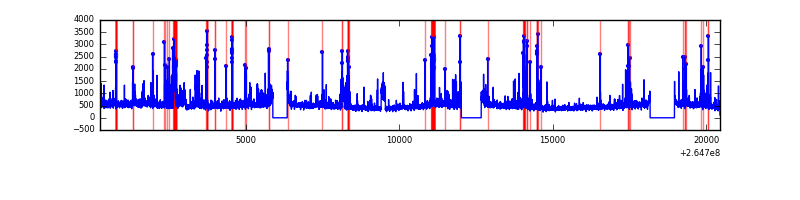 |
Top three noisy pixels from each quadrant. If the there are fewer than three noisy pixels in the level2.evt file, extra rows are filled as -1
| Pixel properties | Quadrant properties | ||||||
|---|---|---|---|---|---|---|---|
| Quadrant | DetID | PixID | Counts | Sigma | Mean | Median | Sigma |
| A | 12 | 189 | 174150 | 392.52 | 2173 | 2127 | 438.3 |
| A | 8 | 15 | 103658 | 231.67 | 2173 | 2127 | 438.3 |
| A | 0 | 226 | 19058 | 38.63 | 2173 | 2127 | 438.3 |
| B | 0 | 219 | 228541 | 543.74 | 2167 | 2113 | 416.4 |
| B | 0 | 229 | 186431 | 442.62 | 2167 | 2113 | 416.4 |
| B | 10 | 245 | 94639 | 222.19 | 2167 | 2113 | 416.4 |
| C | 3 | 233 | 1170861 | 2379.21 | 2109 | 2122 | 491.2 |
| C | 10 | 22 | 24222 | 44.99 | 2109 | 2122 | 491.2 |
| C | 13 | 61 | 14886 | 25.98 | 2109 | 2122 | 491.2 |
| D | 5 | 222 | 488951 | 977.71 | 2099 | 2051 | 498.0 |
| D | 12 | 110 | 456117 | 911.78 | 2099 | 2051 | 498.0 |
| D | 1 | 52 | 376210 | 751.32 | 2099 | 2051 | 498.0 |
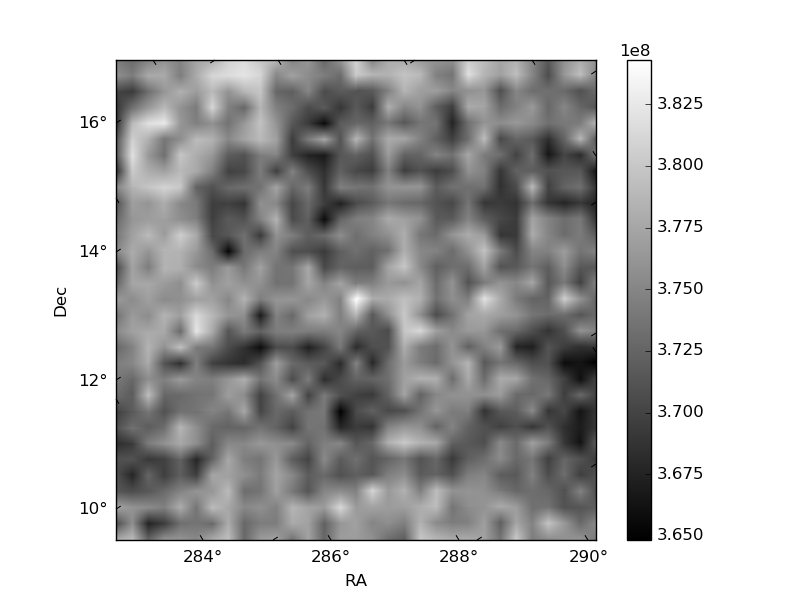
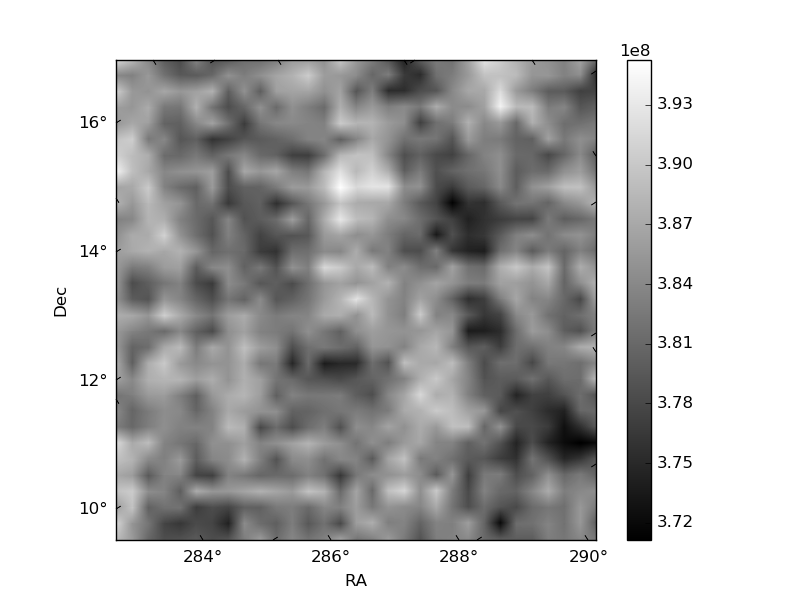
Histogram calculated using DETX and DETY for each event in the final _common_clean file
| Quadrant A |  |
 |
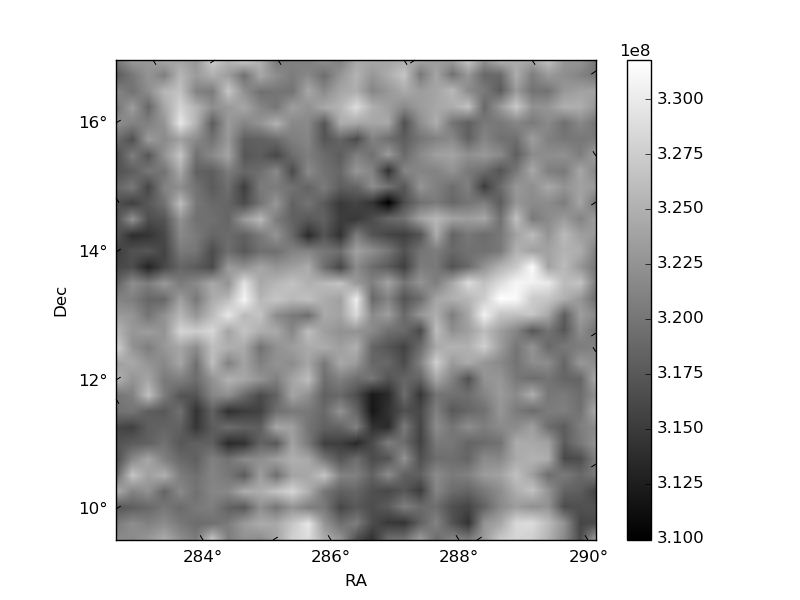
Quadrant B |
|---|---|---|---|
| Quadrant D |  |
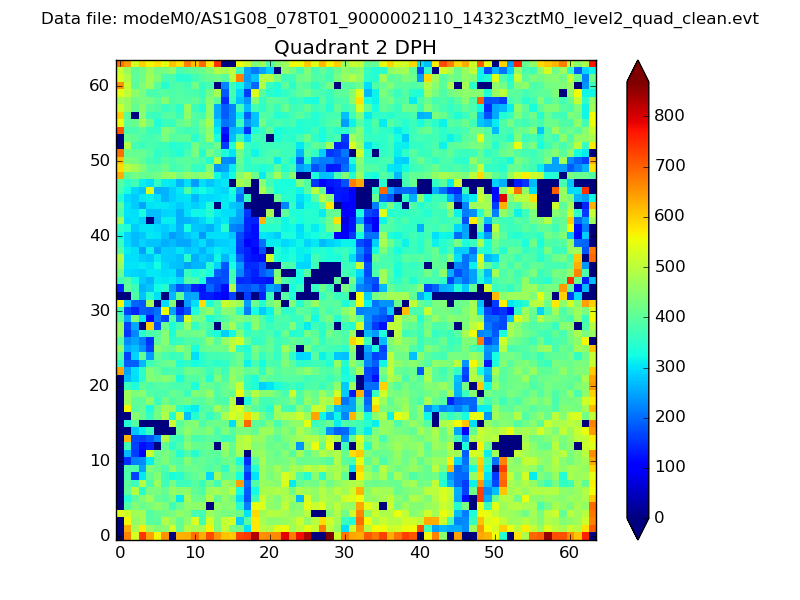 |
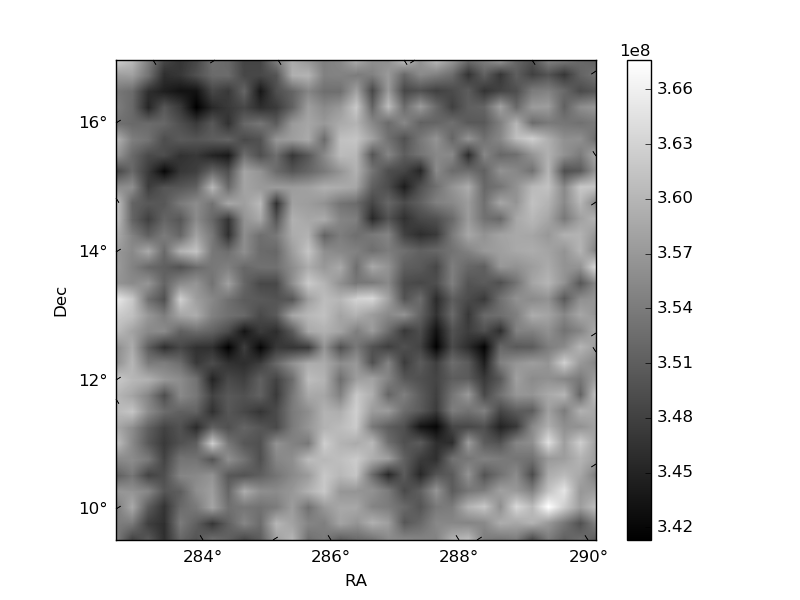
Quadrant C |
| Plot type | Count rate plots | Images |
|---|---|---|
| Comparison with Poisson distribution Blue bars denote a histogram of data divided into 1 sec bins. Red curve is a Poisson curve with rate = median count rate of data. |
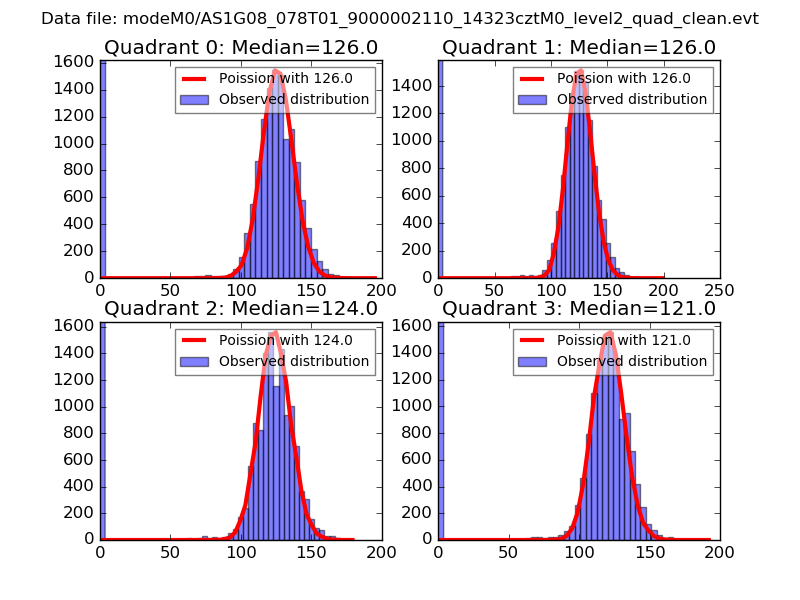 |
 |
| Quadrant-wise count rates Data is divided into 100 sec bins |
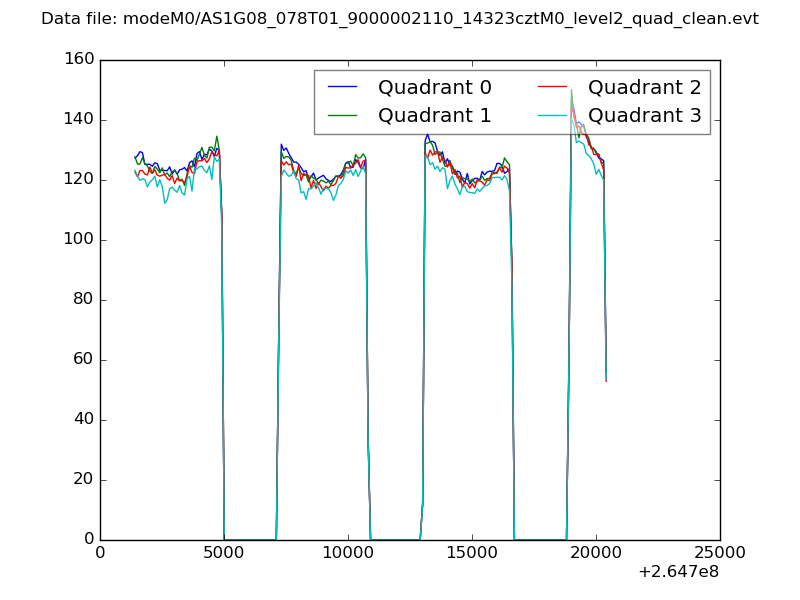 |
|
| Module-wise count rates for Quadrant A Data is divided into 100 sec bins |
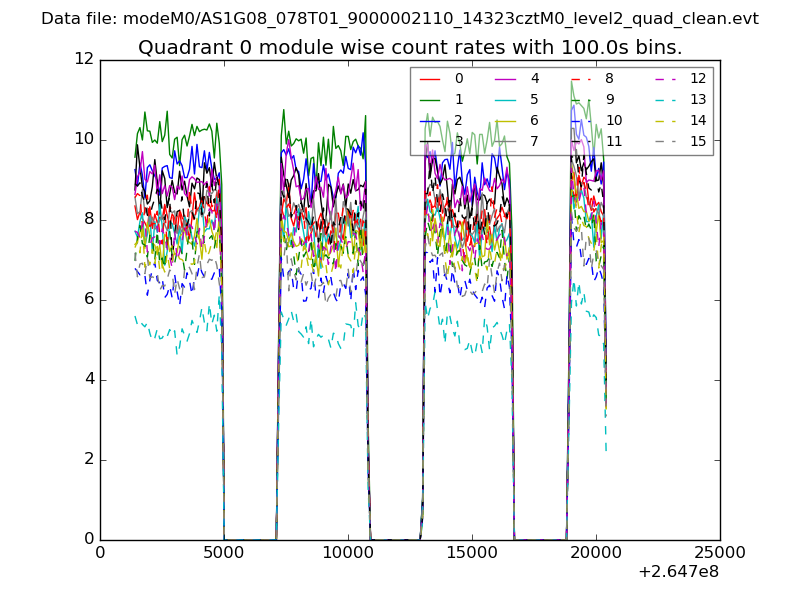 |
 |
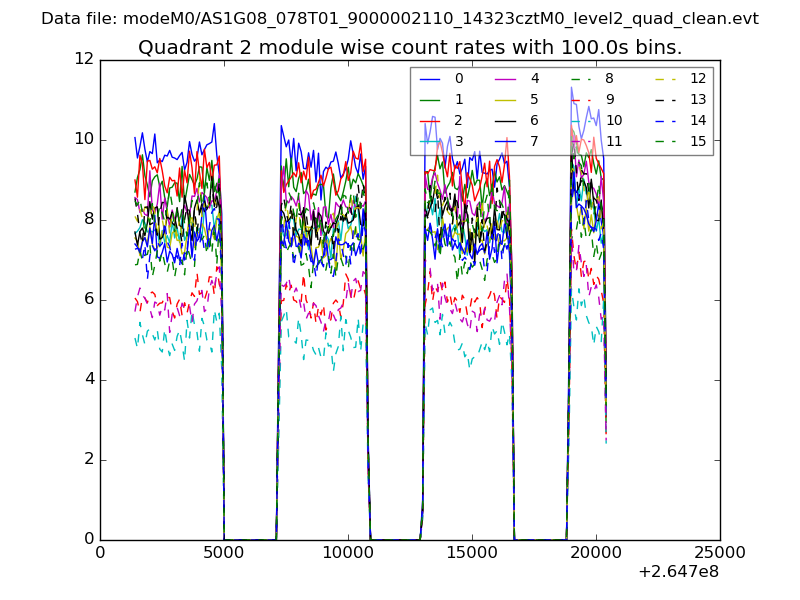
| Module-wise count rates for Quadrant B Data is divided into 100 sec bins |
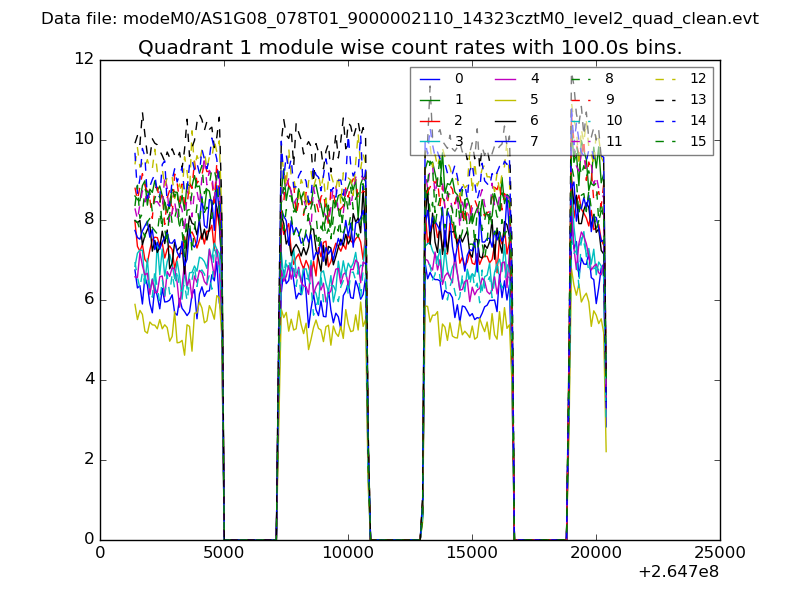 |
 |
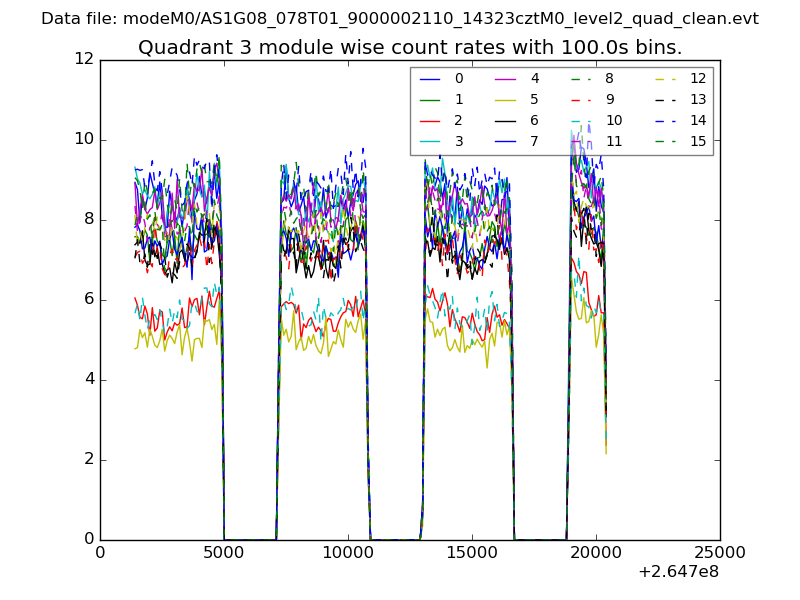
| Module-wise count rates for Quadrant C Data is divided into 100 sec bins |
 |
 |
| Module-wise count rates for Quadrant D Data is divided into 100 sec bins |
 |
 |
| Parameter | Plot |
|---|---|
| CZT HV Monitor | 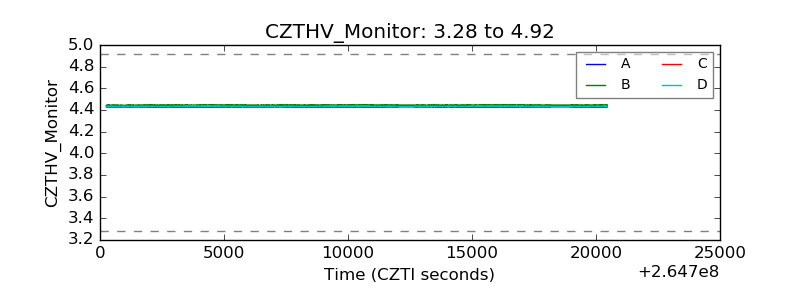 |
| D_VDD | 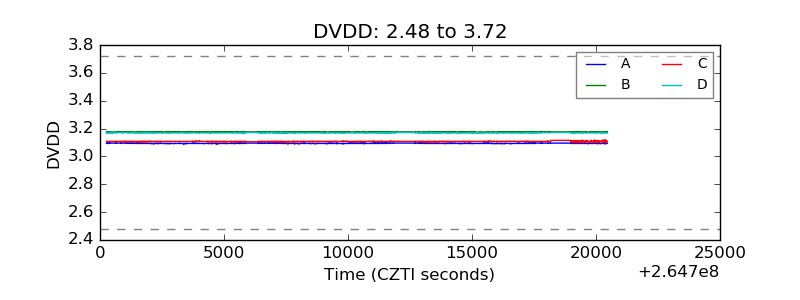 |
| Temperature 1 | 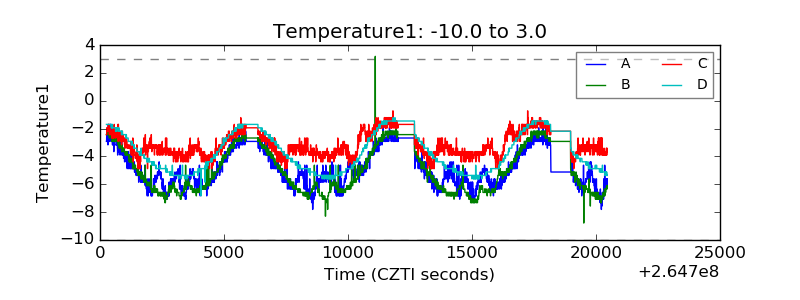 |
| Veto HV Monitor | 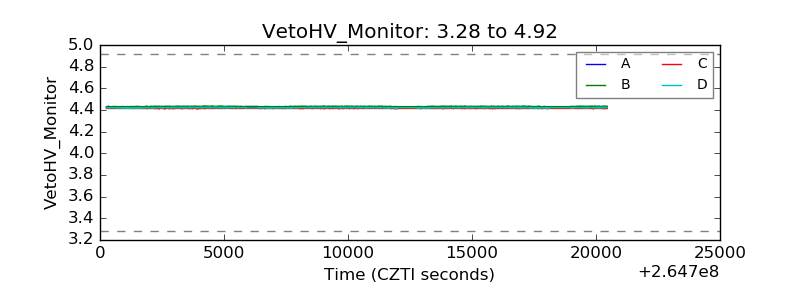 |
| Veto LLD | 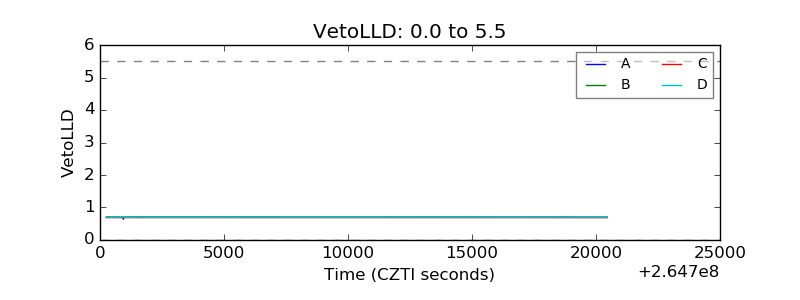 |
| Alpha Counter | 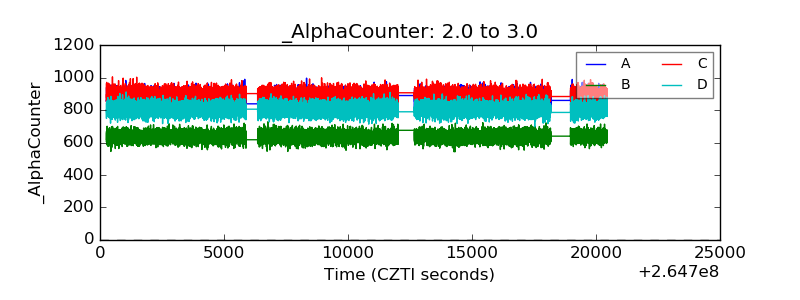 |
| _CPM_Rate | 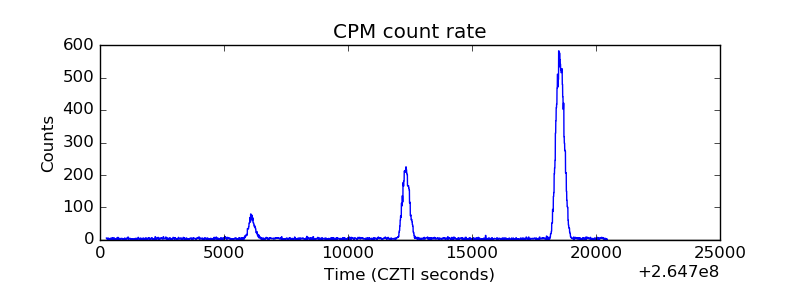 |
| CZT Counter |  |
| +2.5 Volts monitor |  |
| +5 Volts monitor |  |
| _ROLL_ROT | 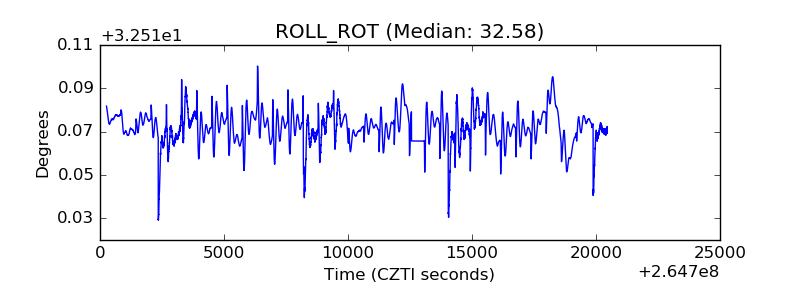 |
| _Roll_DEC | 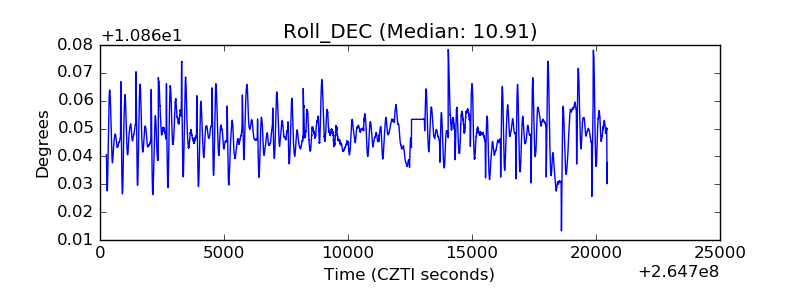 |
| _Roll_RA | 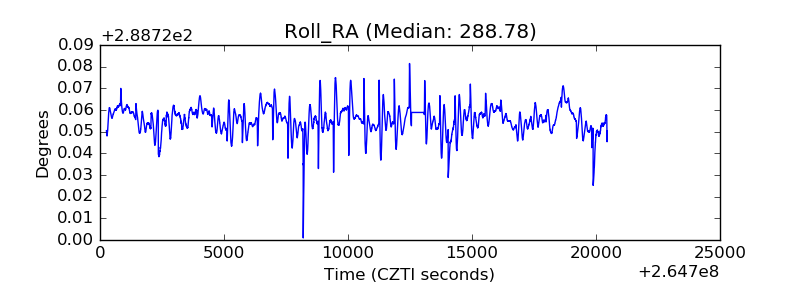 |
| Veto Counter | 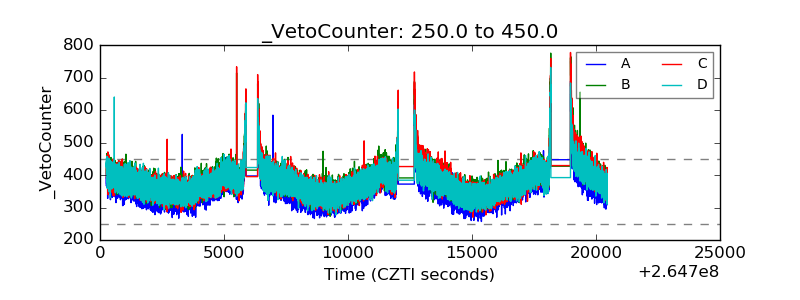 |