| Param | Original file | Final file |
|---|---|---|
| Filename | modeM0/AS1G08_078T01_9000002110_14324cztM0_level2.evt | modeM0/AS1G08_078T01_9000002110_14324cztM0_level2_quad_clean.evt |
| Size (bytes) | 486,051,840 | 97,470,720 |
| Size | 463.5 MB | 93.0 MB |
| Events in quadrant A | 3,308,785 | 625,692 |
| Events in quadrant B | 3,708,831 | 627,072 |
| Events in quadrant C | 3,658,984 | 620,674 |
| Events in quadrant D | 3,578,036 | 600,784 |
| Mode SS | |||
|---|---|---|---|
| Quadrant | BADHDUFLAG | Total packets | Discarded packets |
| A | 0 | 142 | 0 |
| B | 0 | 142 | 0 |
| C | 0 | 142 | 0 |
| D | 0 | 142 | 0 |
| Mode M0 | |||
|---|---|---|---|
| Quadrant | BADHDUFLAG | Total packets | Discarded packets |
| A | 0 | 14347 | 3 |
| B | 0 | 15227 | 2 |
| C | 0 | 14953 | 2 |
| D | 0 | 15215 | 2 |
| Mode M9 | |||
|---|---|---|---|
| Quadrant | BADHDUFLAG | Total packets | Discarded packets |
| A | 0 | 18 | 0 |
| B | 0 | 18 | 0 |
| C | 0 | 18 | 0 |
| D | 0 | 18 | 0 |
| Quadrant | Total seconds | Saturated seconds | Saturation percentage |
|---|---|---|---|
| A | 6852 | 46 | 0.671337% |
| B | 6852 | 102 | 1.488616% |
| C | 6852 | 55 | 0.802685% |
| D | 6852 | 82 | 1.196731% |
Noise dominated data is calculated using 1-second bins in cleaned event files. If a bin has >2000 counts, and if more than 50% of those come from <1% of pixels, then it is considered to be noise-dominated and hence unusable.
| Quadrant | # 1 sec bins | Bins with >0 counts | Bins with >2000 counts | High rate bins dominated by noise | Noise dominated (total time) | Noise dominated (detector-on time) | Marked lightcurve |
|---|---|---|---|---|---|---|---|
| A | 8638 | 6855 | 0 | 0 | 0.00% | 0.00% |  |
| B | 8638 | 6855 | 21 | 21 | 0.24% | 0.31% |  |
| C | 8638 | 6855 | 0 | 0 | 0.00% | 0.00% | 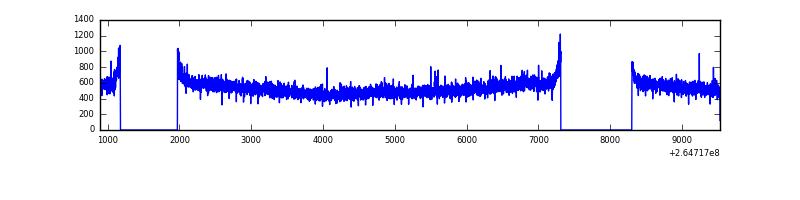 |
| D | 8638 | 6855 | 42 | 42 | 0.49% | 0.61% |  |
Top three noisy pixels from each quadrant. If the there are fewer than three noisy pixels in the level2.evt file, extra rows are filled as -1
| Pixel properties | Quadrant properties | ||||||
|---|---|---|---|---|---|---|---|
| Quadrant | DetID | PixID | Counts | Sigma | Mean | Median | Sigma |
| A | 12 | 189 | 96031 | 561.48 | 830 | 812 | 169.6 |
| A | 8 | 15 | 14688 | 81.82 | 830 | 812 | 169.6 |
| A | 0 | 226 | 7480 | 39.32 | 830 | 812 | 169.6 |
| B | 0 | 219 | 294861 | 1834.55 | 830 | 808 | 160.3 |
| B | 10 | 16 | 99291 | 614.42 | 830 | 808 | 160.3 |
| B | 0 | 189 | 29817 | 180.98 | 830 | 808 | 160.3 |
| C | 3 | 233 | 466373 | 2432.67 | 813 | 819 | 191.4 |
| C | 8 | 128 | 11960 | 58.22 | 813 | 819 | 191.4 |
| C | 8 | 112 | 6413 | 29.23 | 813 | 819 | 191.4 |
| D | 5 | 222 | 256712 | 1345.56 | 803 | 785 | 190.2 |
| D | 2 | 120 | 127773 | 667.65 | 803 | 785 | 190.2 |
| D | 13 | 122 | 45148 | 233.24 | 803 | 785 | 190.2 |
Histogram calculated using DETX and DETY for each event in the final _common_clean file
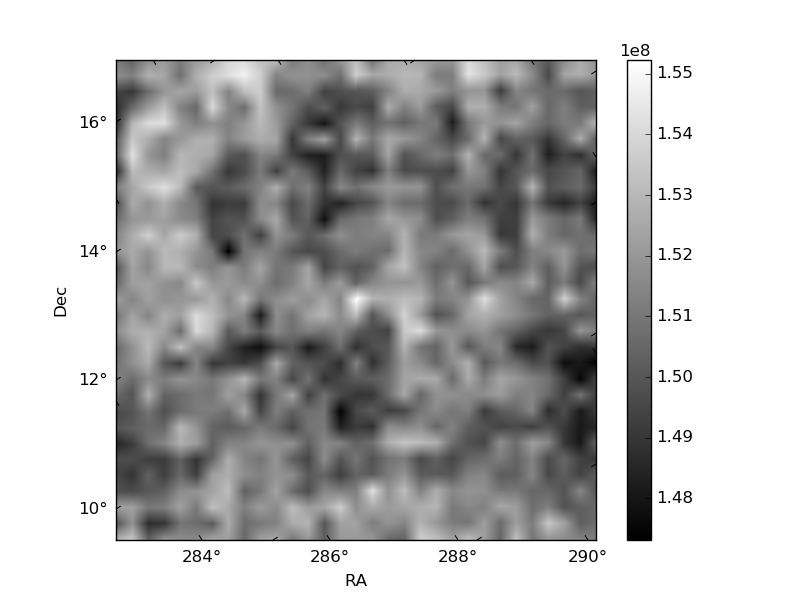
| Quadrant A | 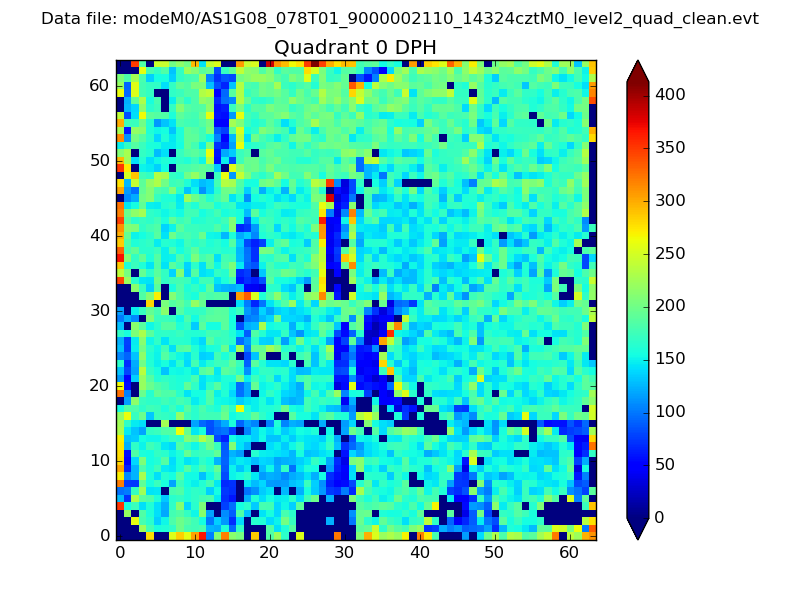 |
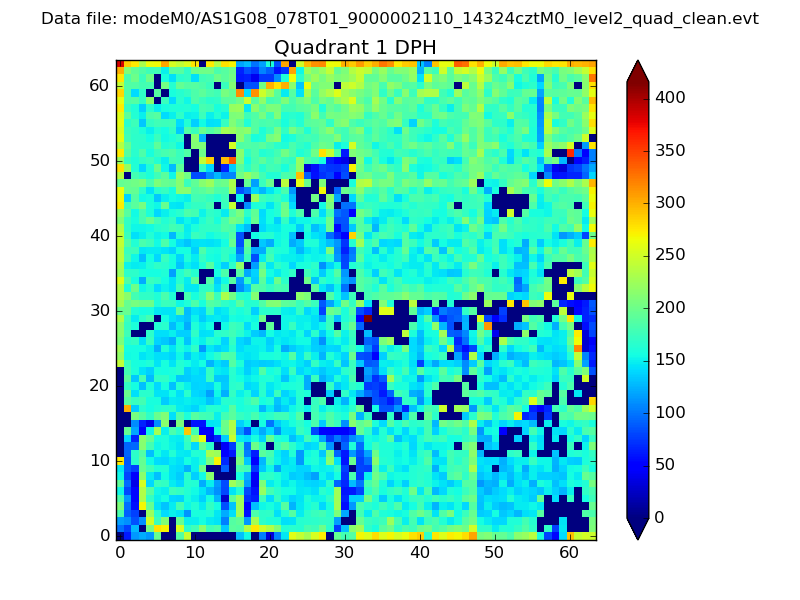 |
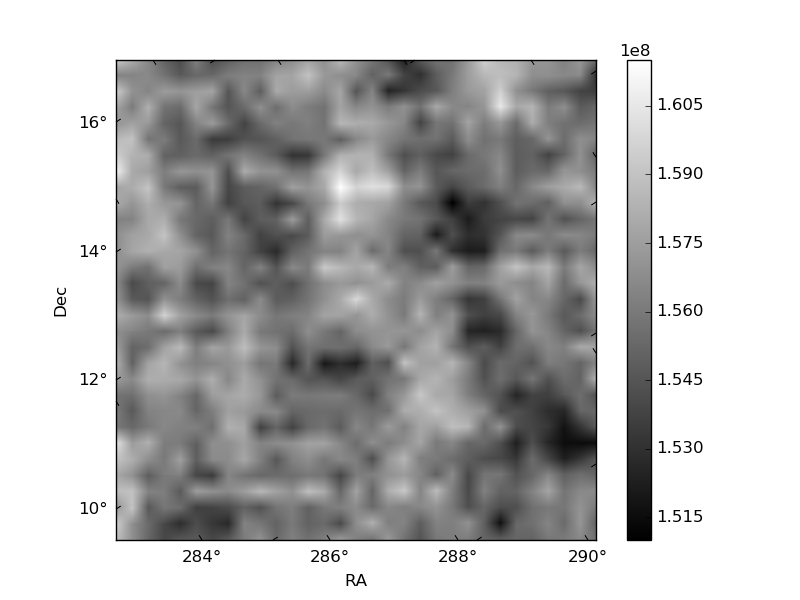
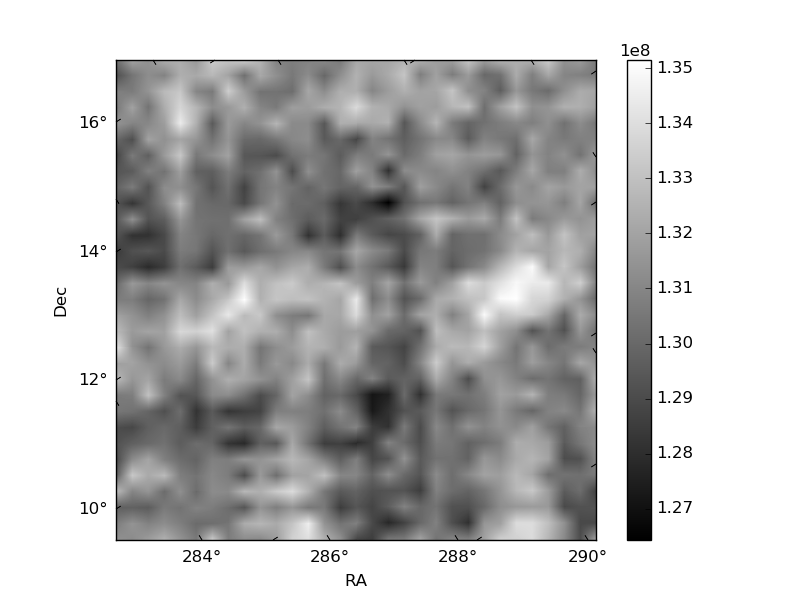
Quadrant B |
|---|---|---|---|
| Quadrant D | 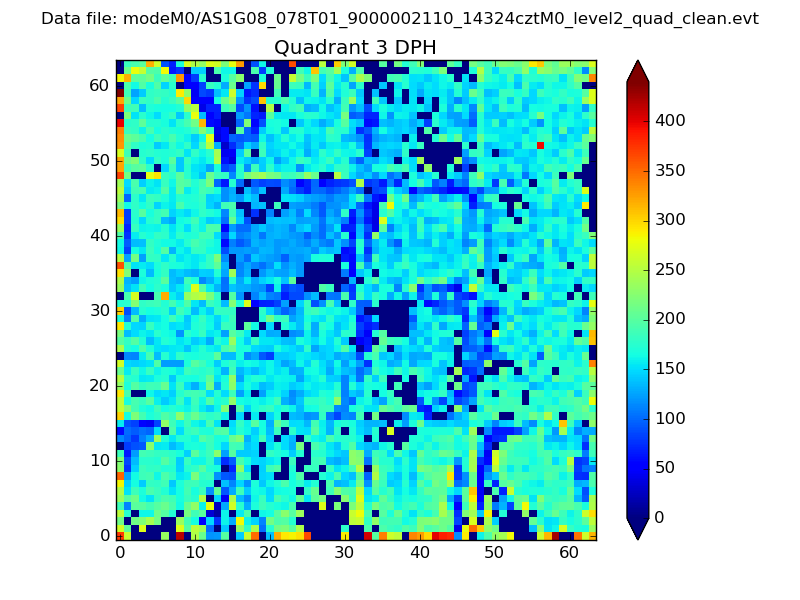 |
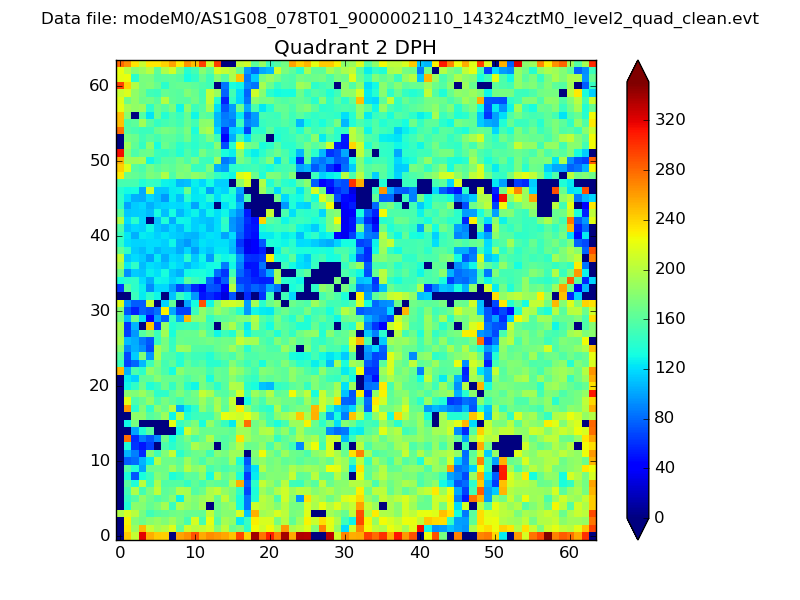 |
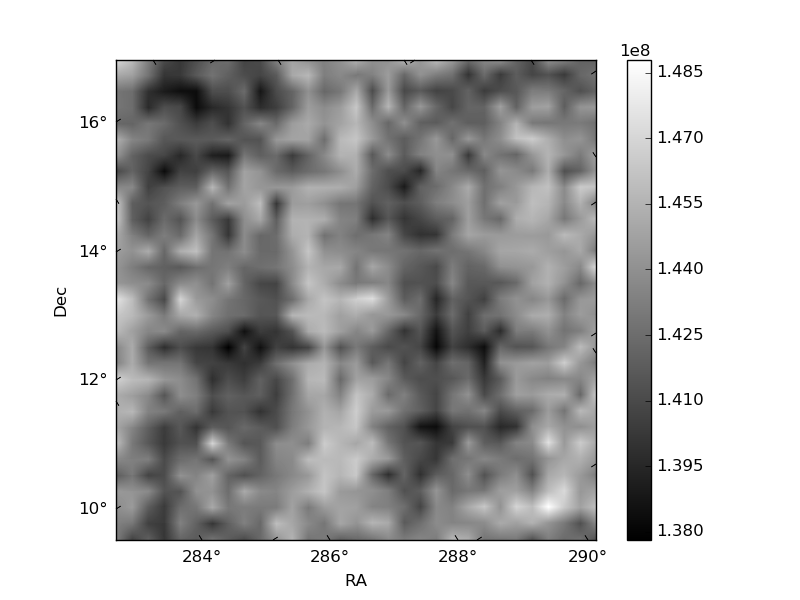
Quadrant C |
| Plot type | Count rate plots | Images |
|---|---|---|
| Comparison with Poisson distribution Blue bars denote a histogram of data divided into 1 sec bins. Red curve is a Poisson curve with rate = median count rate of data. |
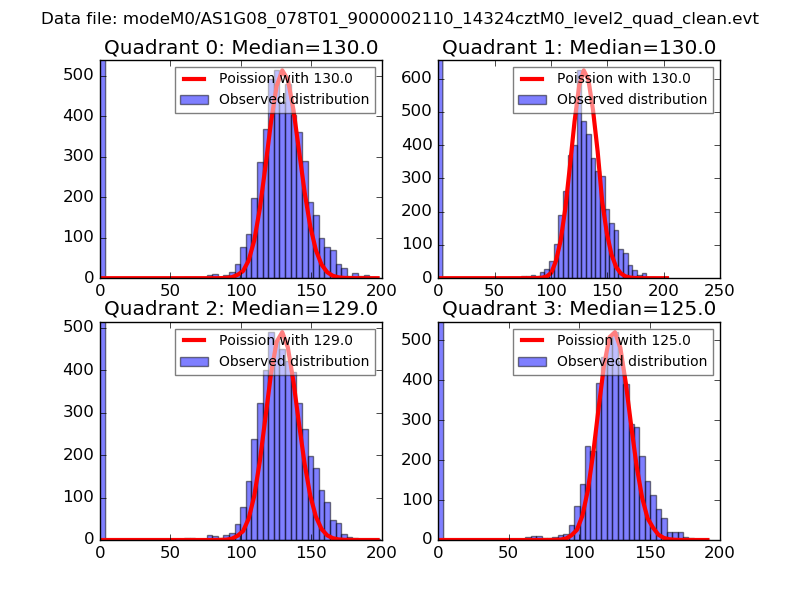 |
 |
| Quadrant-wise count rates Data is divided into 100 sec bins |
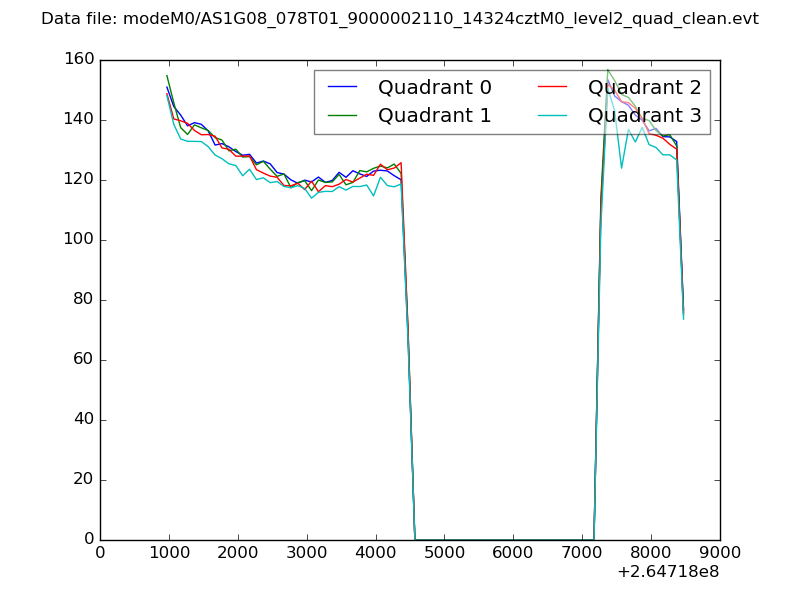 |
|
| Module-wise count rates for Quadrant A Data is divided into 100 sec bins |
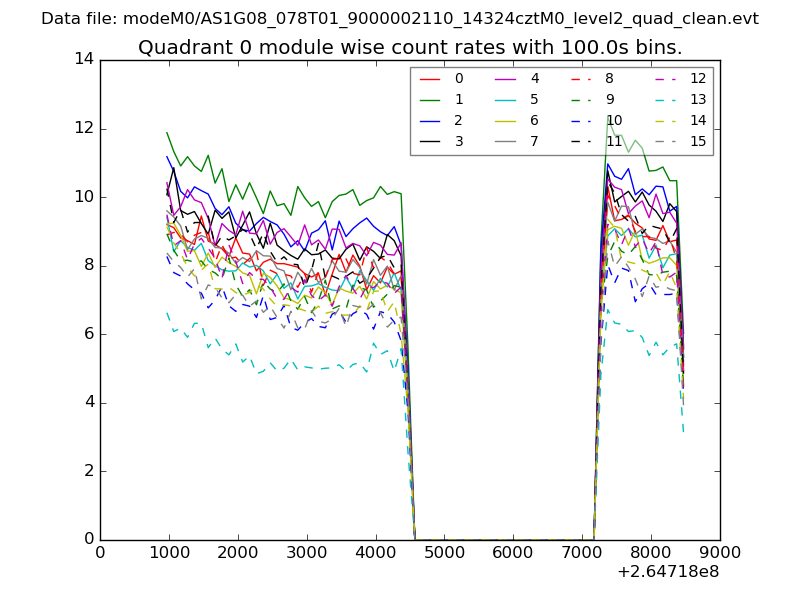 |
 |
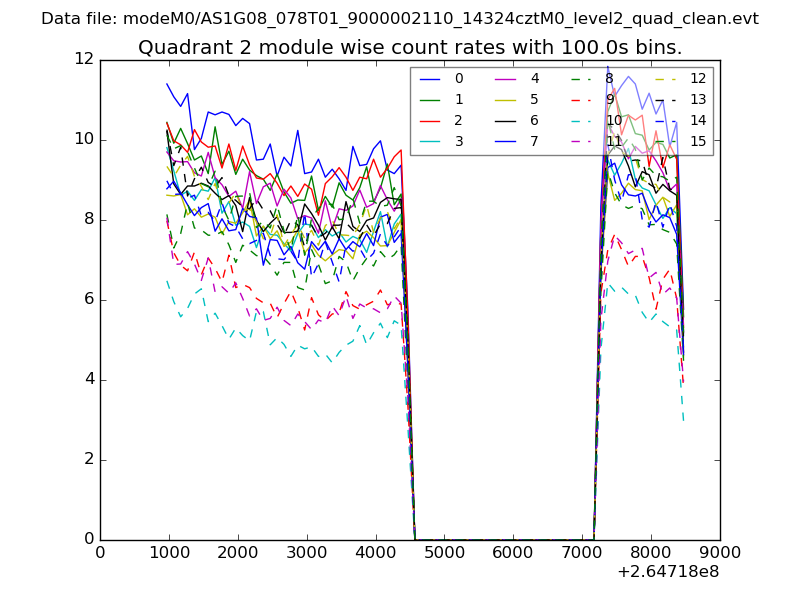
| Module-wise count rates for Quadrant B Data is divided into 100 sec bins |
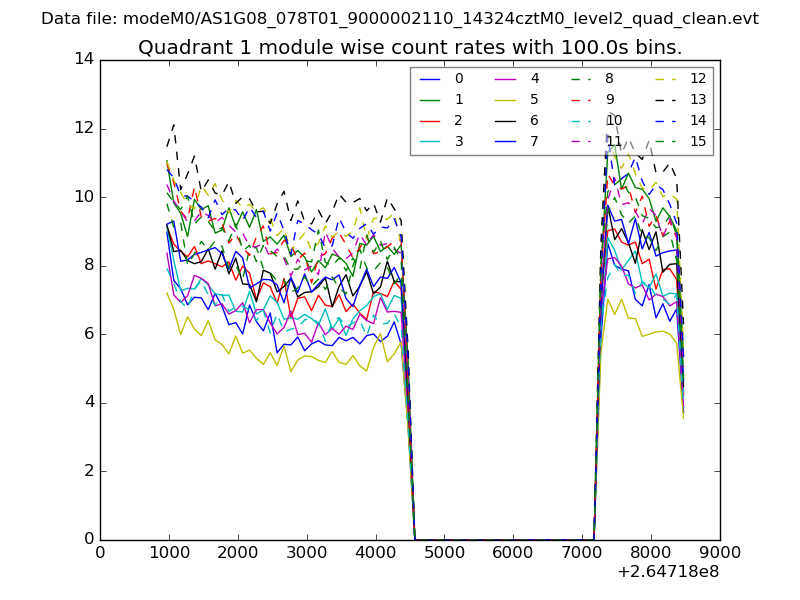 |
 |
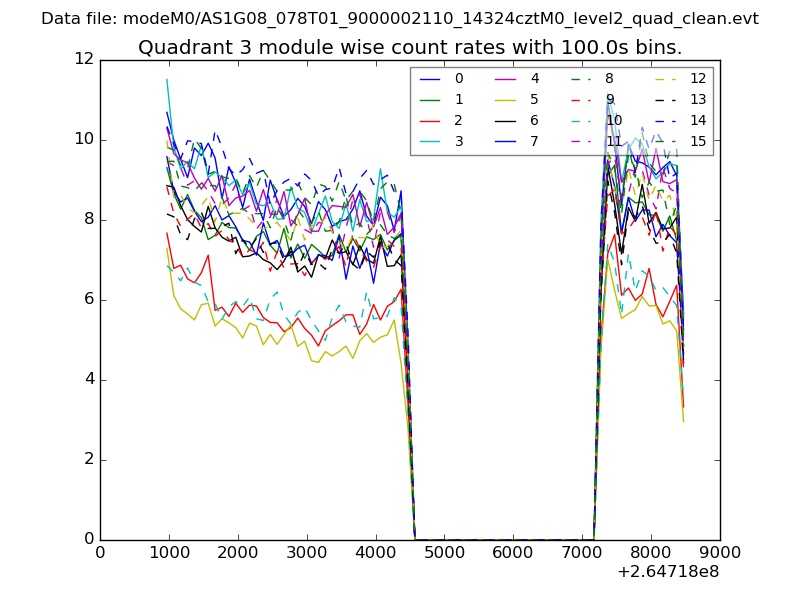
| Module-wise count rates for Quadrant C Data is divided into 100 sec bins |
 |
 |
| Module-wise count rates for Quadrant D Data is divided into 100 sec bins |
 |
 |
| Parameter | Plot |
|---|---|
| CZT HV Monitor | 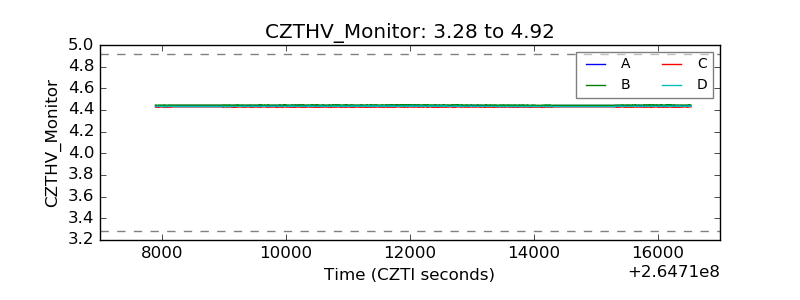 |
| D_VDD | 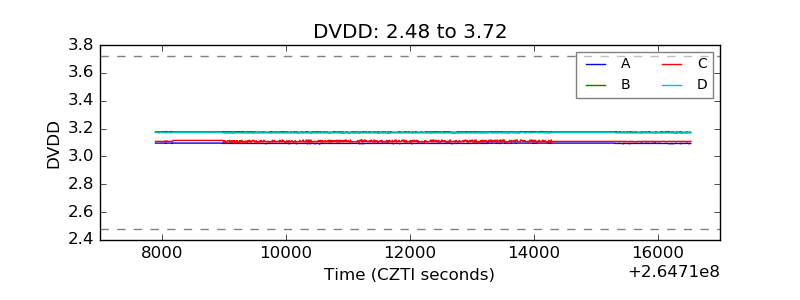 |
| Temperature 1 | 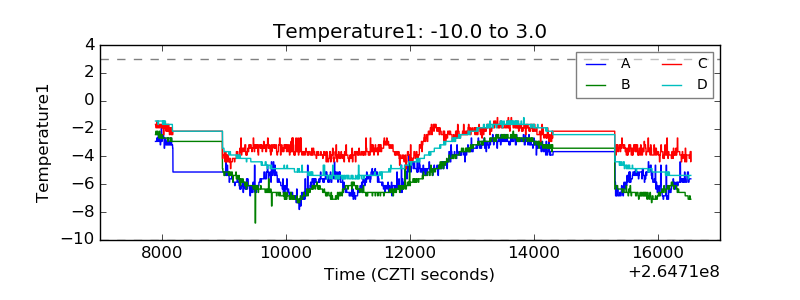 |
| Veto HV Monitor | 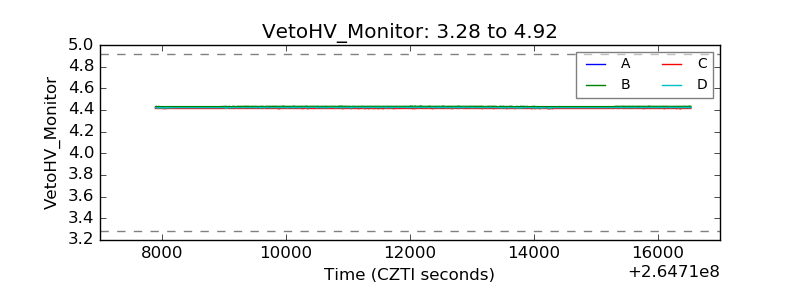 |
| Veto LLD | 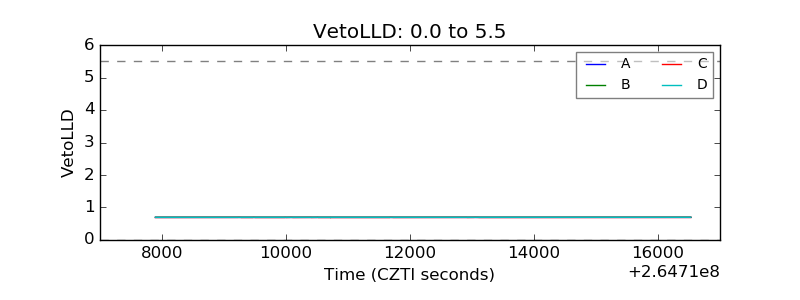 |
| Alpha Counter | 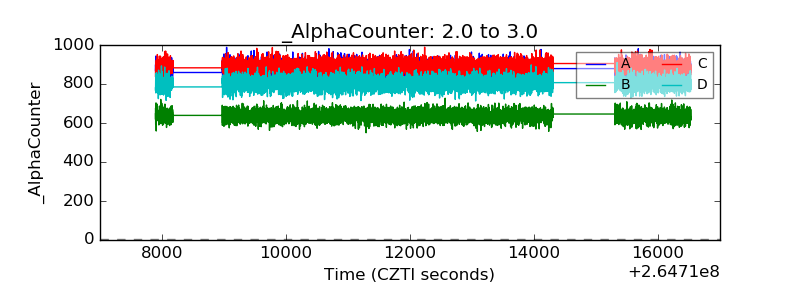 |
| _CPM_Rate | 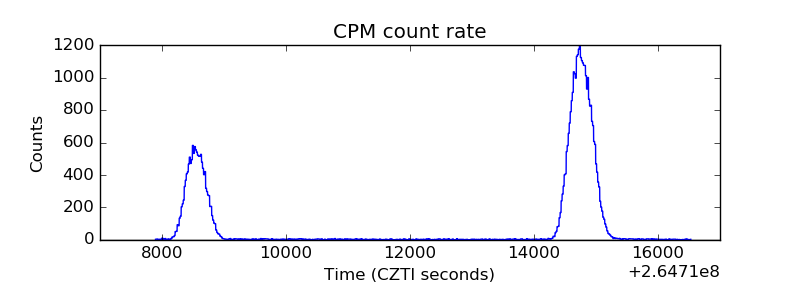 |
| CZT Counter | 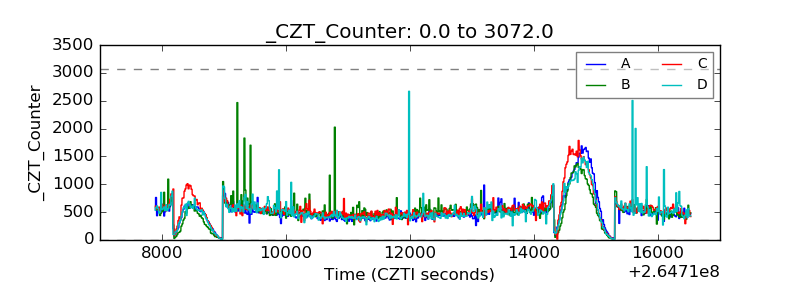 |
| +2.5 Volts monitor |  |
| +5 Volts monitor | 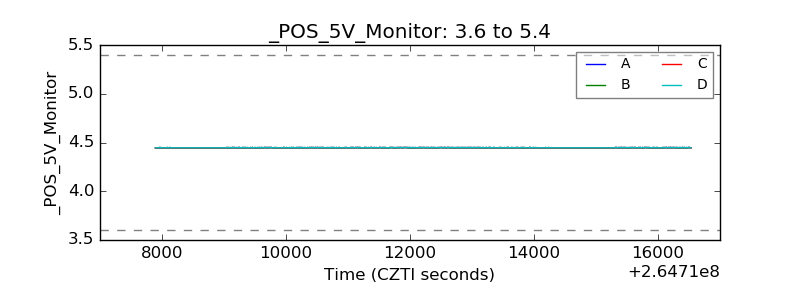 |
| _ROLL_ROT | 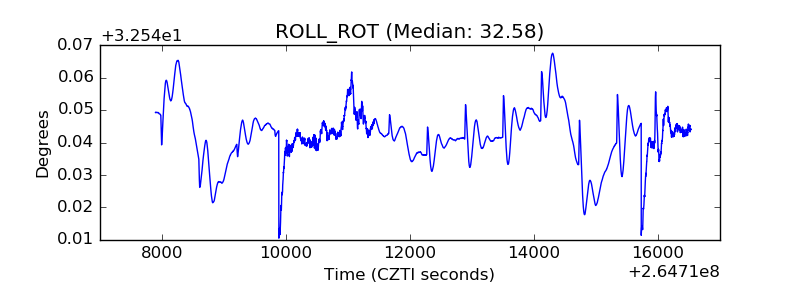 |
| _Roll_DEC | 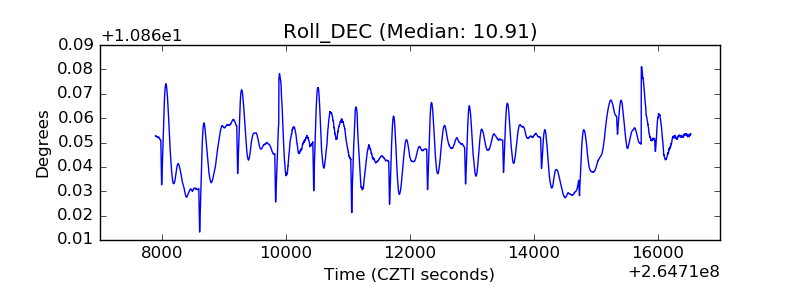 |
| _Roll_RA | 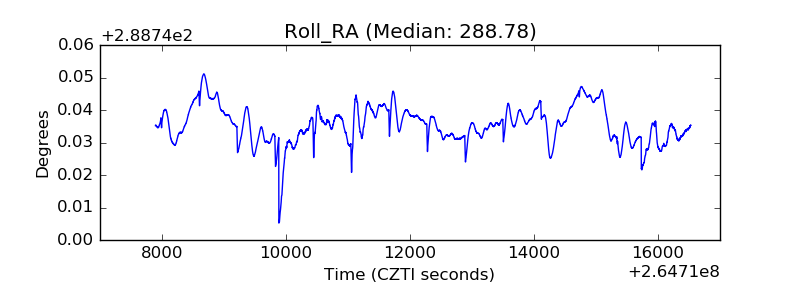 |
| Veto Counter | 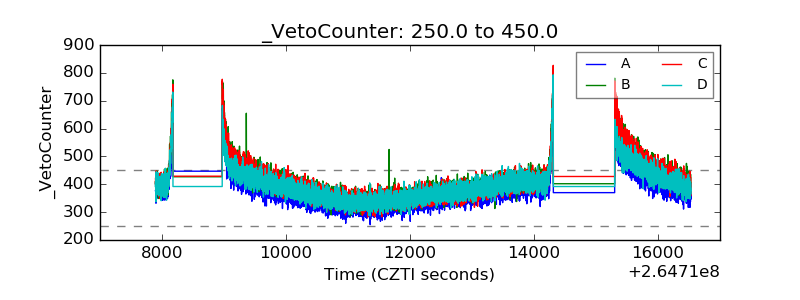 |