| Param | Original file | Final file |
|---|---|---|
| Filename | modeM0/AS1G08_078T01_9000002110_14325cztM0_level2.evt | modeM0/AS1G08_078T01_9000002110_14325cztM0_level2_quad_clean.evt |
| Size (bytes) | 490,711,680 | 93,625,920 |
| Size | 468.0 MB | 89.3 MB |
| Events in quadrant A | 3,197,889 | 601,320 |
| Events in quadrant B | 3,901,315 | 608,665 |
| Events in quadrant C | 3,415,896 | 597,426 |
| Events in quadrant D | 3,906,635 | 576,269 |
| Mode SS | |||
|---|---|---|---|
| Quadrant | BADHDUFLAG | Total packets | Discarded packets |
| A | 0 | 130 | 0 |
| B | 0 | 130 | 0 |
| C | 0 | 130 | 0 |
| D | 0 | 130 | 0 |
| Mode M0 | |||
|---|---|---|---|
| Quadrant | BADHDUFLAG | Total packets | Discarded packets |
| A | 0 | 13524 | 3 |
| B | 0 | 15928 | 2 |
| C | 0 | 13972 | 2 |
| D | 0 | 16122 | 2 |
| Mode M9 | |||
|---|---|---|---|
| Quadrant | BADHDUFLAG | Total packets | Discarded packets |
| A | 0 | 20 | 0 |
| B | 0 | 20 | 0 |
| C | 0 | 20 | 0 |
| D | 0 | 20 | 0 |
| Quadrant | Total seconds | Saturated seconds | Saturation percentage |
|---|---|---|---|
| A | 6479 | 22 | 0.339559% |
| B | 6479 | 183 | 2.824510% |
| C | 6479 | 17 | 0.262386% |
| D | 6479 | 146 | 2.253434% |
Noise dominated data is calculated using 1-second bins in cleaned event files. If a bin has >2000 counts, and if more than 50% of those come from <1% of pixels, then it is considered to be noise-dominated and hence unusable.
| Quadrant | # 1 sec bins | Bins with >0 counts | Bins with >2000 counts | High rate bins dominated by noise | Noise dominated (total time) | Noise dominated (detector-on time) | Marked lightcurve |
|---|---|---|---|---|---|---|---|
| A | 7580 | 6481 | 0 | 0 | 0.00% | 0.00% | 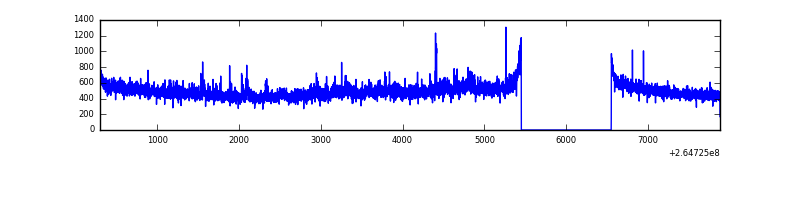 |
| B | 7580 | 6481 | 93 | 93 | 1.23% | 1.43% | 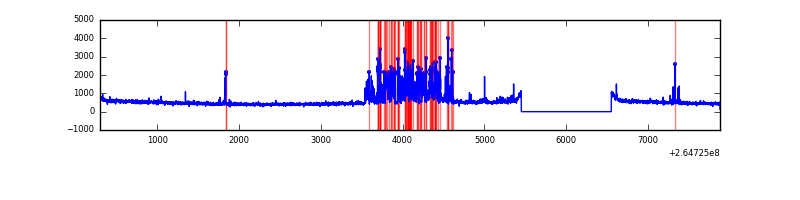 |
| C | 7580 | 6481 | 0 | 0 | 0.00% | 0.00% | 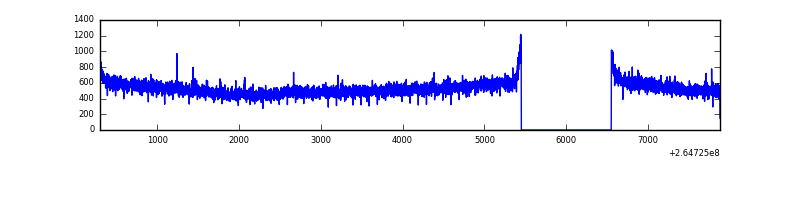 |
| D | 7580 | 6481 | 114 | 114 | 1.50% | 1.76% | 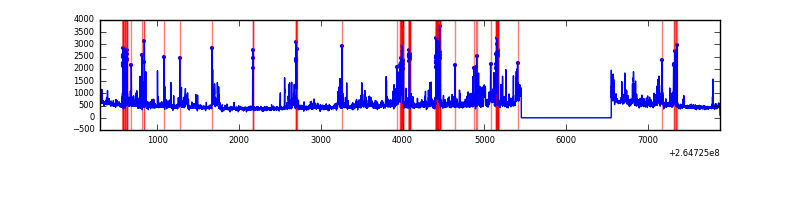 |
Top three noisy pixels from each quadrant. If the there are fewer than three noisy pixels in the level2.evt file, extra rows are filled as -1
| Pixel properties | Quadrant properties | ||||||
|---|---|---|---|---|---|---|---|
| Quadrant | DetID | PixID | Counts | Sigma | Mean | Median | Sigma |
| A | 12 | 189 | 105666 | 661.69 | 784 | 769 | 158.5 |
| A | 8 | 15 | 68237 | 425.59 | 784 | 769 | 158.5 |
| A | 1 | 162 | 6924 | 38.82 | 784 | 769 | 158.5 |
| B | 10 | 245 | 699647 | 4681.44 | 783 | 764 | 149.3 |
| B | 0 | 219 | 65948 | 436.63 | 783 | 764 | 149.3 |
| B | 4 | 48 | 36771 | 241.19 | 783 | 764 | 149.3 |
| C | 3 | 233 | 417751 | 2334.18 | 768 | 774 | 178.6 |
| C | 13 | 61 | 5500 | 26.46 | 768 | 774 | 178.6 |
| C | 10 | 22 | 2793 | 11.3 | 768 | 774 | 178.6 |
| D | 5 | 222 | 638848 | 3579.44 | 754 | 737 | 178.3 |
| D | 13 | 122 | 170535 | 952.47 | 754 | 737 | 178.3 |
| D | 2 | 120 | 108616 | 605.14 | 754 | 737 | 178.3 |
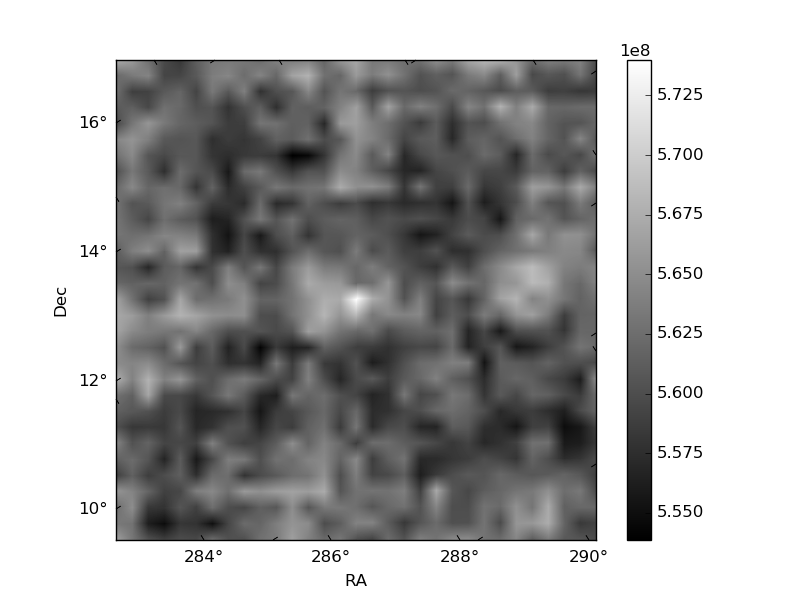
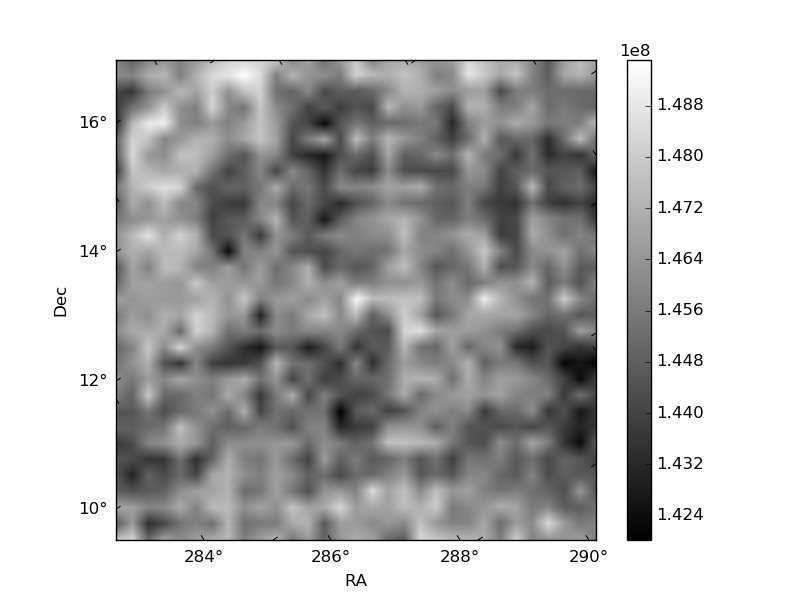
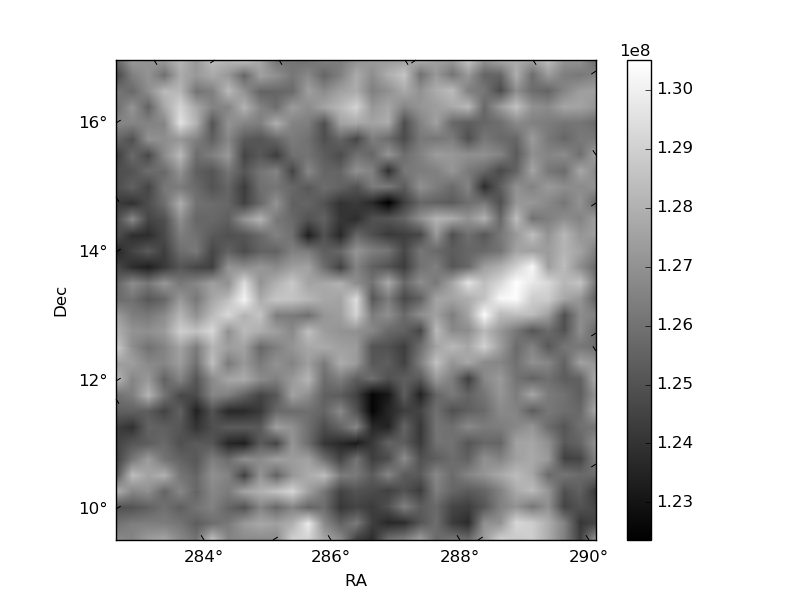
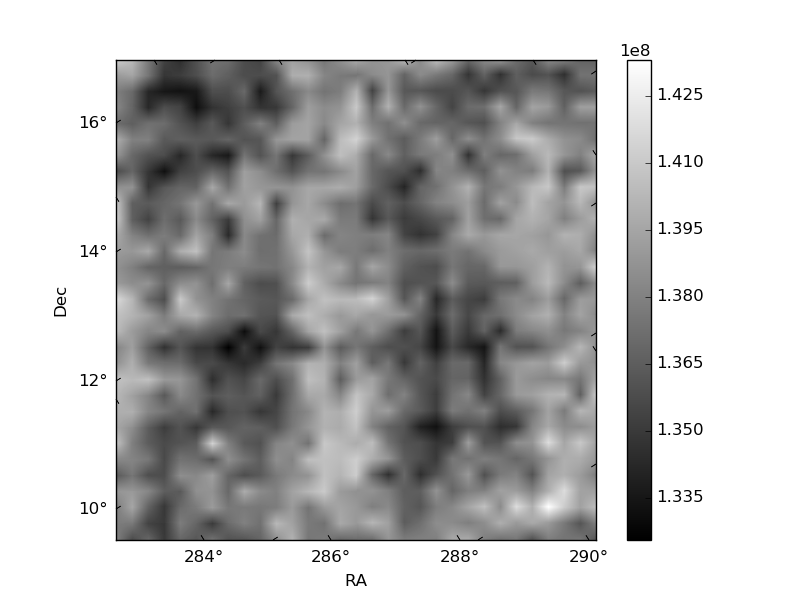
Histogram calculated using DETX and DETY for each event in the final _common_clean file
| Quadrant A | 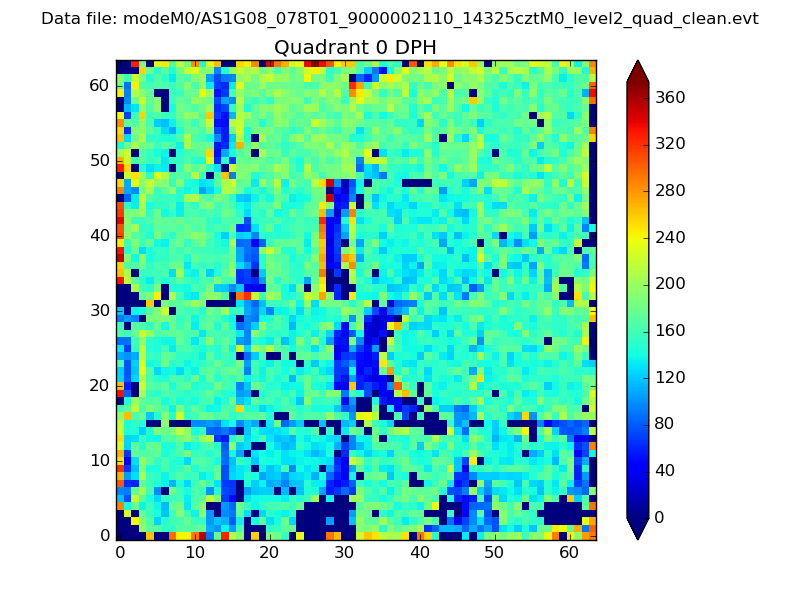 |
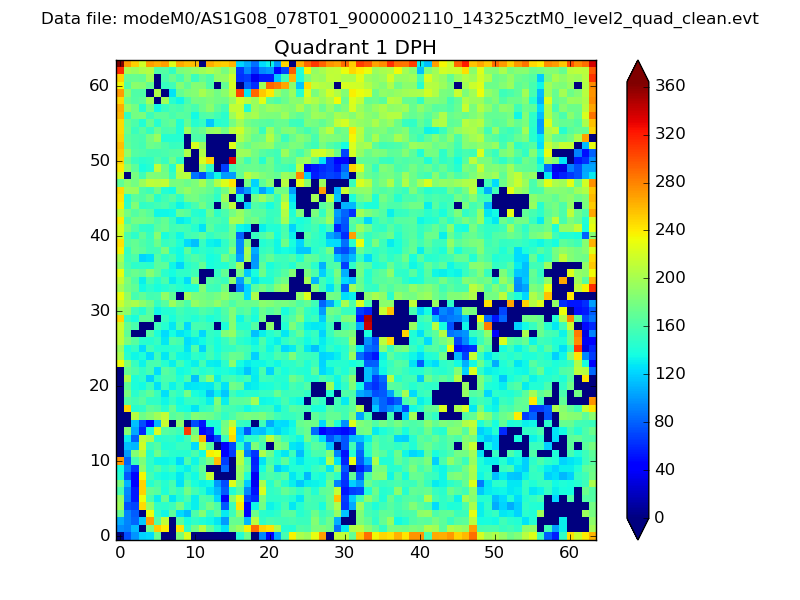 |
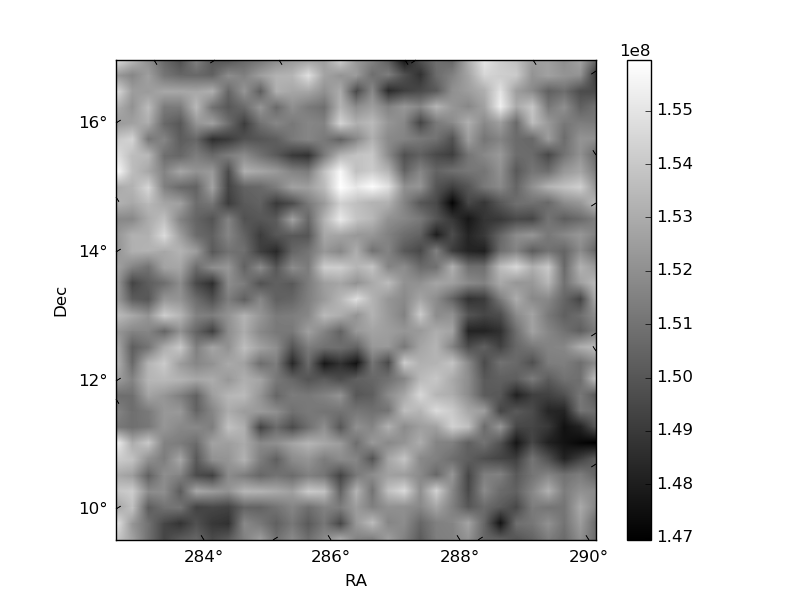
Quadrant B |
|---|---|---|---|
| Quadrant D | 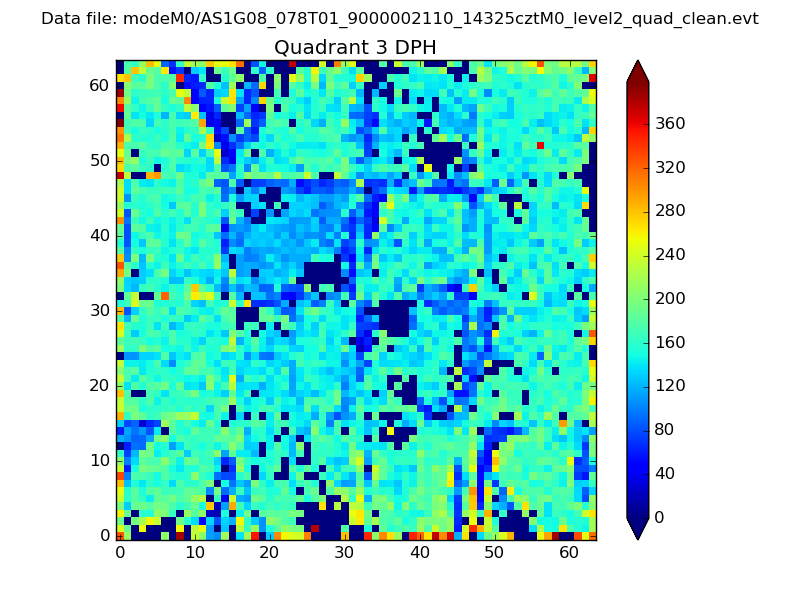 |
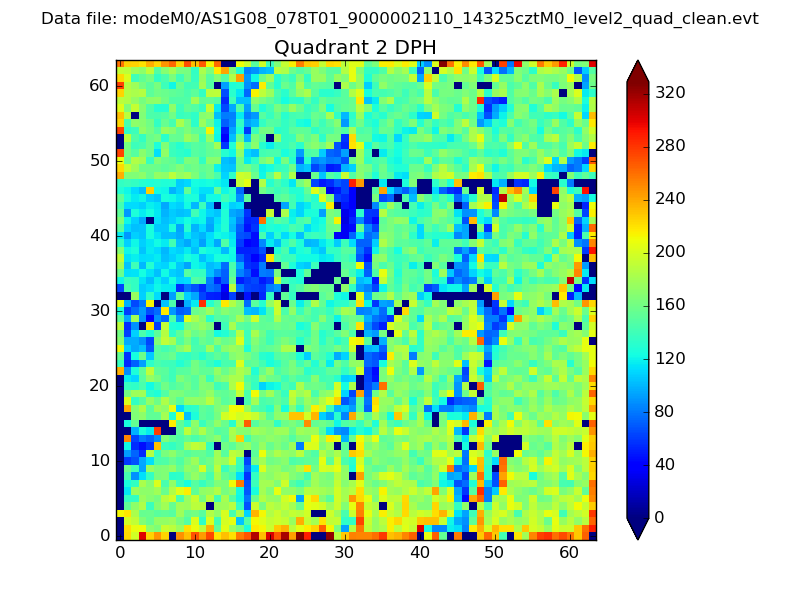 |
Quadrant C |
| Plot type | Count rate plots | Images |
|---|---|---|
| Comparison with Poisson distribution Blue bars denote a histogram of data divided into 1 sec bins. Red curve is a Poisson curve with rate = median count rate of data. |
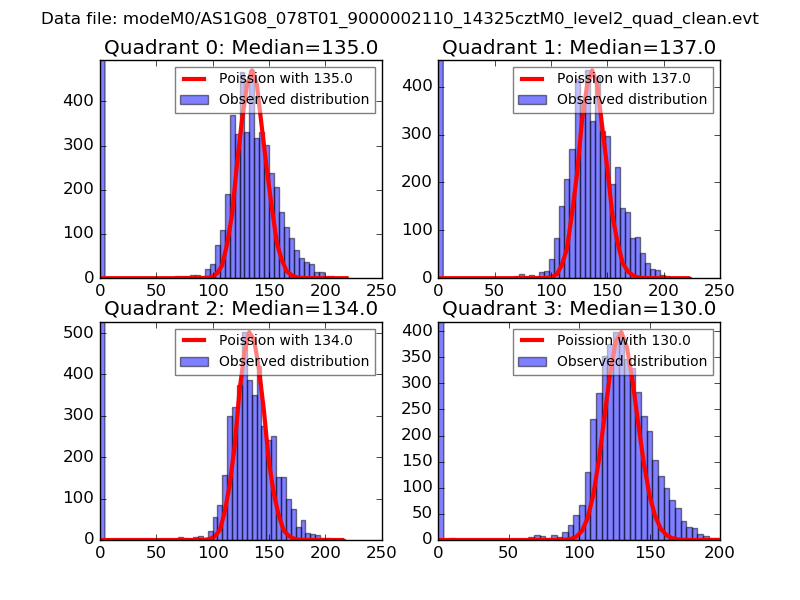 |
 |
| Quadrant-wise count rates Data is divided into 100 sec bins |
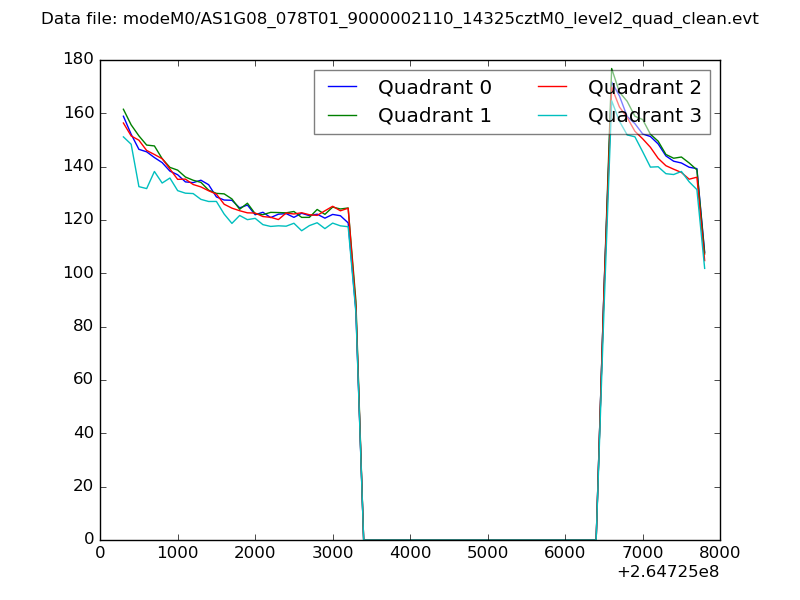 |
|
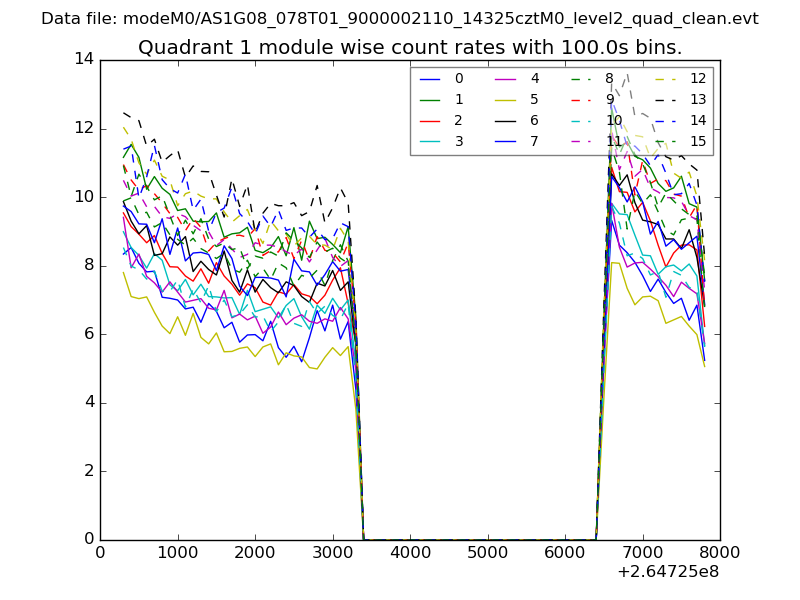
| Module-wise count rates for Quadrant A Data is divided into 100 sec bins |
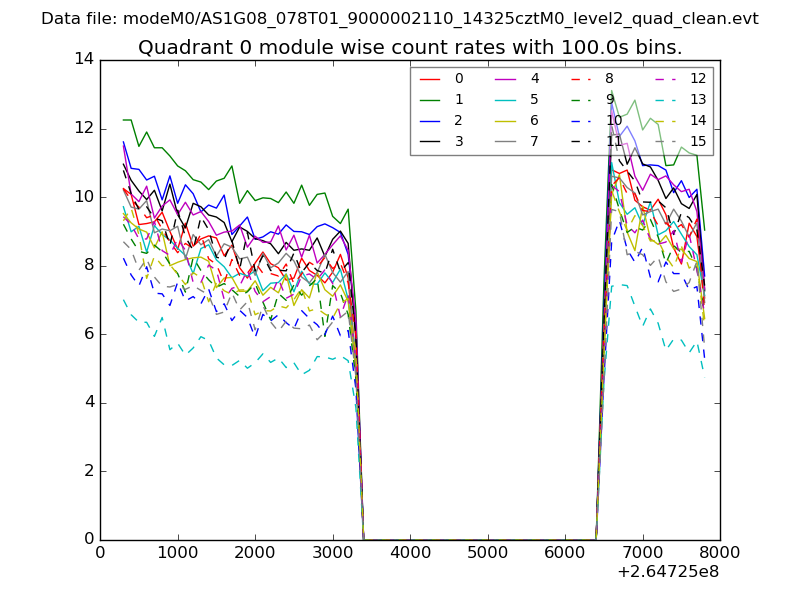 |
 |
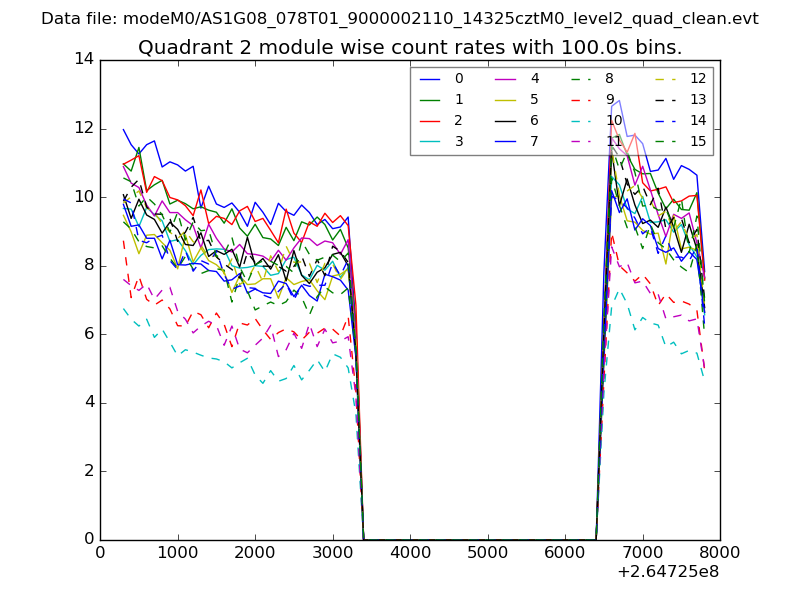
| Module-wise count rates for Quadrant B Data is divided into 100 sec bins |
 |
 |
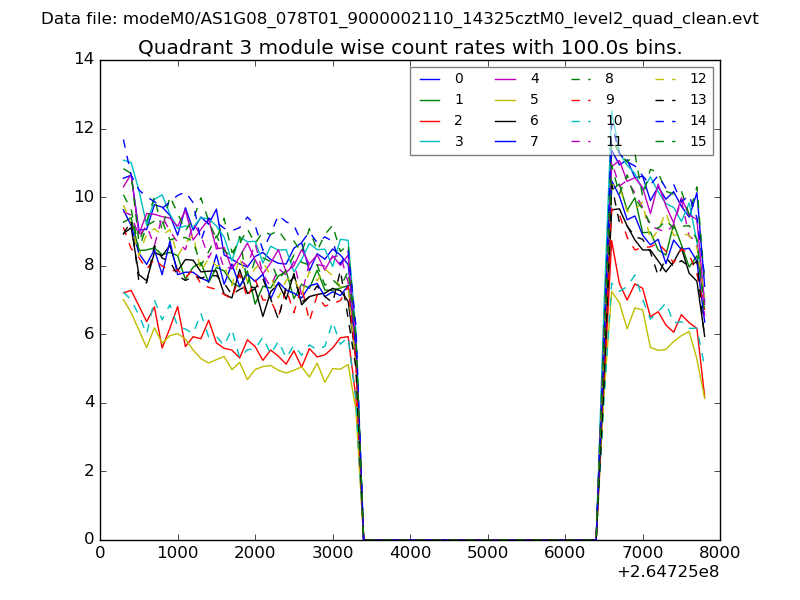
| Module-wise count rates for Quadrant C Data is divided into 100 sec bins |
 |
 |
| Module-wise count rates for Quadrant D Data is divided into 100 sec bins |
 |
 |
| Parameter | Plot |
|---|---|
| CZT HV Monitor | 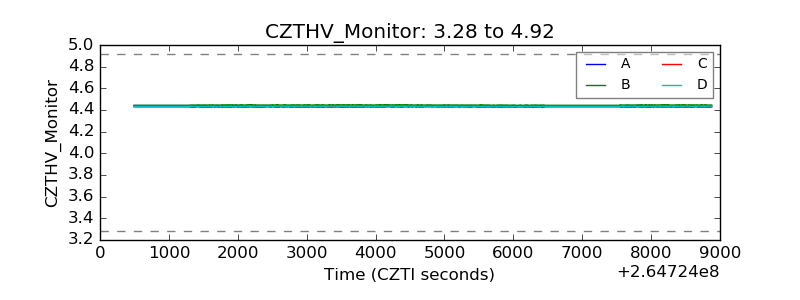 |
| D_VDD | 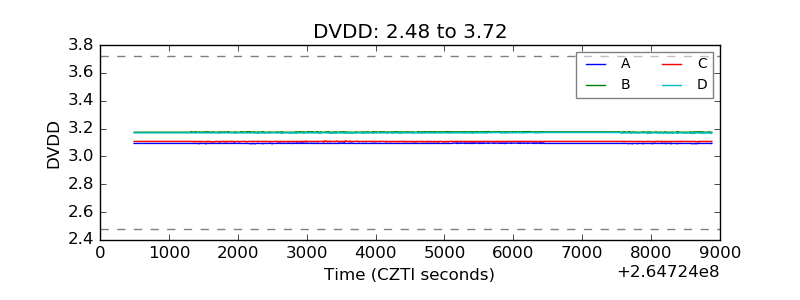 |
| Temperature 1 | 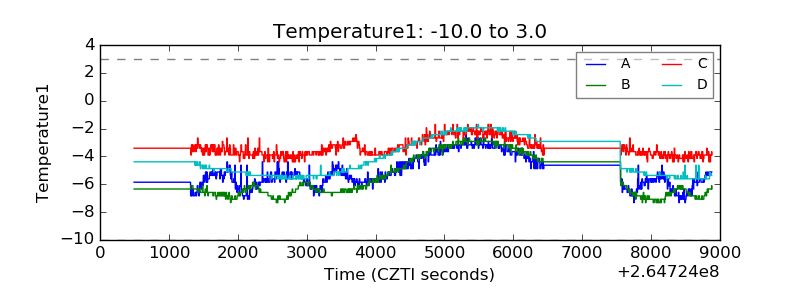 |
| Veto HV Monitor | 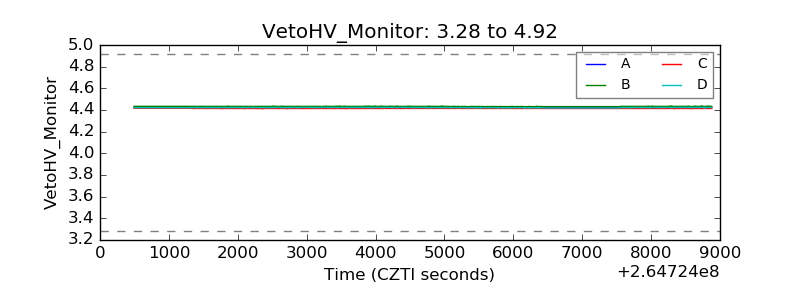 |
| Veto LLD | 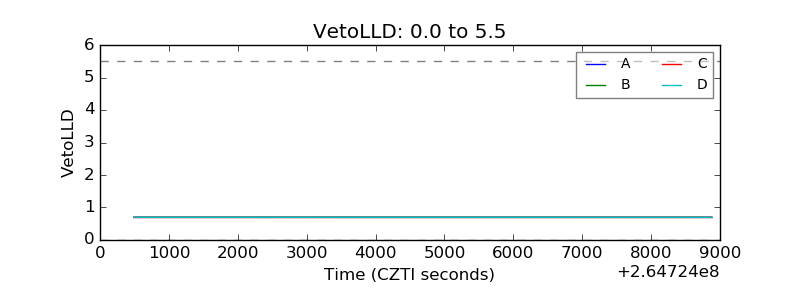 |
| Alpha Counter | 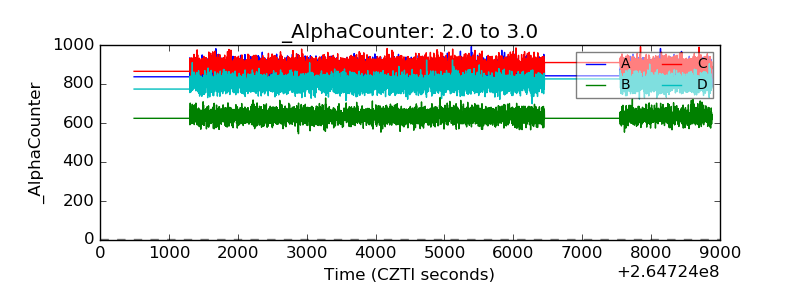 |
| _CPM_Rate | 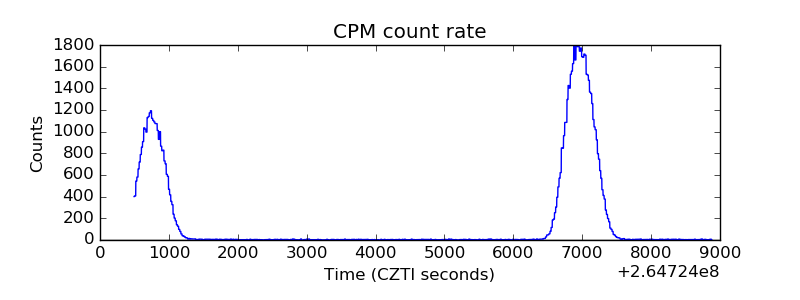 |
| CZT Counter |  |
| +2.5 Volts monitor |  |
| +5 Volts monitor |  |
| _ROLL_ROT | 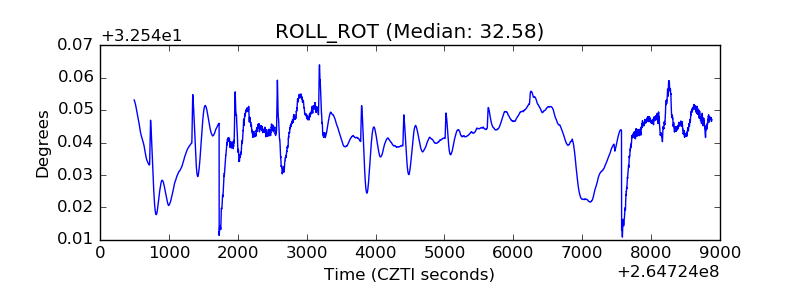 |
| _Roll_DEC | 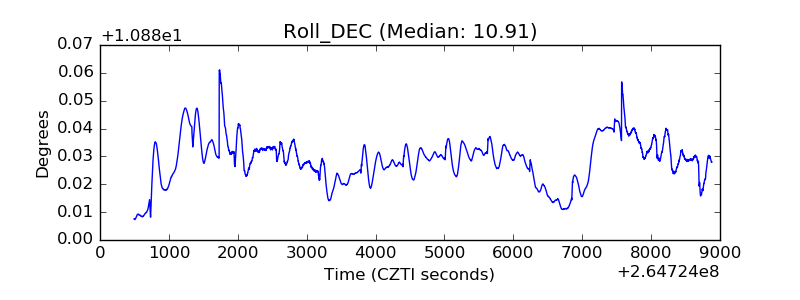 |
| _Roll_RA | 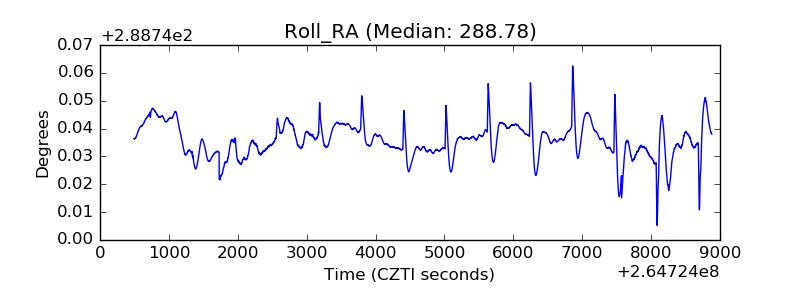 |
| Veto Counter | 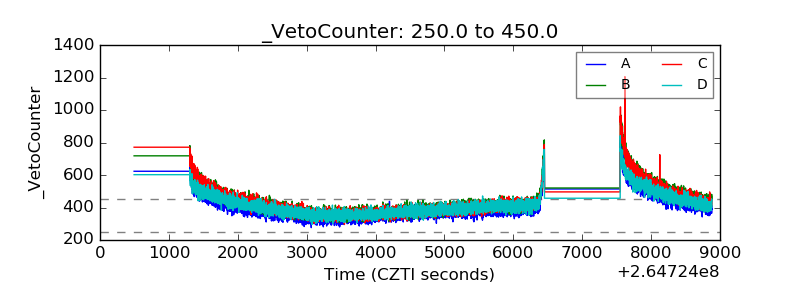 |