| Param | Original file | Final file |
|---|---|---|
| Filename | modeM0/AS1G08_078T01_9000002110_14327cztM0_level2.evt | modeM0/AS1G08_078T01_9000002110_14327cztM0_level2_quad_clean.evt |
| Size (bytes) | 75,211,200 | 23,754,240 |
| Size | 71.7 MB | 22.7 MB |
| Events in quadrant A | 575,097 | 165,341 |
| Events in quadrant B | 516,256 | 164,682 |
| Events in quadrant C | 560,008 | 157,212 |
| Events in quadrant D | 550,884 | 150,458 |
| Mode SS | |||
|---|---|---|---|
| Quadrant | BADHDUFLAG | Total packets | Discarded packets |
| A | 0 | 31 | 11 |
| B | 0 | 30 | 8 |
| C | 0 | 32 | 8 |
| D | 0 | 31 | 11 |
| Mode M0 | |||
|---|---|---|---|
| Quadrant | BADHDUFLAG | Total packets | Discarded packets |
| A | 0 | 3618 | 1291 |
| B | 0 | 3449 | 1315 |
| C | 0 | 3565 | 1348 |
| D | 0 | 3859 | 1571 |
| Mode M9 | |||
|---|---|---|---|
| Quadrant | BADHDUFLAG | Total packets | Discarded packets |
| A | 0 | 7 | 6 |
| B | 0 | 8 | 8 |
| C | 0 | 6 | 6 |
| D | 0 | 8 | 8 |
| Quadrant | Total seconds | Saturated seconds | Saturation percentage |
|---|---|---|---|
| A | 1077 | 1 | 0.092851% |
| B | 1046 | 0 | 0.000000% |
| C | 1063 | 0 | 0.000000% |
| D | 1040 | 0 | 0.000000% |
Noise dominated data is calculated using 1-second bins in cleaned event files. If a bin has >2000 counts, and if more than 50% of those come from <1% of pixels, then it is considered to be noise-dominated and hence unusable.
| Quadrant | # 1 sec bins | Bins with >0 counts | Bins with >2000 counts | High rate bins dominated by noise | Noise dominated (total time) | Noise dominated (detector-on time) | Marked lightcurve |
|---|---|---|---|---|---|---|---|
| A | 1460 | 1270 | 3 | 3 | 0.21% | 0.24% | 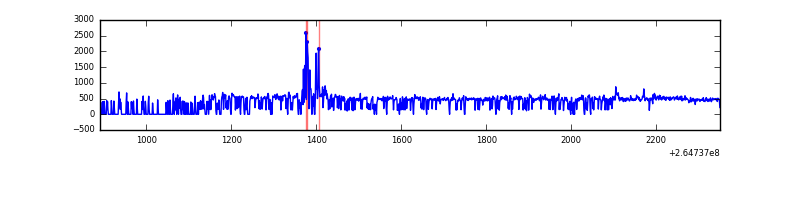 |
| B | 1459 | 1236 | 0 | 0 | 0.00% | 0.00% | 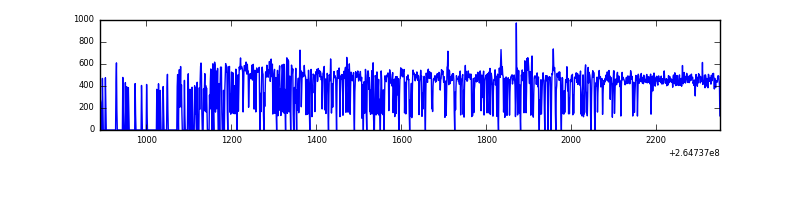 |
| C | 1459 | 1245 | 0 | 0 | 0.00% | 0.00% | 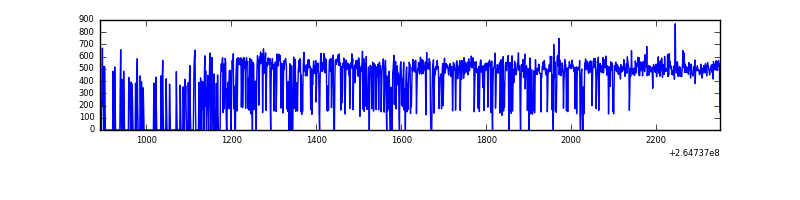 |
| D | 1443 | 1229 | 1 | 1 | 0.07% | 0.08% | 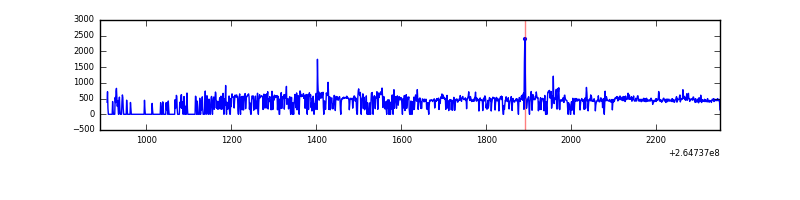 |
Top three noisy pixels from each quadrant. If the there are fewer than three noisy pixels in the level2.evt file, extra rows are filled as -1
| Pixel properties | Quadrant properties | ||||||
|---|---|---|---|---|---|---|---|
| Quadrant | DetID | PixID | Counts | Sigma | Mean | Median | Sigma |
| A | 12 | 189 | 44137 | 1522.52 | 134 | 131 | 28.9 |
| A | 8 | 15 | 11408 | 390.16 | 134 | 131 | 28.9 |
| A | 4 | 2 | 4181 | 140.12 | 134 | 131 | 28.9 |
| B | 12 | 111 | 2723 | 98.23 | 130 | 128 | 26.4 |
| B | 0 | 219 | 2632 | 94.79 | 130 | 128 | 26.4 |
| B | 4 | 173 | 2482 | 89.11 | 130 | 128 | 26.4 |
| C | 3 | 233 | 60994 | 1958.98 | 127 | 128 | 31.1 |
| C | 13 | 61 | 933 | 25.91 | 127 | 128 | 31.1 |
| C | 14 | 234 | 921 | 25.52 | 127 | 128 | 31.1 |
| D | 5 | 222 | 45932 | 1486.77 | 123 | 120 | 30.8 |
| D | 2 | 120 | 22077 | 712.59 | 123 | 120 | 30.8 |
| D | 1 | 52 | 7921 | 253.17 | 123 | 120 | 30.8 |
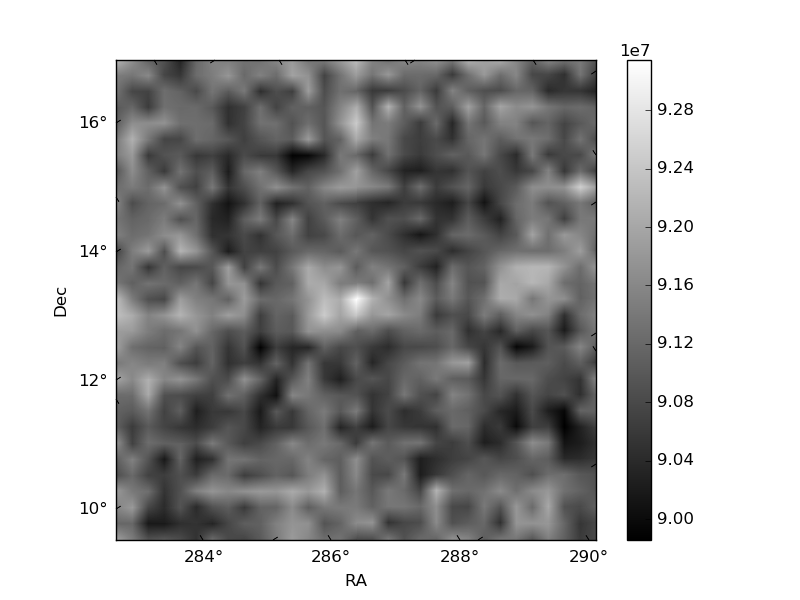
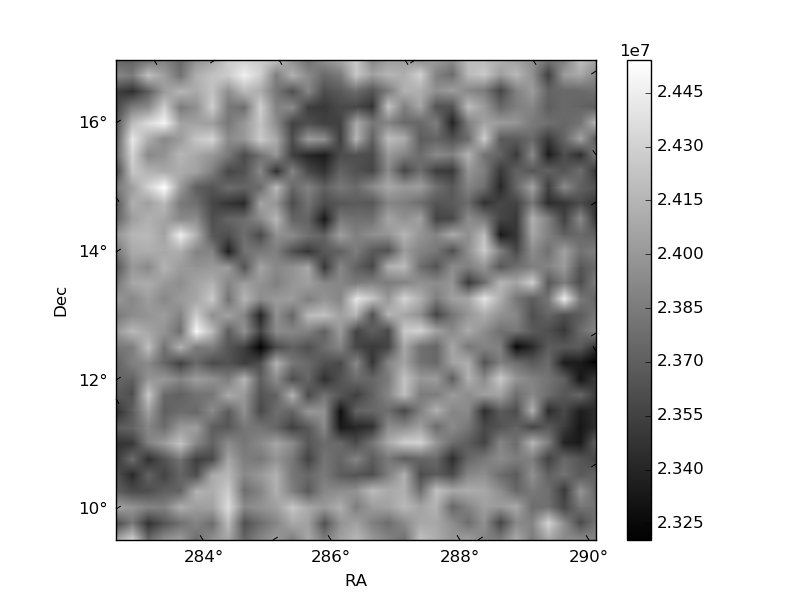
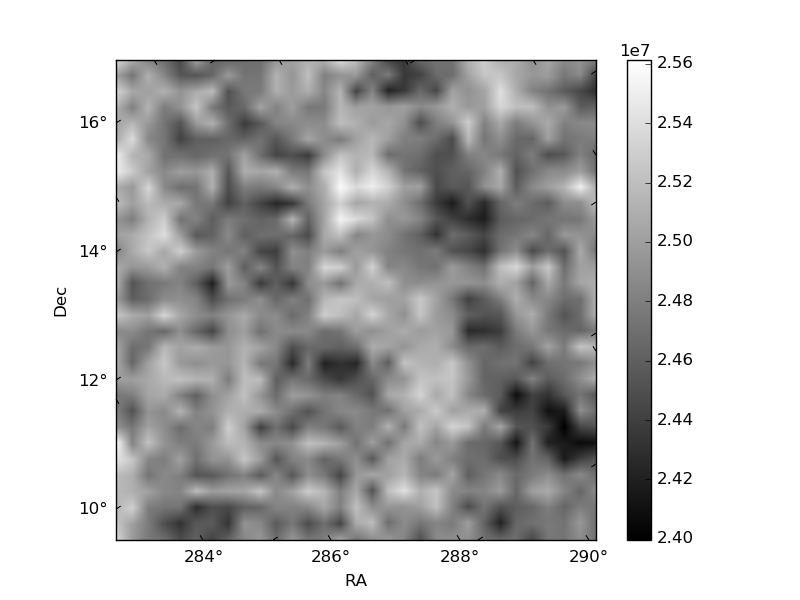
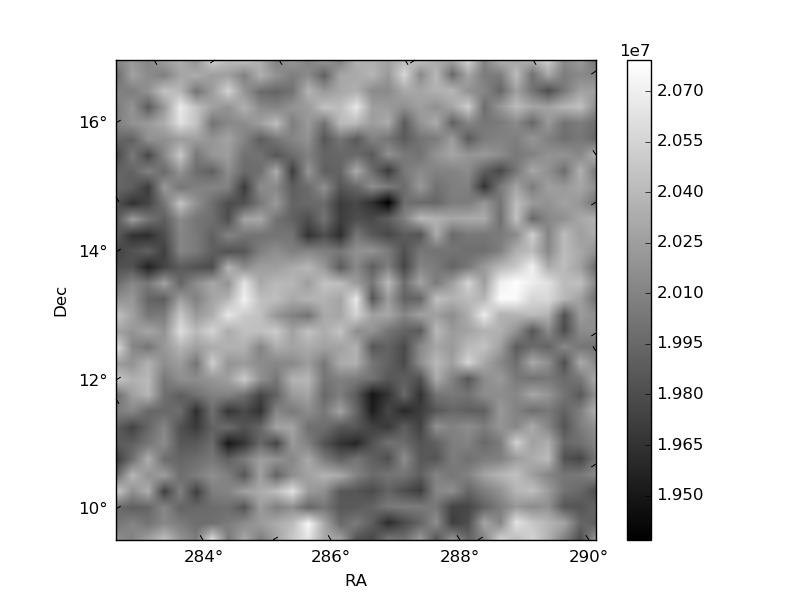
Histogram calculated using DETX and DETY for each event in the final _common_clean file
| Quadrant A | 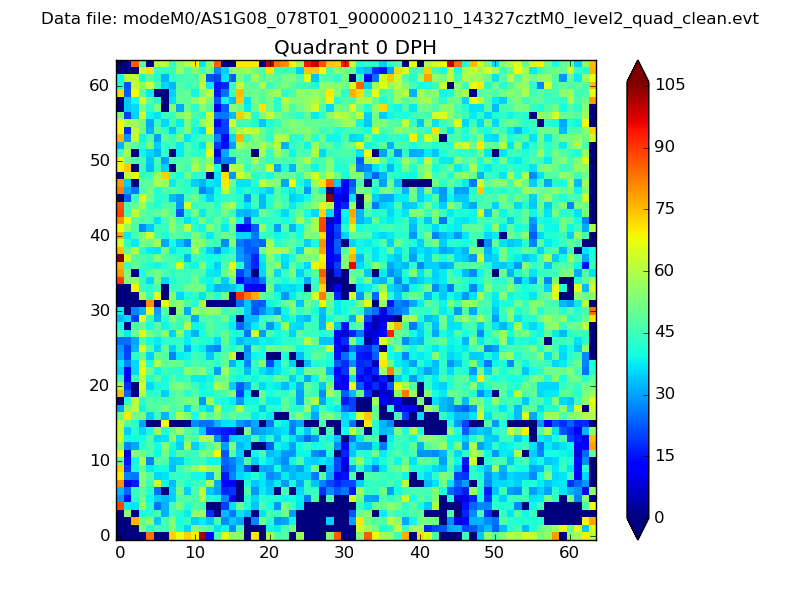 |
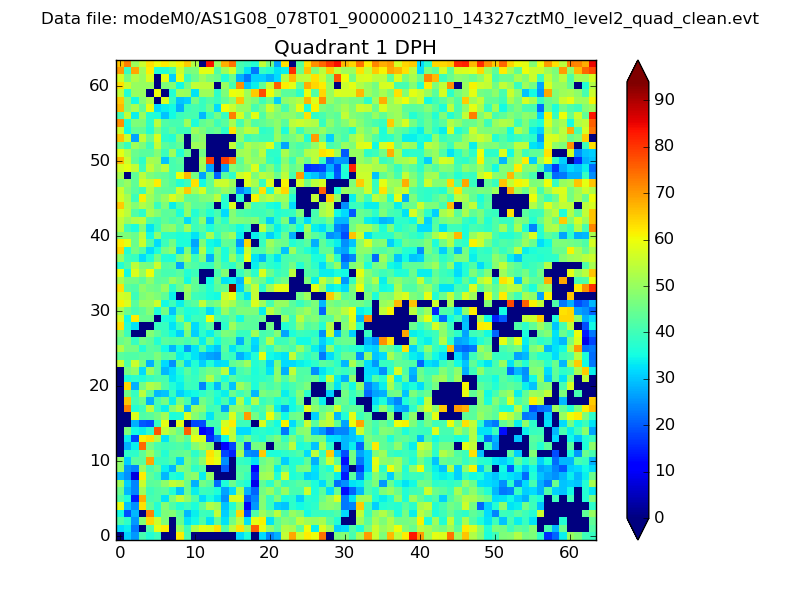 |
Quadrant B |
|---|---|---|---|
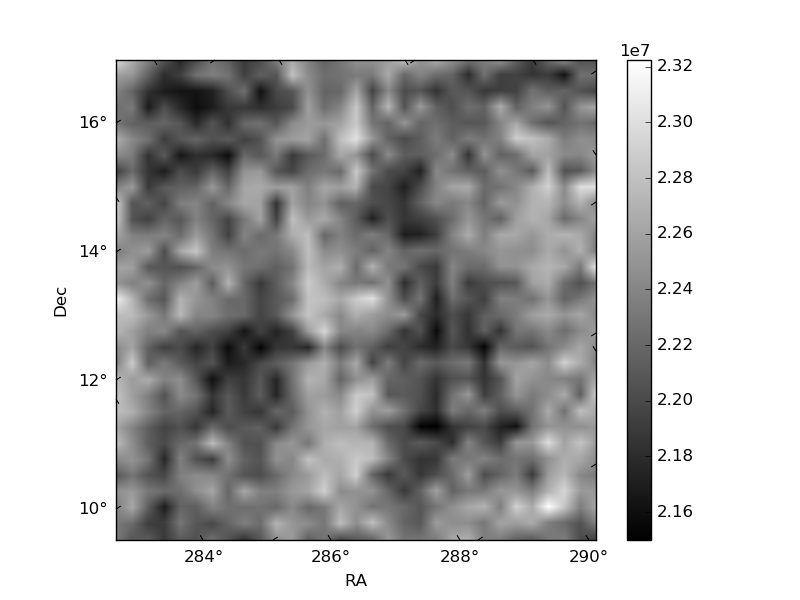
| Quadrant D | 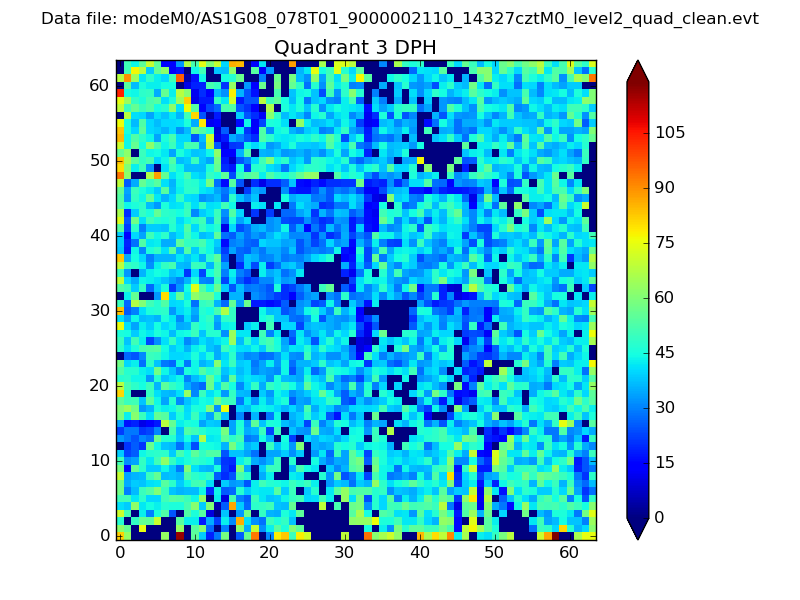 |
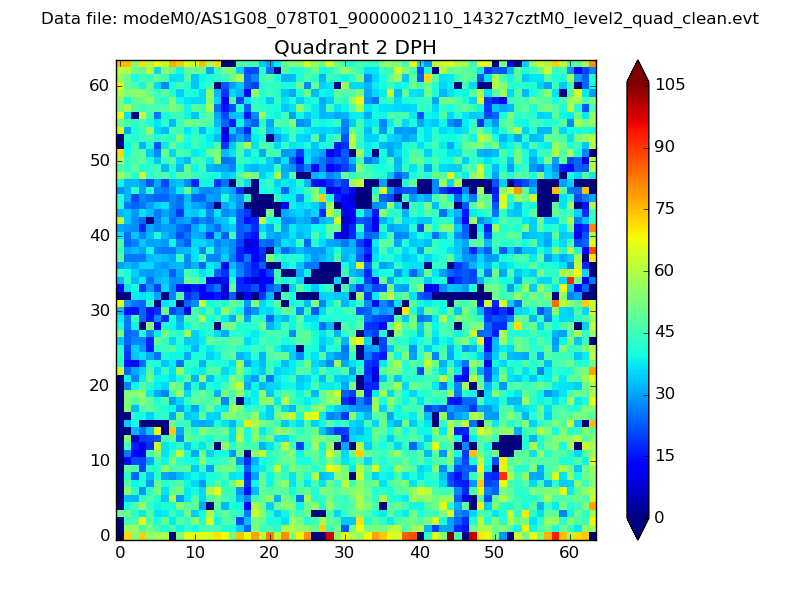 |
Quadrant C |
| Plot type | Count rate plots | Images |
|---|---|---|
| Comparison with Poisson distribution Blue bars denote a histogram of data divided into 1 sec bins. Red curve is a Poisson curve with rate = median count rate of data. |
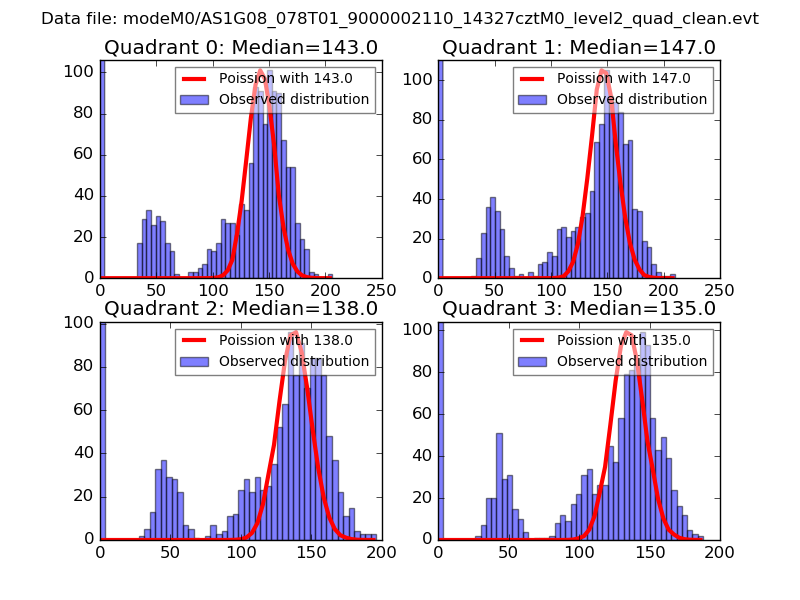 |
 |
| Quadrant-wise count rates Data is divided into 100 sec bins |
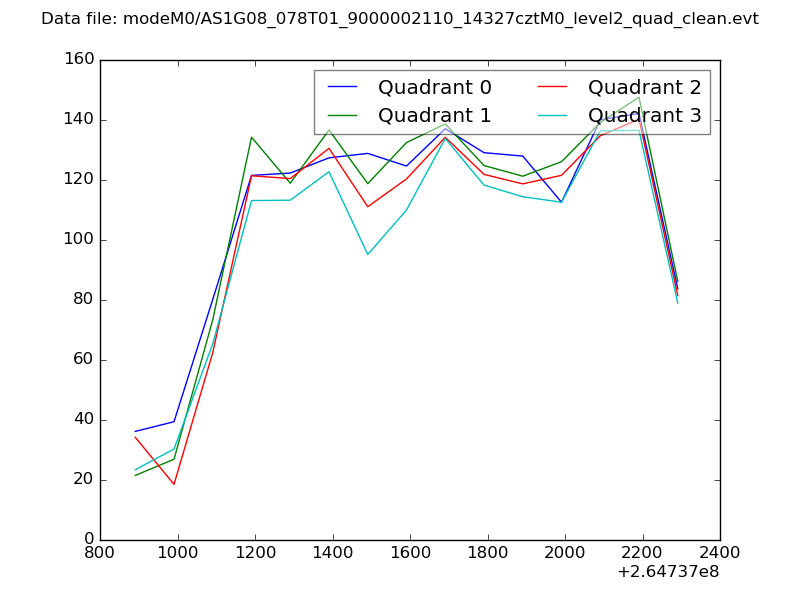 |
|
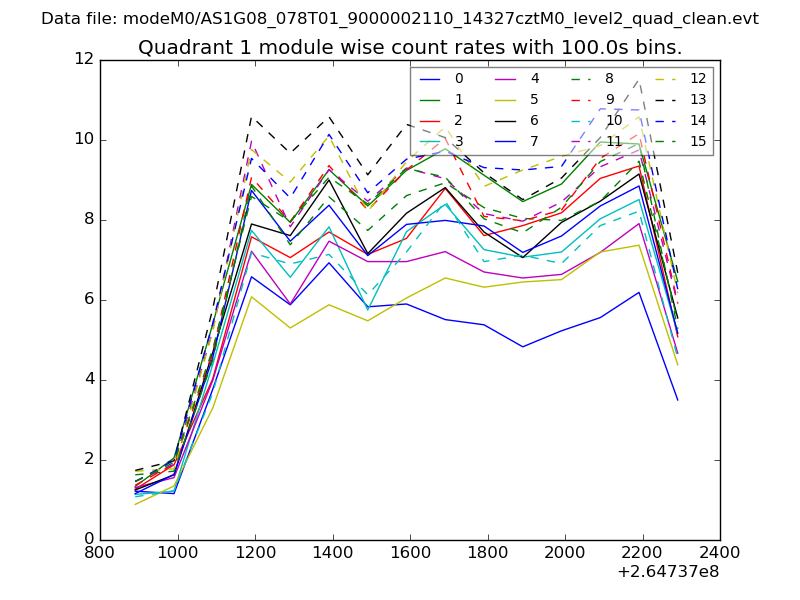
| Module-wise count rates for Quadrant A Data is divided into 100 sec bins |
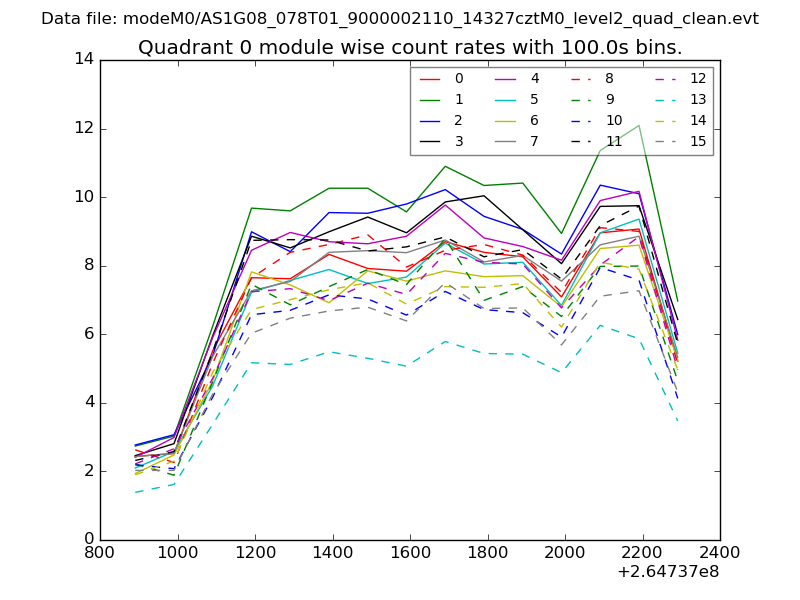 |
 |
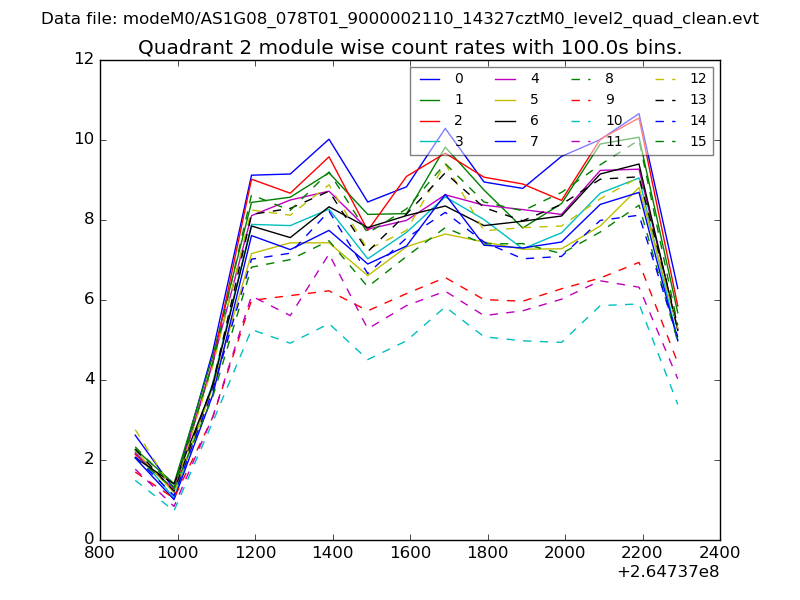
| Module-wise count rates for Quadrant B Data is divided into 100 sec bins |
 |
 |
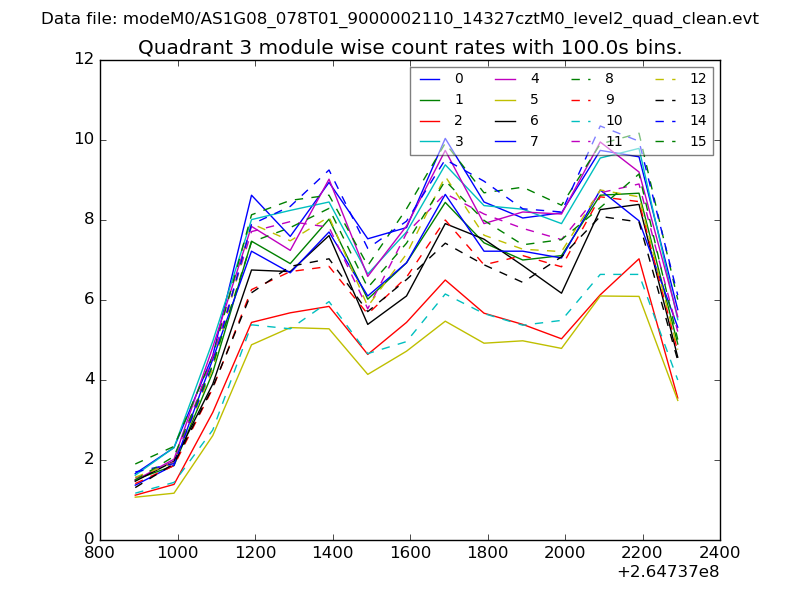
| Module-wise count rates for Quadrant C Data is divided into 100 sec bins |
 |
 |
| Module-wise count rates for Quadrant D Data is divided into 100 sec bins |
 |
 |
| Parameter | Plot |
|---|---|
| CZT HV Monitor | 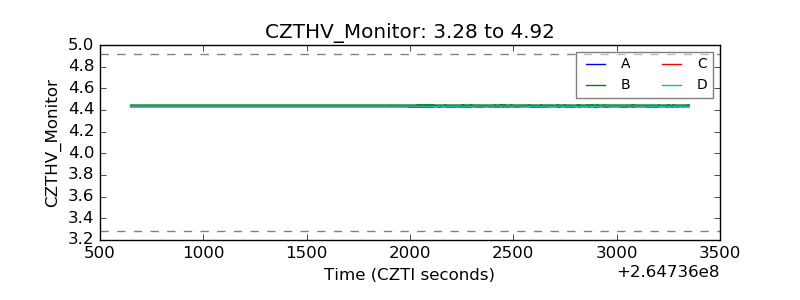 |
| D_VDD | 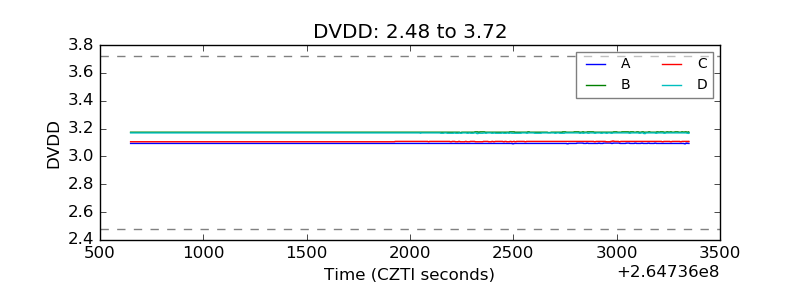 |
| Temperature 1 | 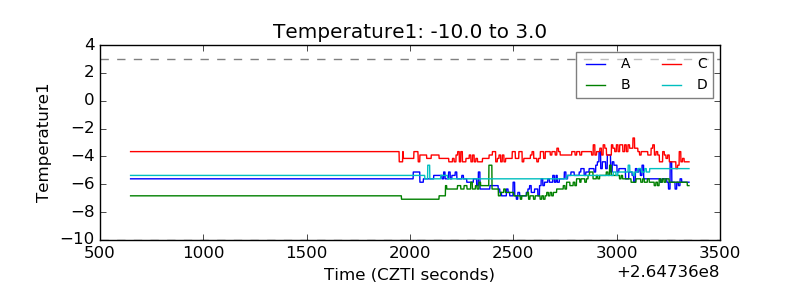 |
| Veto HV Monitor | 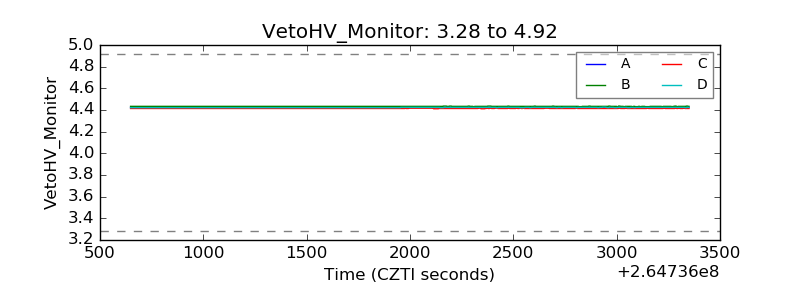 |
| Veto LLD | 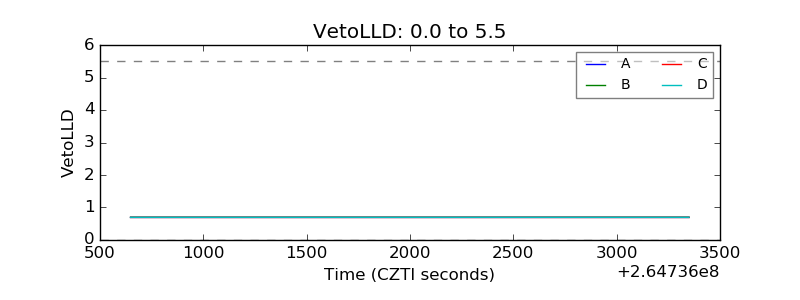 |
| Alpha Counter | 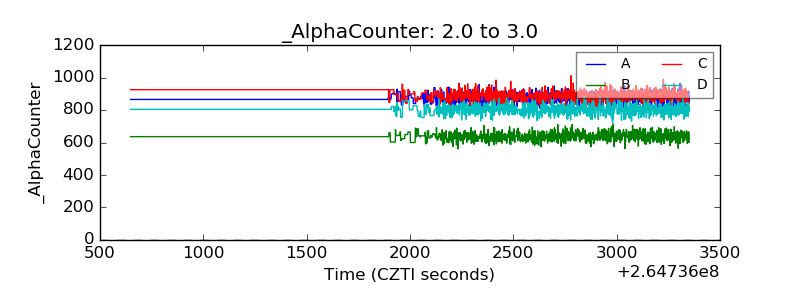 |
| _CPM_Rate | 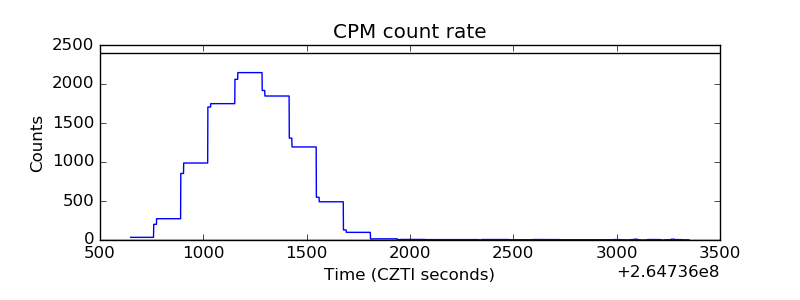 |
| CZT Counter | 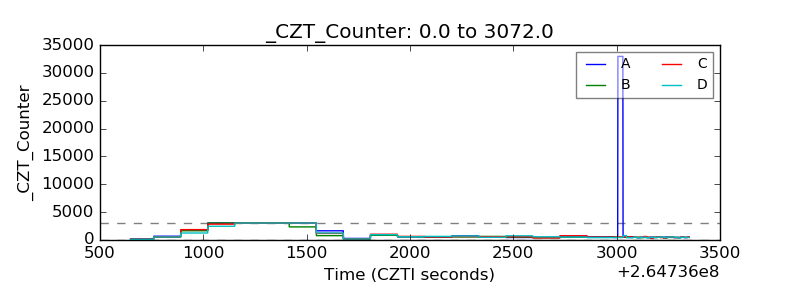 |
| +2.5 Volts monitor |  |
| +5 Volts monitor |  |
| _ROLL_ROT | 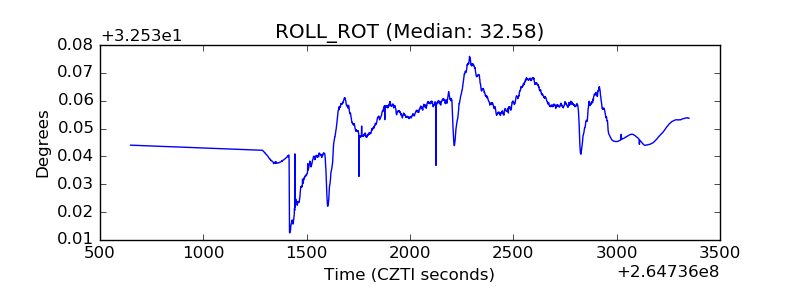 |
| _Roll_DEC | 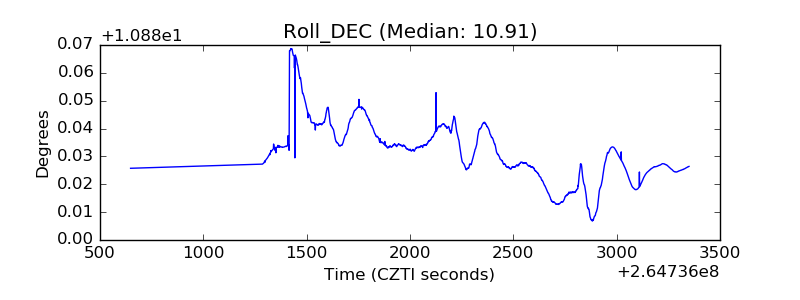 |
| _Roll_RA | 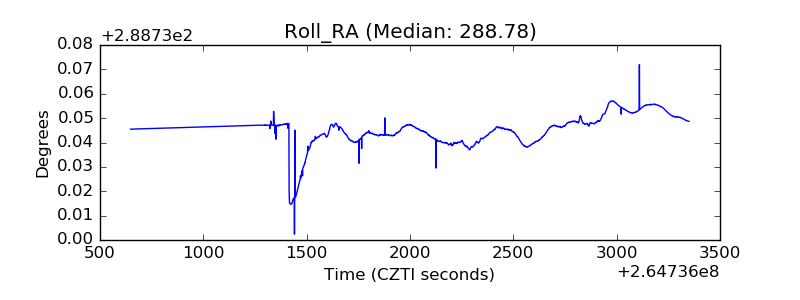 |
| Veto Counter | 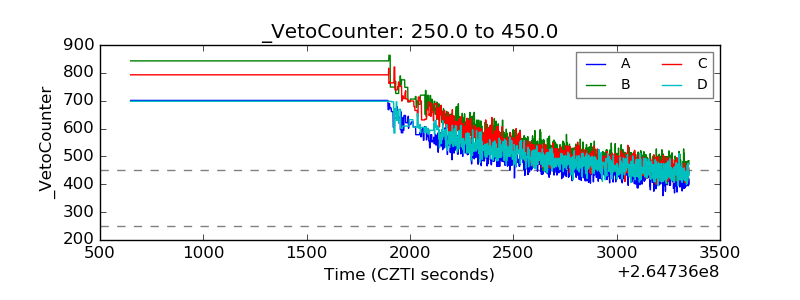 |