| Param | Original file | Final file |
|---|---|---|
| Filename | modeM0/AS1G08_078T01_9000002110_14328cztM0_level2.evt | modeM0/AS1G08_078T01_9000002110_14328cztM0_level2_quad_clean.evt |
| Size (bytes) | 847,416,960 | 157,458,240 |
| Size | 808.2 MB | 150.2 MB |
| Events in quadrant A | 5,810,415 | 1,017,832 |
| Events in quadrant B | 5,696,361 | 1,028,052 |
| Events in quadrant C | 5,972,845 | 989,048 |
| Events in quadrant D | 7,425,365 | 957,405 |
| Mode SS | |||
|---|---|---|---|
| Quadrant | BADHDUFLAG | Total packets | Discarded packets |
| A | 0 | 231 | 2 |
| B | 0 | 232 | 8 |
| C | 0 | 232 | 4 |
| D | 0 | 232 | 2 |
| Mode M0 | |||
|---|---|---|---|
| Quadrant | BADHDUFLAG | Total packets | Discarded packets |
| A | 0 | 24650 | 489 |
| B | 0 | 24317 | 513 |
| C | 0 | 24486 | 492 |
| D | 0 | 30479 | 936 |
| Mode M9 | |||
|---|---|---|---|
| Quadrant | BADHDUFLAG | Total packets | Discarded packets |
| A | 0 | 25 | 2 |
| B | 0 | 25 | 3 |
| C | 0 | 25 | 2 |
| D | 0 | 25 | 3 |
| Quadrant | Total seconds | Saturated seconds | Saturation percentage |
|---|---|---|---|
| A | 11244 | 68 | 0.604767% |
| B | 11237 | 83 | 0.738631% |
| C | 11235 | 47 | 0.418336% |
| D | 11188 | 260 | 2.323918% |
Noise dominated data is calculated using 1-second bins in cleaned event files. If a bin has >2000 counts, and if more than 50% of those come from <1% of pixels, then it is considered to be noise-dominated and hence unusable.
| Quadrant | # 1 sec bins | Bins with >0 counts | Bins with >2000 counts | High rate bins dominated by noise | Noise dominated (total time) | Noise dominated (detector-on time) | Marked lightcurve |
|---|---|---|---|---|---|---|---|
| A | 13896 | 11322 | 6 | 6 | 0.04% | 0.05% | 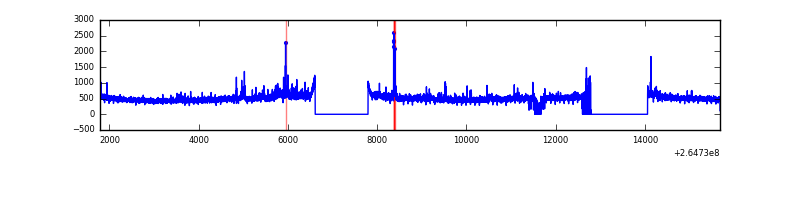 |
| B | 13896 | 11316 | 4 | 4 | 0.03% | 0.04% | 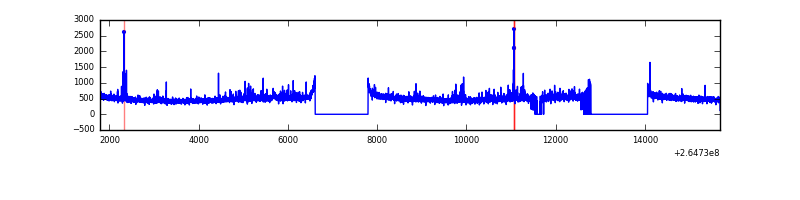 |
| C | 13896 | 11326 | 0 | 0 | 0.00% | 0.00% | 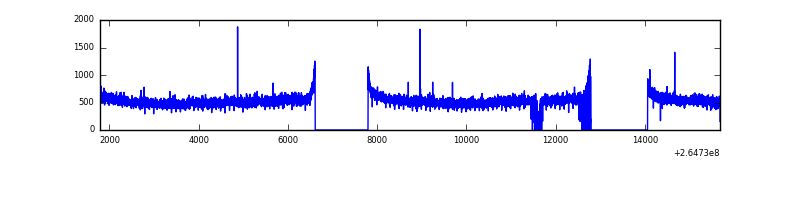 |
| D | 13896 | 11272 | 205 | 205 | 1.48% | 1.82% | 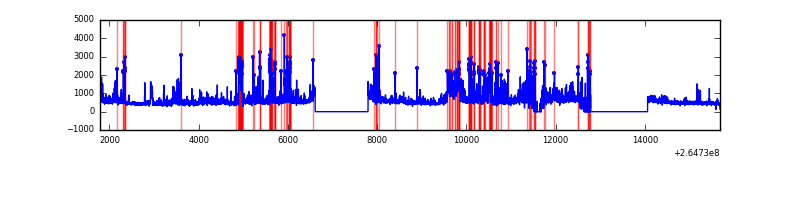 |
Top three noisy pixels from each quadrant. If the there are fewer than three noisy pixels in the level2.evt file, extra rows are filled as -1
| Pixel properties | Quadrant properties | ||||||
|---|---|---|---|---|---|---|---|
| Quadrant | DetID | PixID | Counts | Sigma | Mean | Median | Sigma |
| A | 12 | 189 | 173641 | 610.63 | 1419 | 1397 | 282.1 |
| A | 8 | 15 | 105846 | 370.28 | 1419 | 1397 | 282.1 |
| A | 4 | 2 | 76010 | 264.51 | 1419 | 1397 | 282.1 |
| B | 4 | 173 | 46131 | 169.37 | 1409 | 1377 | 264.2 |
| B | 5 | 32 | 39115 | 142.82 | 1409 | 1377 | 264.2 |
| B | 0 | 189 | 36926 | 134.54 | 1409 | 1377 | 264.2 |
| C | 3 | 233 | 673890 | 2150.69 | 1356 | 1368 | 312.7 |
| C | 13 | 61 | 9617 | 26.38 | 1356 | 1368 | 312.7 |
| C | 1 | 0 | 5680 | 13.79 | 1356 | 1368 | 312.7 |
| D | 5 | 222 | 1063468 | 3356.45 | 1341 | 1312 | 316.5 |
| D | 2 | 120 | 436683 | 1375.79 | 1341 | 1312 | 316.5 |
| D | 12 | 110 | 422527 | 1331.06 | 1341 | 1312 | 316.5 |
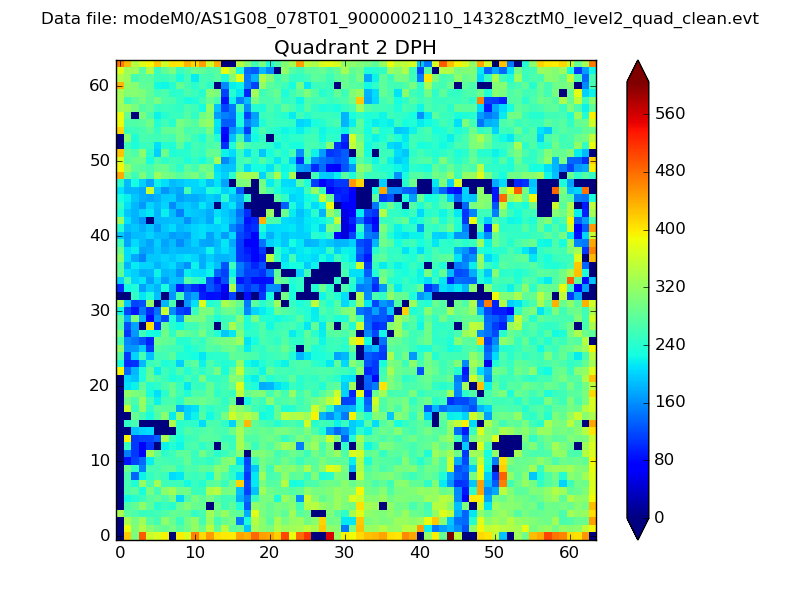
Histogram calculated using DETX and DETY for each event in the final _common_clean file
| Quadrant A | 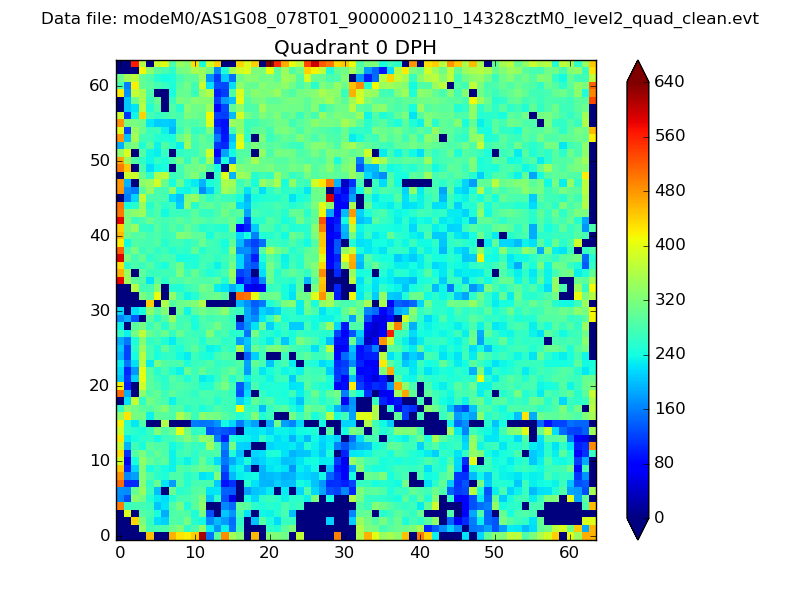 |
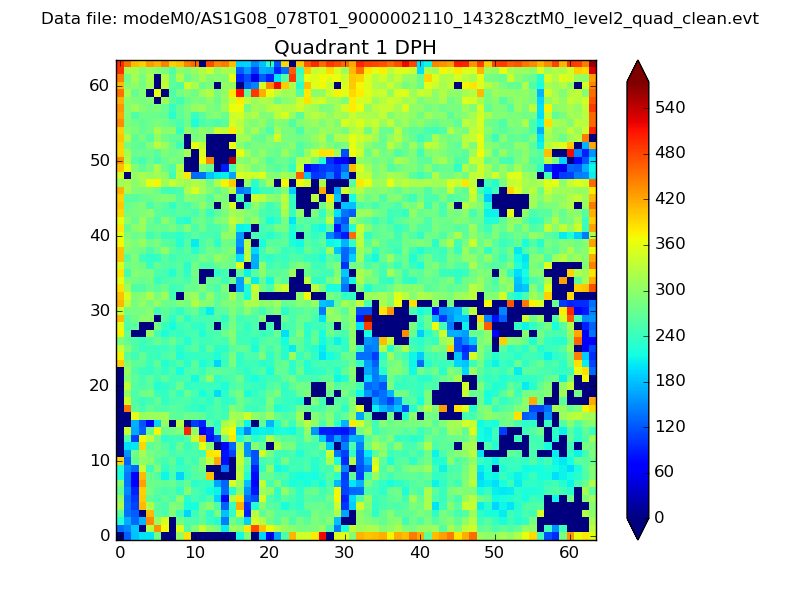 |
Quadrant B |
|---|---|---|---|
| Quadrant D | 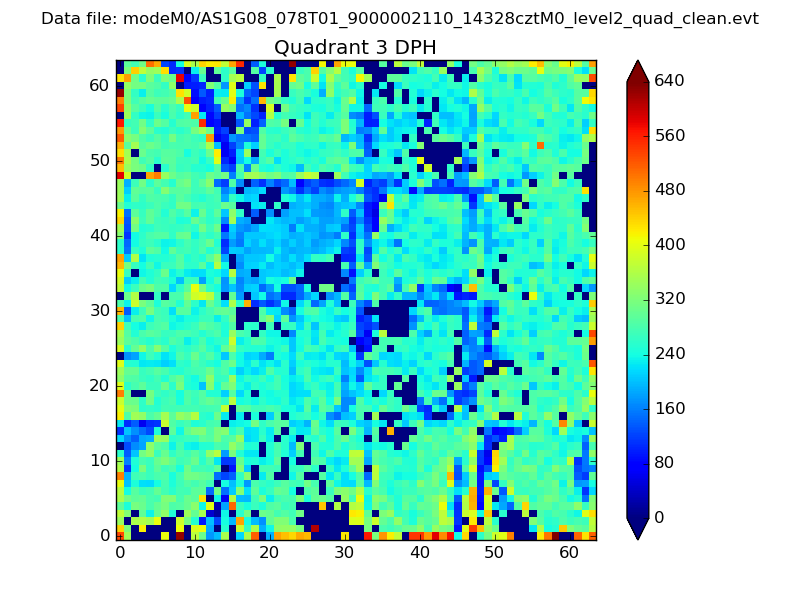 |
 |
Quadrant C |
| Plot type | Count rate plots | Images |
|---|---|---|
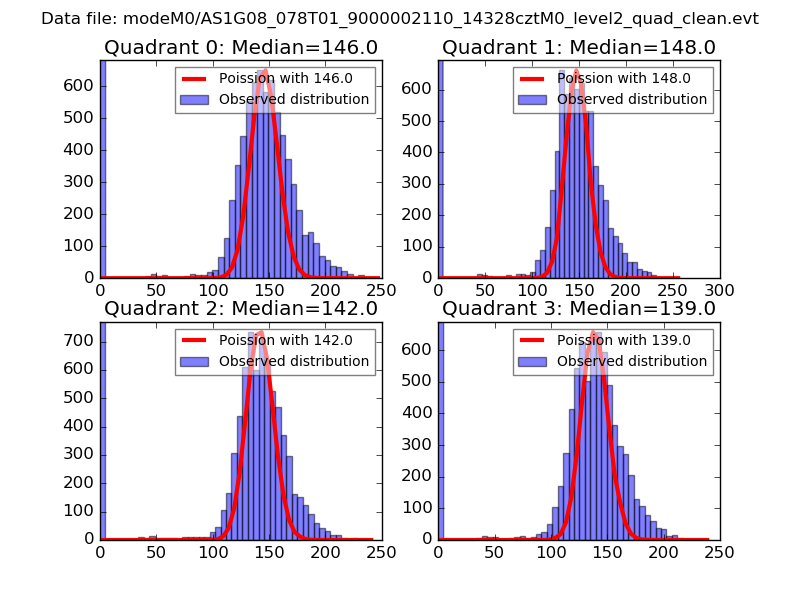
| Comparison with Poisson distribution Blue bars denote a histogram of data divided into 1 sec bins. Red curve is a Poisson curve with rate = median count rate of data. |
 |
 |
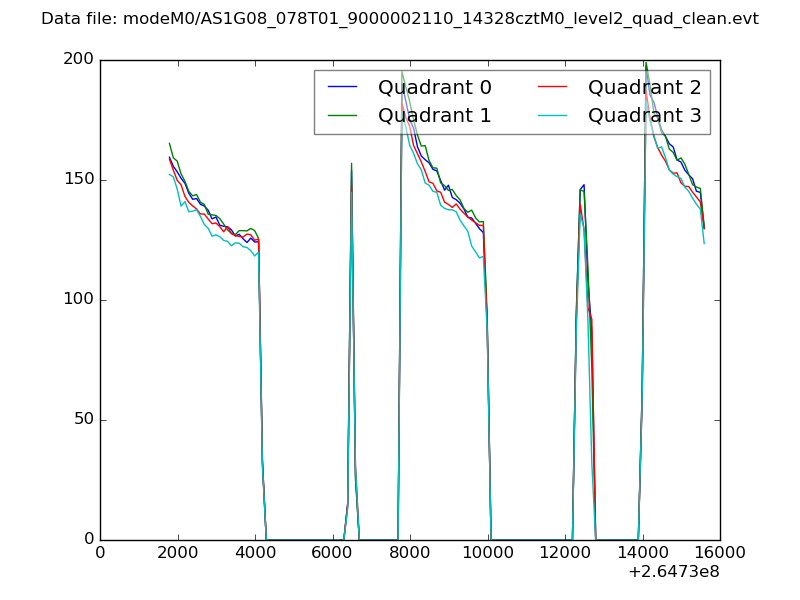
| Quadrant-wise count rates Data is divided into 100 sec bins |
 |
|
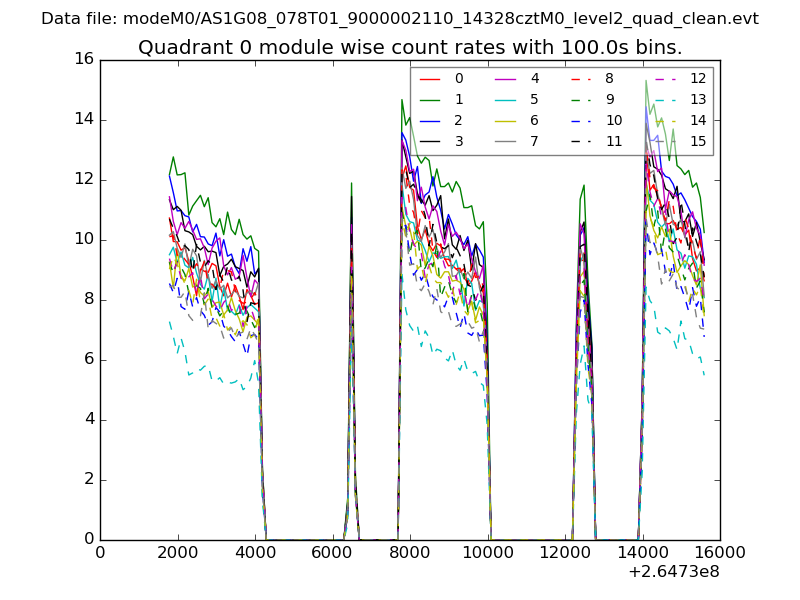
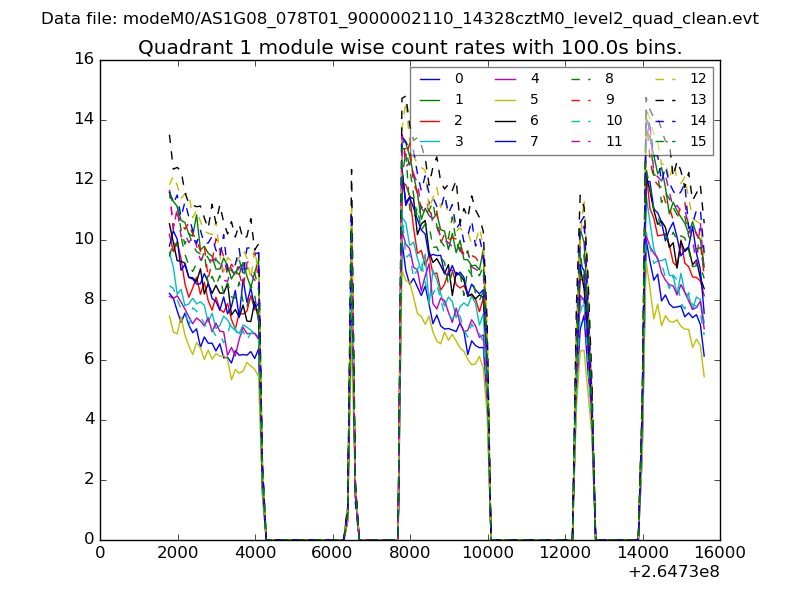
| Module-wise count rates for Quadrant A Data is divided into 100 sec bins |
 |
 |
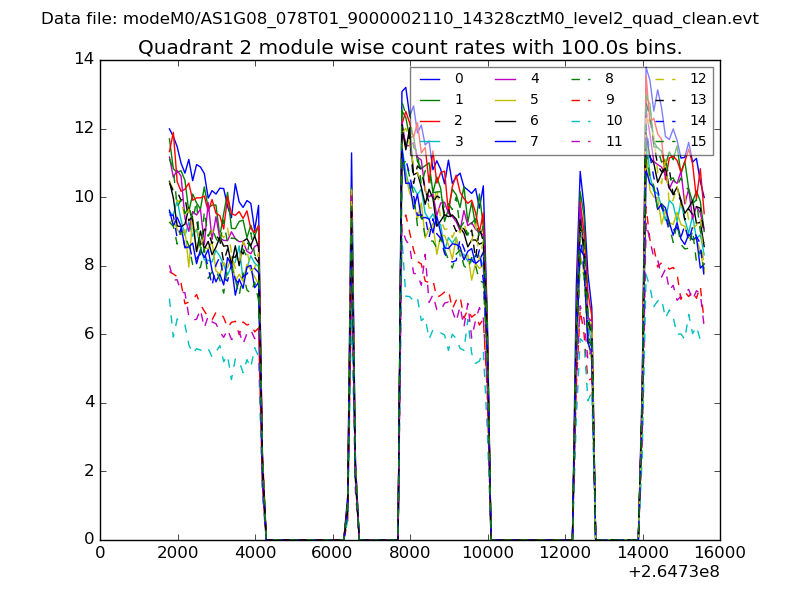
| Module-wise count rates for Quadrant B Data is divided into 100 sec bins |
 |
 |
| Module-wise count rates for Quadrant C Data is divided into 100 sec bins |
 |
 |
| Module-wise count rates for Quadrant D Data is divided into 100 sec bins |
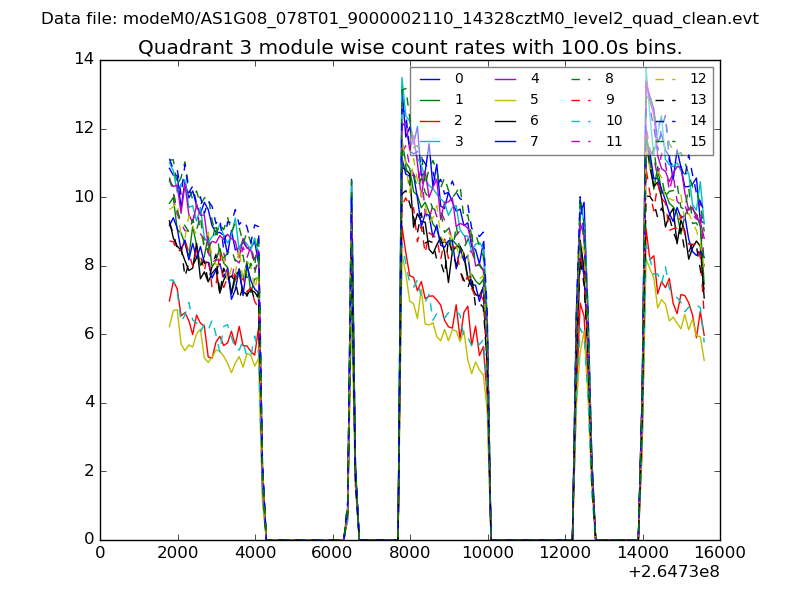 |
 |
| Parameter | Plot |
|---|---|
| CZT HV Monitor | 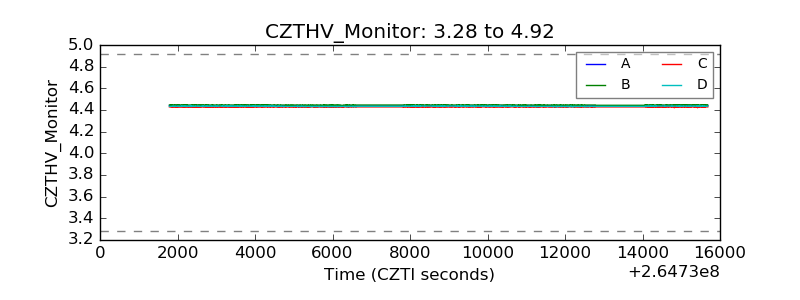 |
| D_VDD |  |
| Temperature 1 | 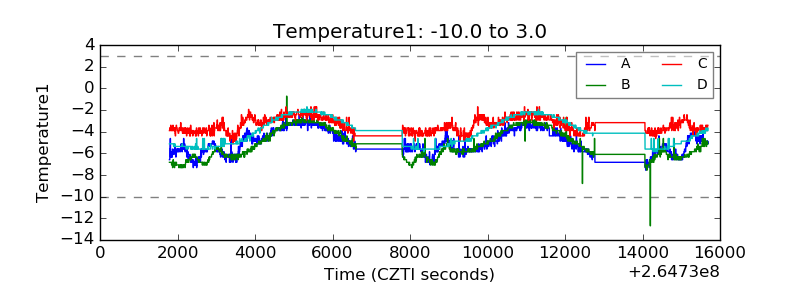 |
| Veto HV Monitor |  |
| Veto LLD | 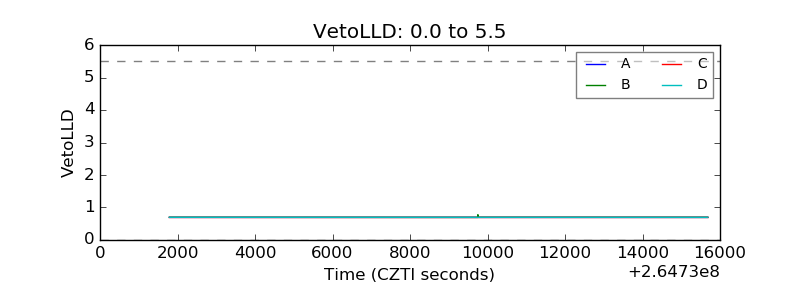 |
| Alpha Counter | 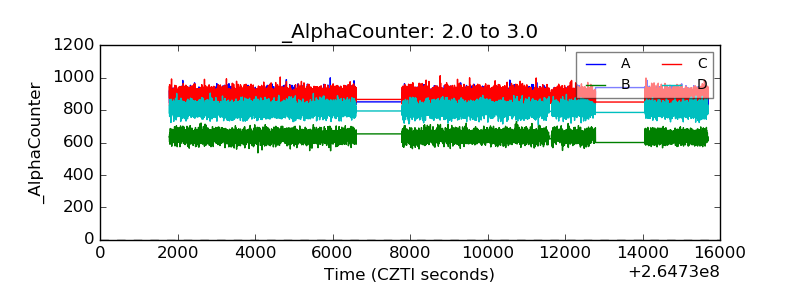 |
| _CPM_Rate | 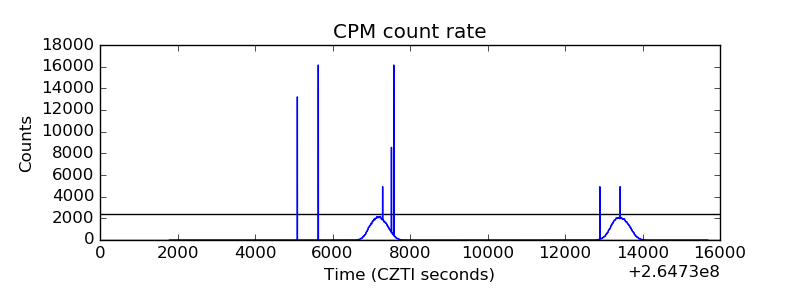 |
| CZT Counter | 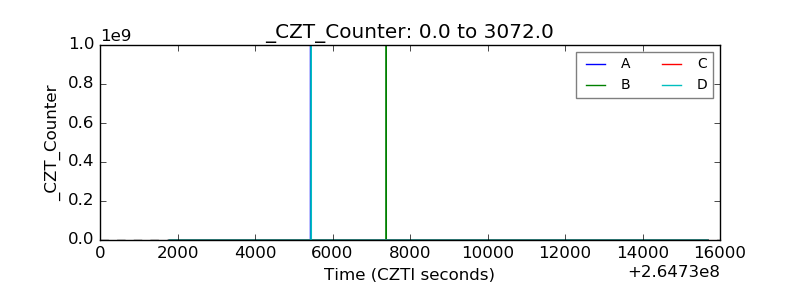 |
| +2.5 Volts monitor |  |
| +5 Volts monitor |  |
| _ROLL_ROT | 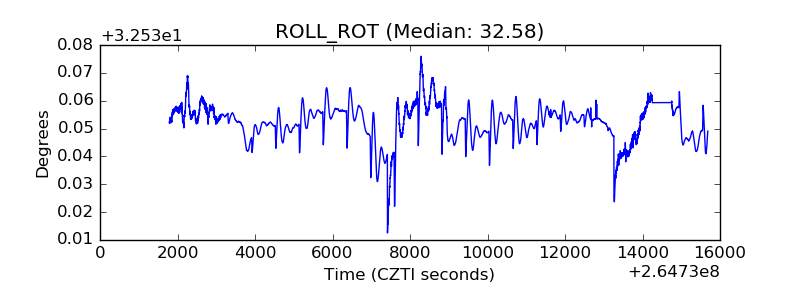 |
| _Roll_DEC | 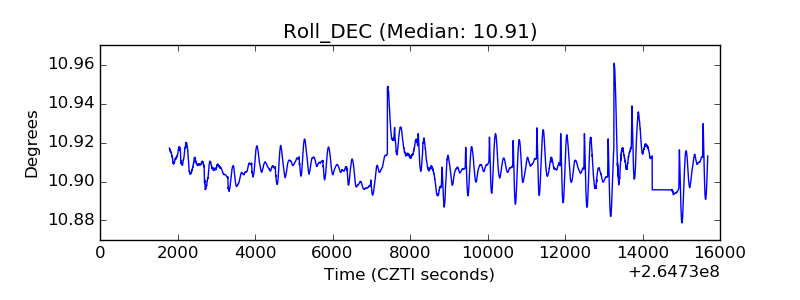 |
| _Roll_RA | 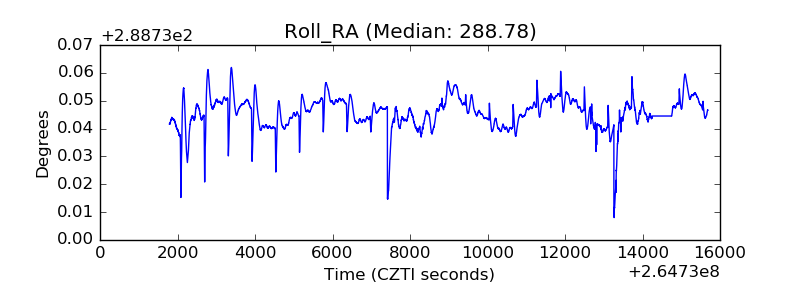 |
| Veto Counter | 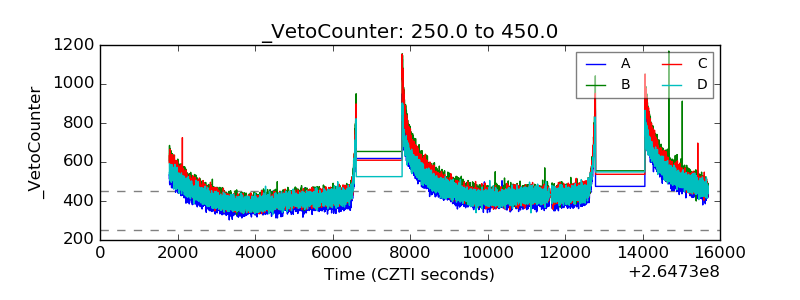 |