| Param | Original file | Final file |
|---|---|---|
| Filename | modeM0/AS1G08_078T01_9000002110_14330cztM0_level2.evt | modeM0/AS1G08_078T01_9000002110_14330cztM0_level2_quad_clean.evt |
| Size (bytes) | 431,375,040 | 72,204,480 |
| Size | 411.4 MB | 68.9 MB |
| Events in quadrant A | 3,034,230 | 454,918 |
| Events in quadrant B | 2,948,214 | 458,857 |
| Events in quadrant C | 2,943,800 | 443,521 |
| Events in quadrant D | 3,750,056 | 429,803 |
| Mode SS | |||
|---|---|---|---|
| Quadrant | BADHDUFLAG | Total packets | Discarded packets |
| A | 0 | 116 | 0 |
| B | 0 | 116 | 0 |
| C | 0 | 116 | 0 |
| D | 0 | 116 | 0 |
| Mode M0 | |||
|---|---|---|---|
| Quadrant | BADHDUFLAG | Total packets | Discarded packets |
| A | 0 | 12292 | 2 |
| B | 0 | 12008 | 1 |
| C | 0 | 11959 | 1 |
| D | 0 | 14767 | 1 |
| Mode M9 | |||
|---|---|---|---|
| Quadrant | BADHDUFLAG | Total packets | Discarded packets |
| A | 0 | 13 | 0 |
| B | 0 | 13 | 0 |
| C | 0 | 13 | 0 |
| D | 0 | 13 | 0 |
| Quadrant | Total seconds | Saturated seconds | Saturation percentage |
|---|---|---|---|
| A | 5711 | 63 | 1.103134% |
| B | 5711 | 78 | 1.365785% |
| C | 5711 | 34 | 0.595342% |
| D | 5711 | 88 | 1.540886% |
Noise dominated data is calculated using 1-second bins in cleaned event files. If a bin has >2000 counts, and if more than 50% of those come from <1% of pixels, then it is considered to be noise-dominated and hence unusable.
| Quadrant | # 1 sec bins | Bins with >0 counts | Bins with >2000 counts | High rate bins dominated by noise | Noise dominated (total time) | Noise dominated (detector-on time) | Marked lightcurve |
|---|---|---|---|---|---|---|---|
| A | 6972 | 5713 | 0 | 0 | 0.00% | 0.00% | 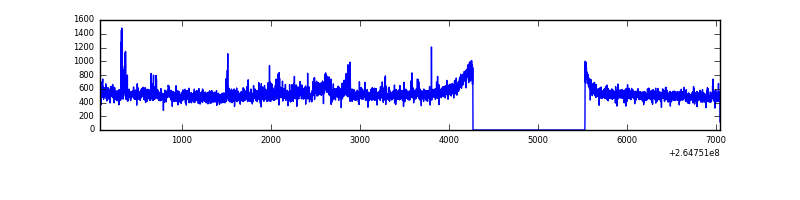 |
| B | 6972 | 5712 | 0 | 0 | 0.00% | 0.00% | 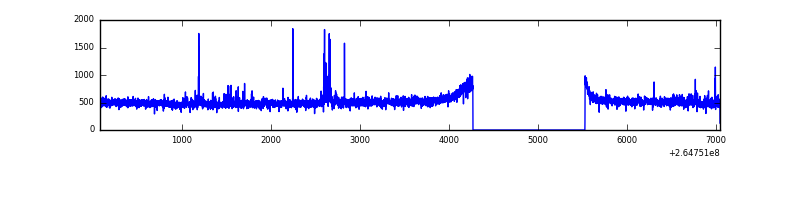 |
| C | 6972 | 5713 | 0 | 0 | 0.00% | 0.00% | 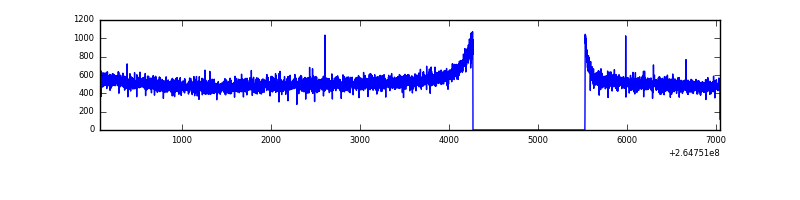 |
| D | 6972 | 5713 | 37 | 37 | 0.53% | 0.65% | 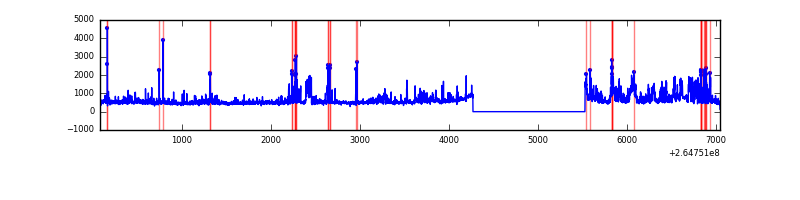 |
Top three noisy pixels from each quadrant. If the there are fewer than three noisy pixels in the level2.evt file, extra rows are filled as -1
| Pixel properties | Quadrant properties | ||||||
|---|---|---|---|---|---|---|---|
| Quadrant | DetID | PixID | Counts | Sigma | Mean | Median | Sigma |
| A | 12 | 189 | 156730 | 1039.56 | 746 | 735 | 150.1 |
| A | 0 | 226 | 6901 | 41.09 | 746 | 735 | 150.1 |
| A | 12 | 194 | 5580 | 32.29 | 746 | 735 | 150.1 |
| B | 0 | 189 | 34268 | 237.9 | 735 | 720 | 141.0 |
| B | 0 | 214 | 17969 | 122.32 | 735 | 720 | 141.0 |
| B | 12 | 111 | 16397 | 111.17 | 735 | 720 | 141.0 |
| C | 3 | 233 | 183579 | 1114.06 | 708 | 713 | 164.1 |
| C | 13 | 61 | 4949 | 25.81 | 708 | 713 | 164.1 |
| C | 3 | 202 | 1652 | 5.72 | 708 | 713 | 164.1 |
| D | 1 | 52 | 450432 | 2635.81 | 714 | 696 | 170.6 |
| D | 5 | 222 | 210079 | 1227.15 | 714 | 696 | 170.6 |
| D | 2 | 120 | 115339 | 671.9 | 714 | 696 | 170.6 |
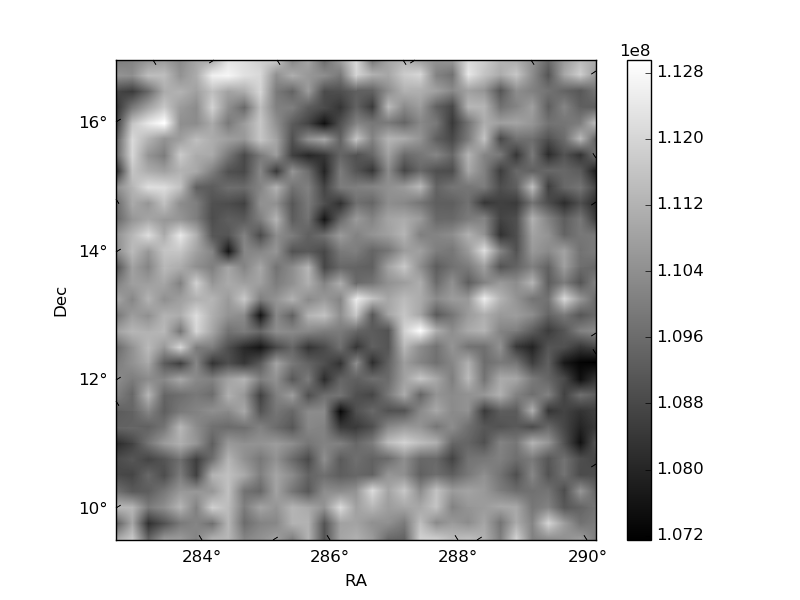
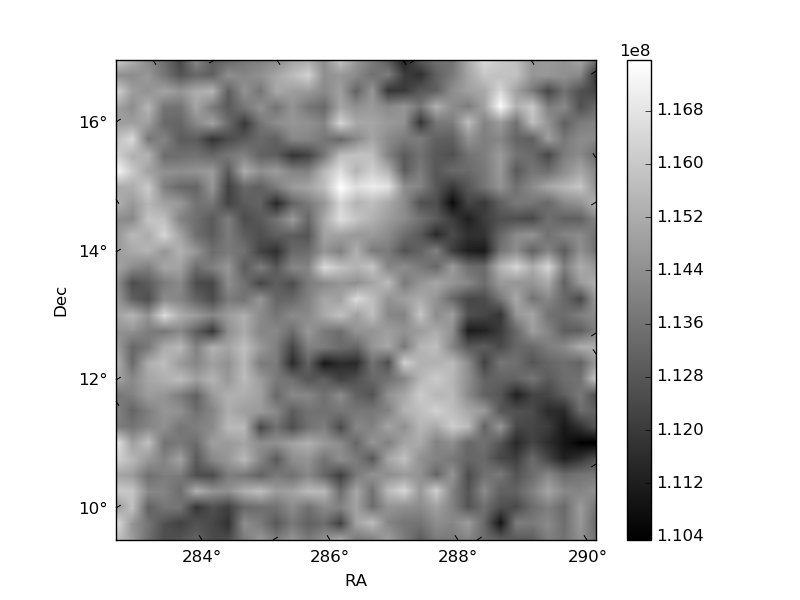
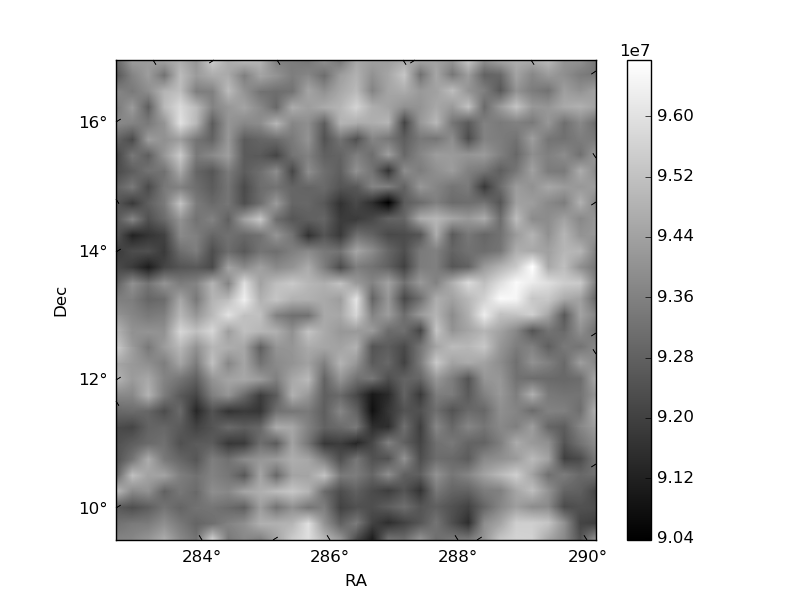
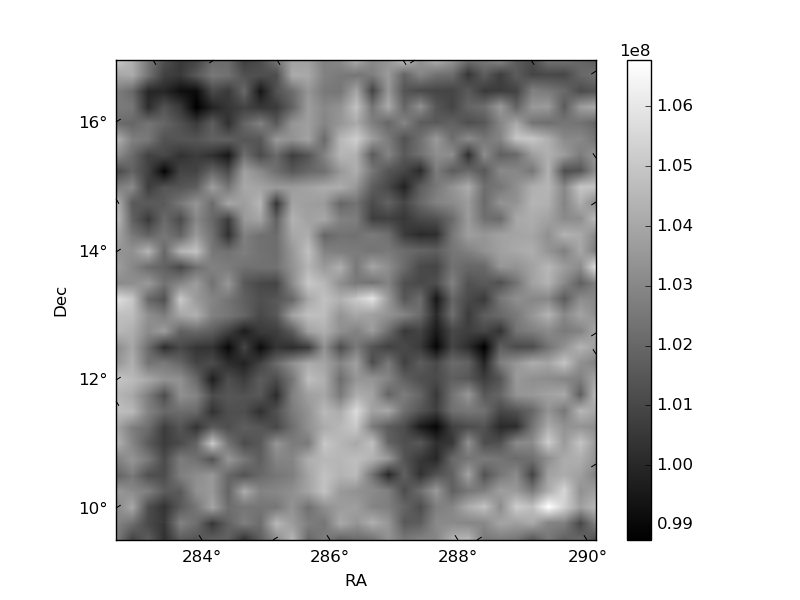
Histogram calculated using DETX and DETY for each event in the final _common_clean file
| Quadrant A | 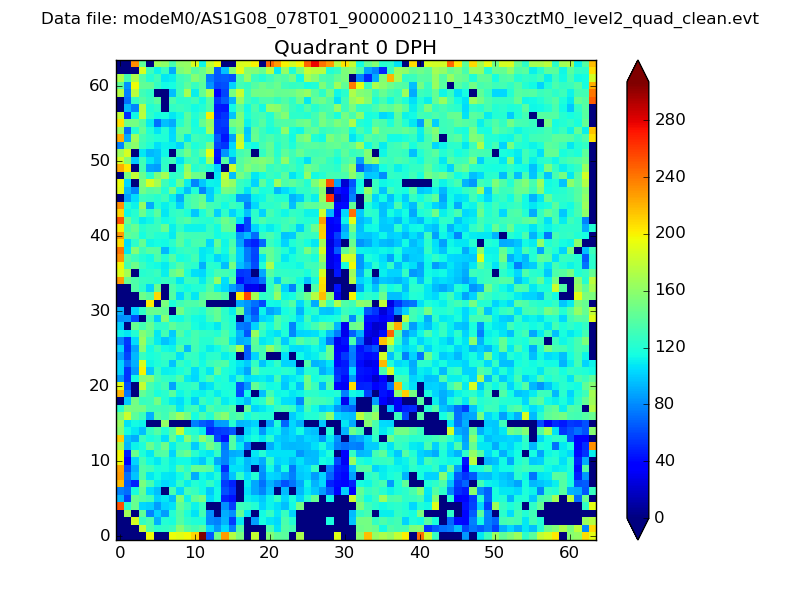 |
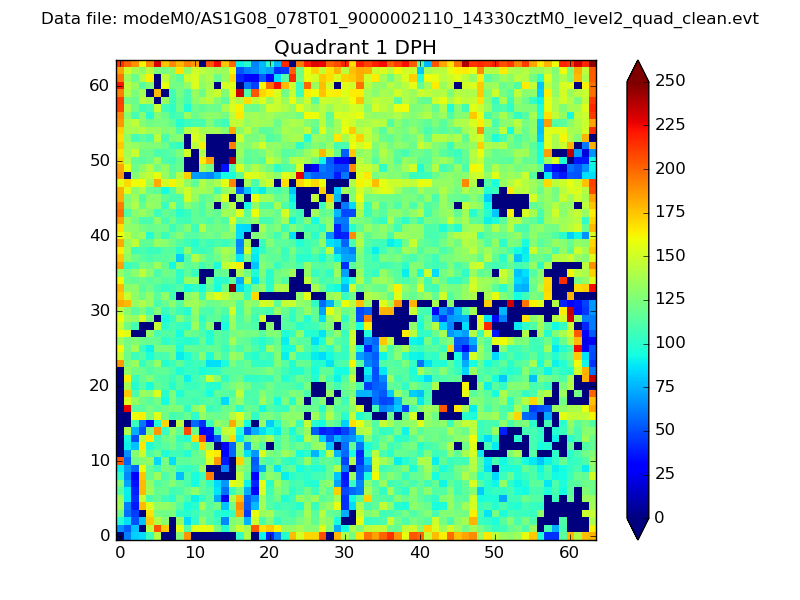 |
Quadrant B |
|---|---|---|---|
| Quadrant D | 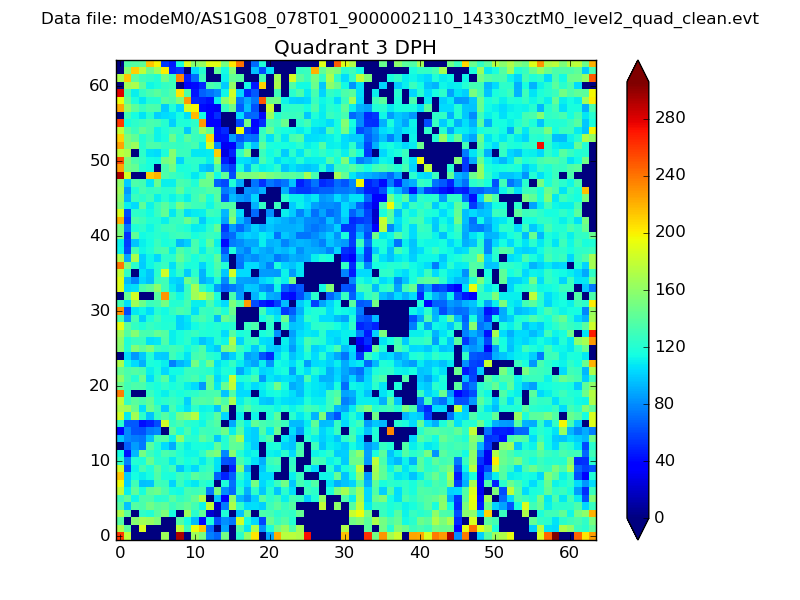 |
 |
Quadrant C |
| Plot type | Count rate plots | Images |
|---|---|---|
| Comparison with Poisson distribution Blue bars denote a histogram of data divided into 1 sec bins. Red curve is a Poisson curve with rate = median count rate of data. |
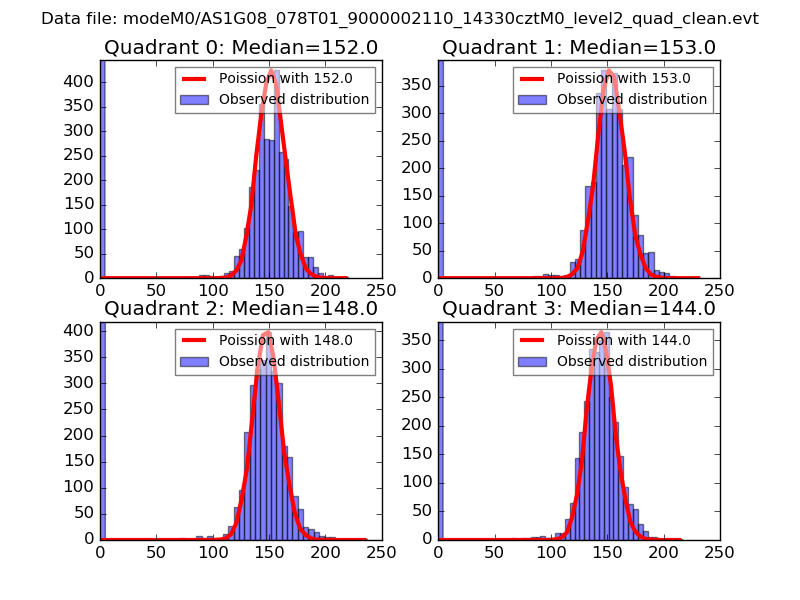 |
 |
| Quadrant-wise count rates Data is divided into 100 sec bins |
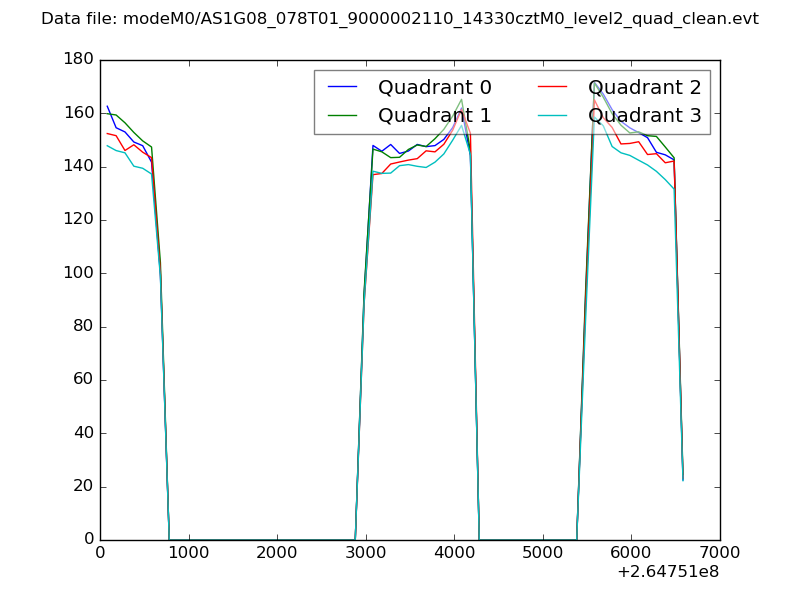 |
|
| Module-wise count rates for Quadrant A Data is divided into 100 sec bins |
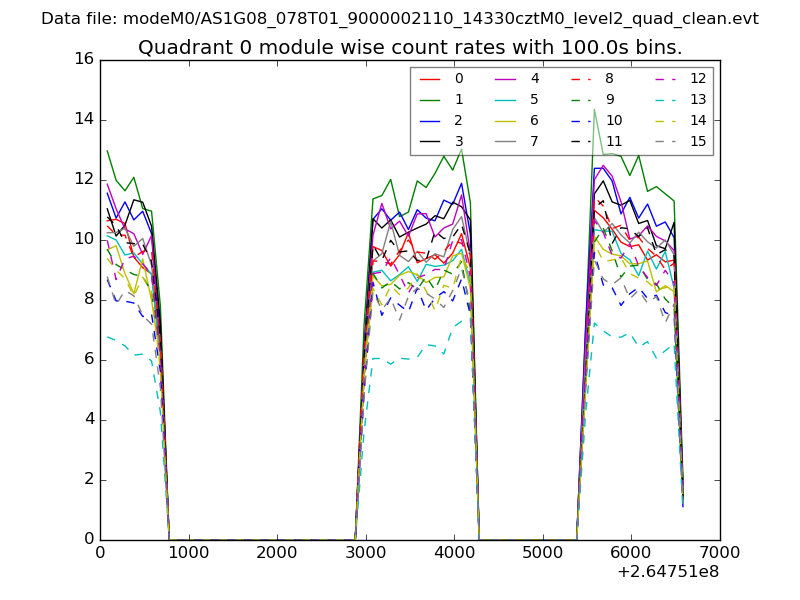 |
 |
| Module-wise count rates for Quadrant B Data is divided into 100 sec bins |
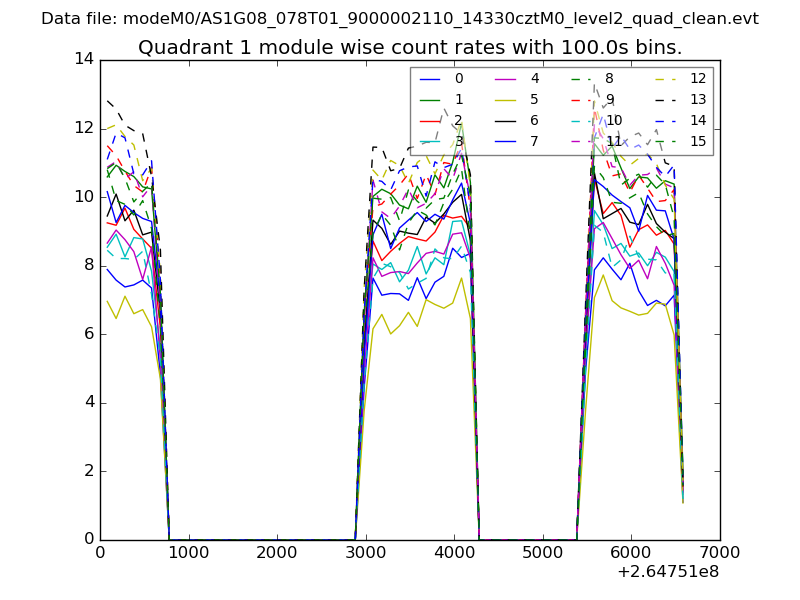 |
 |
| Module-wise count rates for Quadrant C Data is divided into 100 sec bins |
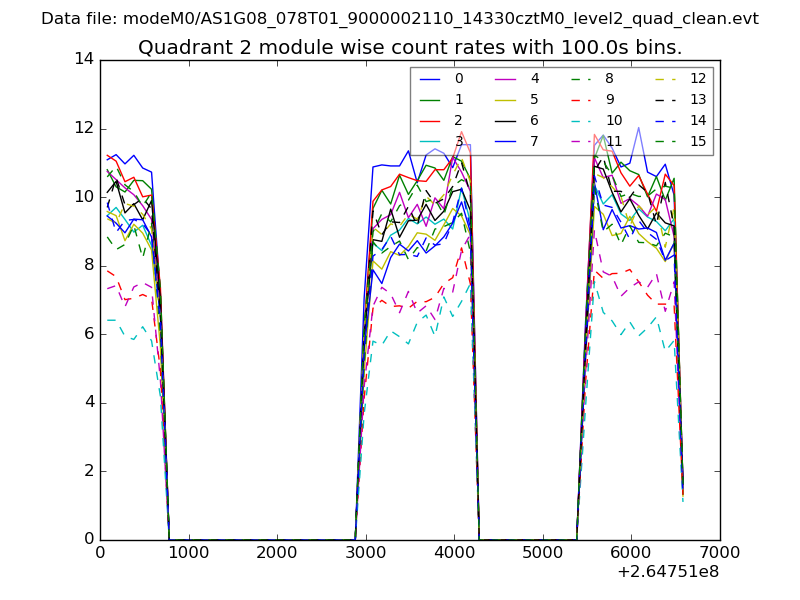 |
 |
| Module-wise count rates for Quadrant D Data is divided into 100 sec bins |
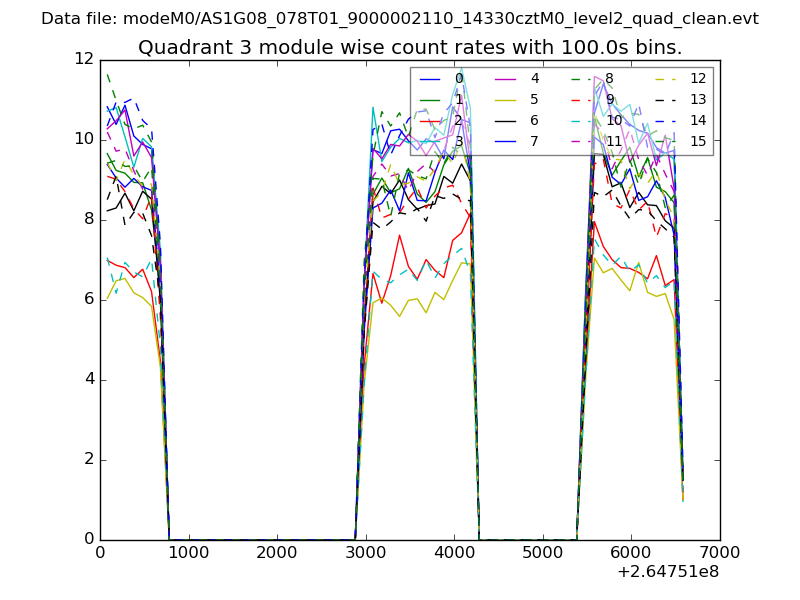 |
 |
| Parameter | Plot |
|---|---|
| CZT HV Monitor | 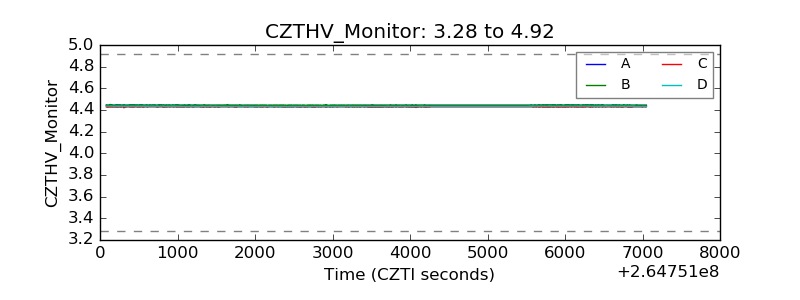 |
| D_VDD | 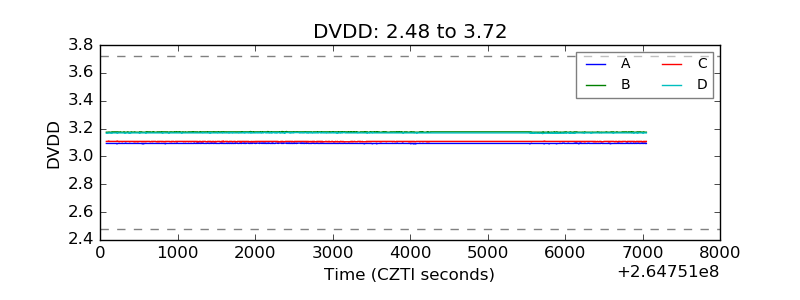 |
| Temperature 1 | 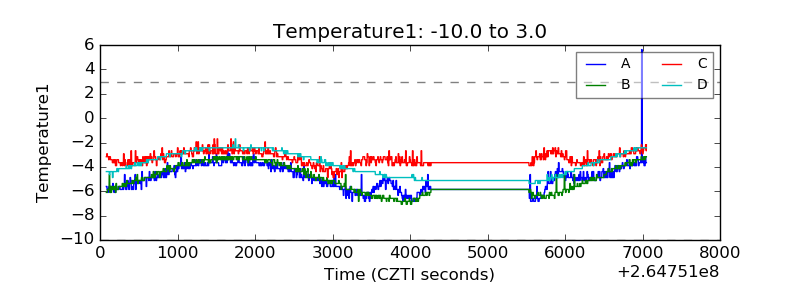 |
| Veto HV Monitor |  |
| Veto LLD | 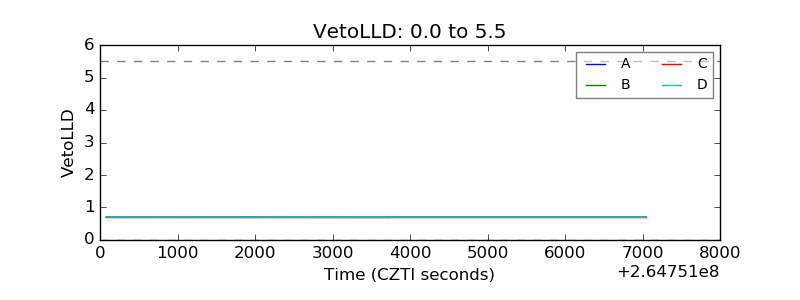 |
| Alpha Counter | 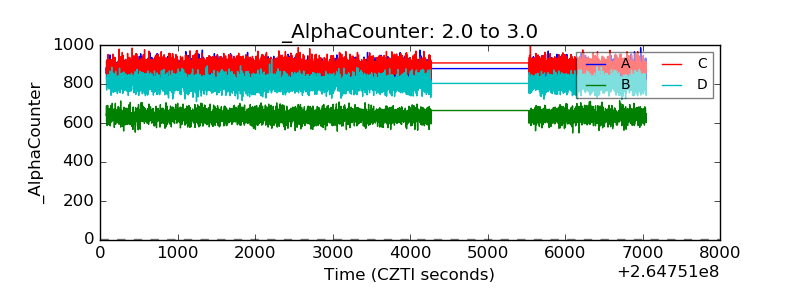 |
| _CPM_Rate | 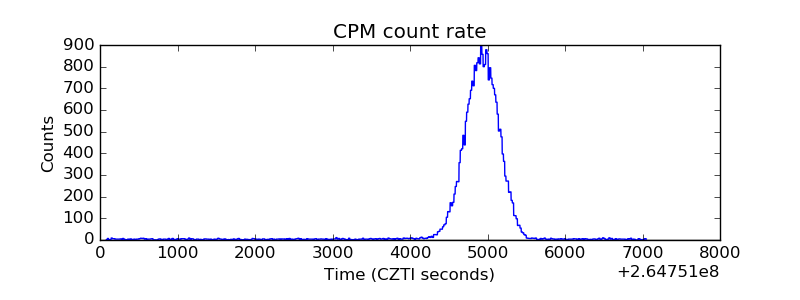 |
| CZT Counter |  |
| +2.5 Volts monitor |  |
| +5 Volts monitor |  |
| _ROLL_ROT | 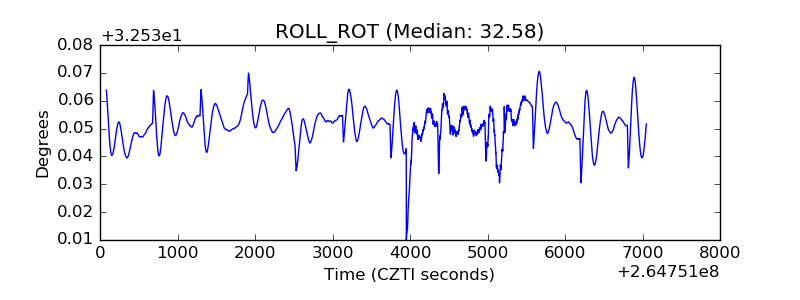 |
| _Roll_DEC | 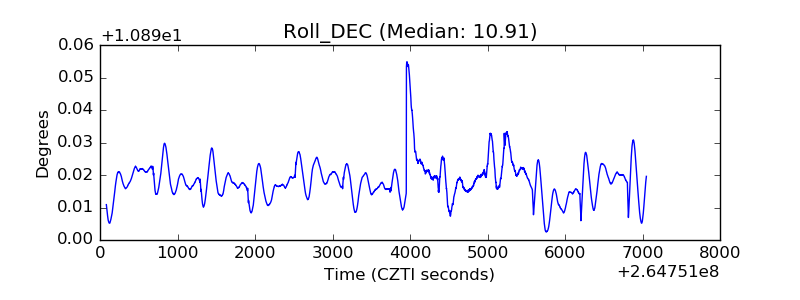 |
| _Roll_RA |  |
| Veto Counter | 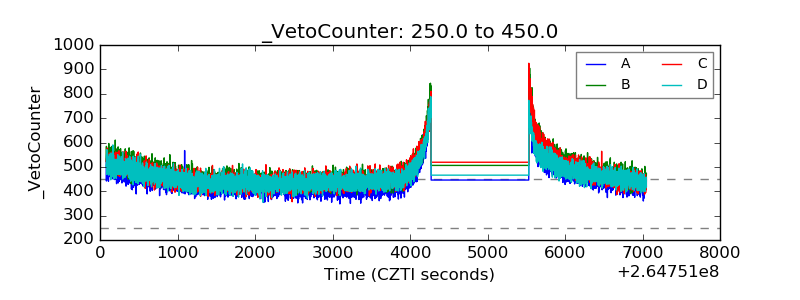 |