| Param | Original file | Final file |
|---|---|---|
| Filename | modeM0/AS1G08_078T01_9000002110_14331cztM0_level2.evt | modeM0/AS1G08_078T01_9000002110_14331cztM0_level2_quad_clean.evt |
| Size (bytes) | 590,918,400 | 81,313,920 |
| Size | 563.5 MB | 77.5 MB |
| Events in quadrant A | 3,377,840 | 519,836 |
| Events in quadrant B | 5,820,312 | 484,774 |
| Events in quadrant C | 3,418,539 | 508,951 |
| Events in quadrant D | 4,830,086 | 486,152 |
| Mode SS | |||
|---|---|---|---|
| Quadrant | BADHDUFLAG | Total packets | Discarded packets |
| A | 0 | 134 | 0 |
| B | 0 | 134 | 0 |
| C | 0 | 134 | 0 |
| D | 0 | 134 | 0 |
| Mode M0 | |||
|---|---|---|---|
| Quadrant | BADHDUFLAG | Total packets | Discarded packets |
| A | 0 | 13931 | 9 |
| B | 0 | 21231 | 4 |
| C | 0 | 13854 | 8 |
| D | 0 | 18703 | 11 |
| Mode M9 | |||
|---|---|---|---|
| Quadrant | BADHDUFLAG | Total packets | Discarded packets |
| A | 0 | 14 | 0 |
| B | 0 | 14 | 0 |
| C | 0 | 14 | 0 |
| D | 0 | 15 | 0 |
| Quadrant | Total seconds | Saturated seconds | Saturation percentage |
|---|---|---|---|
| A | 6631 | 88 | 1.327100% |
| B | 6633 | 1148 | 17.307402% |
| C | 6631 | 41 | 0.618308% |
| D | 6632 | 271 | 4.086248% |
Noise dominated data is calculated using 1-second bins in cleaned event files. If a bin has >2000 counts, and if more than 50% of those come from <1% of pixels, then it is considered to be noise-dominated and hence unusable.
| Quadrant | # 1 sec bins | Bins with >0 counts | Bins with >2000 counts | High rate bins dominated by noise | Noise dominated (total time) | Noise dominated (detector-on time) | Marked lightcurve |
|---|---|---|---|---|---|---|---|
| A | 7740 | 6635 | 0 | 0 | 0.00% | 0.00% | 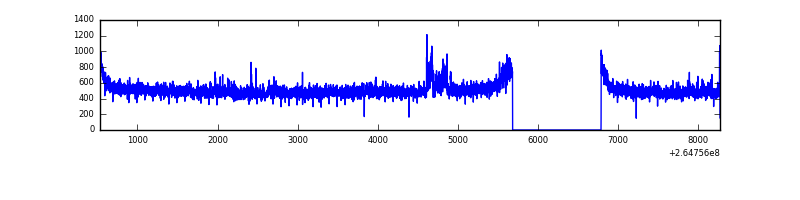 |
| B | 7739 | 6634 | 891 | 891 | 11.51% | 13.43% | 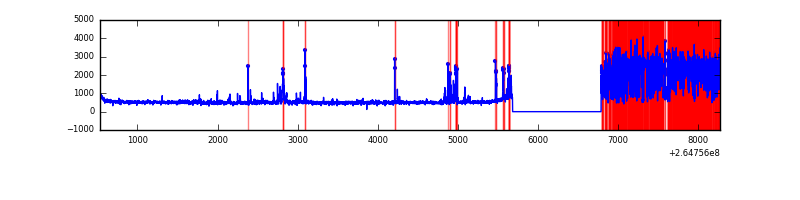 |
| C | 7740 | 6636 | 0 | 0 | 0.00% | 0.00% | 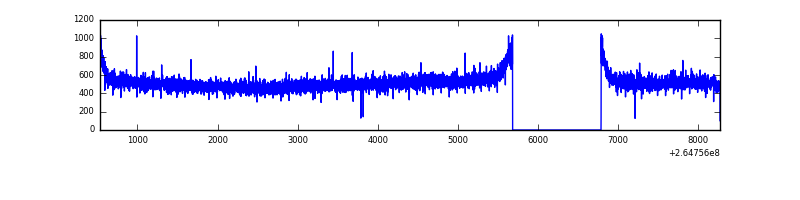 |
| D | 7740 | 6635 | 180 | 180 | 2.33% | 2.71% | 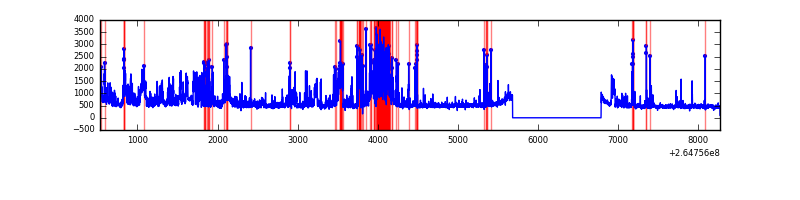 |
Top three noisy pixels from each quadrant. If the there are fewer than three noisy pixels in the level2.evt file, extra rows are filled as -1
| Pixel properties | Quadrant properties | ||||||
|---|---|---|---|---|---|---|---|
| Quadrant | DetID | PixID | Counts | Sigma | Mean | Median | Sigma |
| A | 8 | 15 | 60511 | 348.04 | 850 | 835 | 171.5 |
| A | 12 | 189 | 45717 | 261.76 | 850 | 835 | 171.5 |
| A | 0 | 226 | 7554 | 39.19 | 850 | 835 | 171.5 |
| B | 10 | 245 | 2629088 | 17415.43 | 785 | 769 | 150.9 |
| B | 0 | 219 | 34413 | 222.93 | 785 | 769 | 150.9 |
| B | 0 | 214 | 30429 | 196.53 | 785 | 769 | 150.9 |
| C | 3 | 233 | 255644 | 1354.1 | 811 | 815 | 188.2 |
| C | 13 | 61 | 5860 | 26.81 | 811 | 815 | 188.2 |
| C | 2 | 191 | 2662 | 9.81 | 811 | 815 | 188.2 |
| D | 1 | 52 | 621272 | 3217.04 | 812 | 793 | 192.9 |
| D | 5 | 222 | 368761 | 1907.83 | 812 | 793 | 192.9 |
| D | 12 | 110 | 206728 | 1067.73 | 812 | 793 | 192.9 |
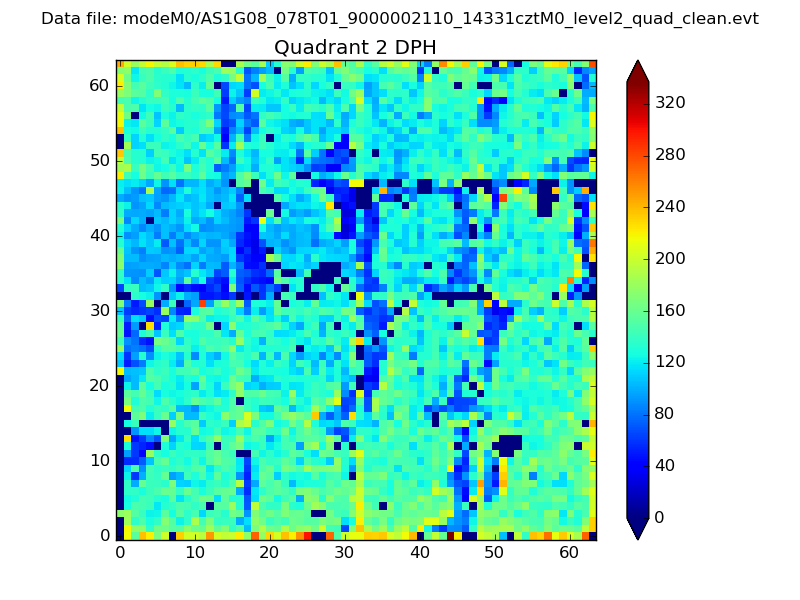
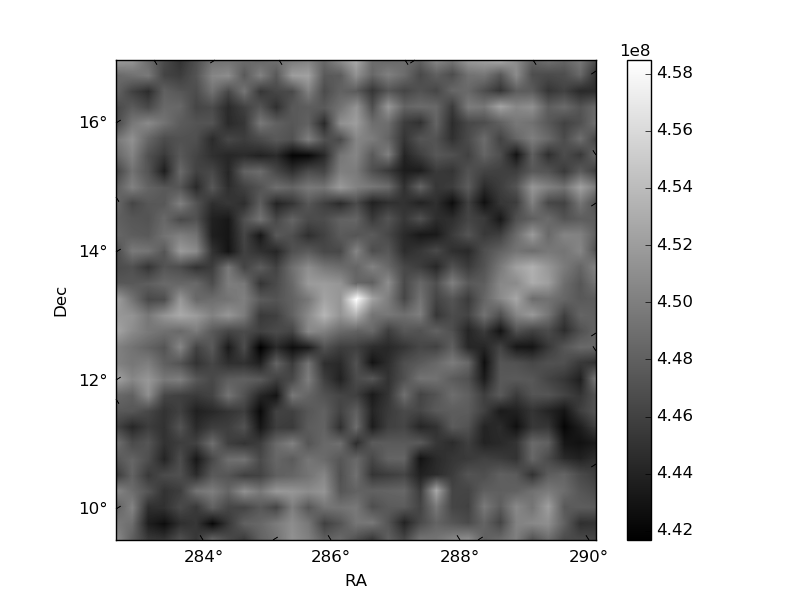
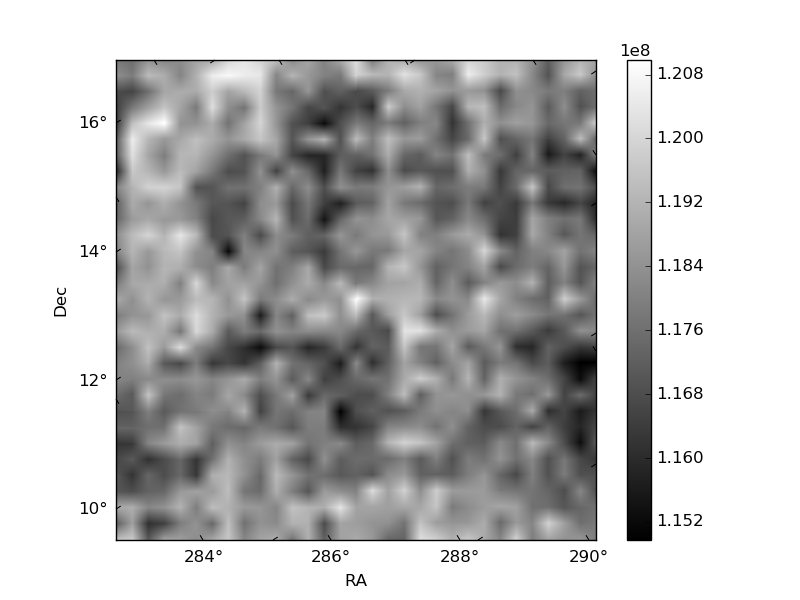
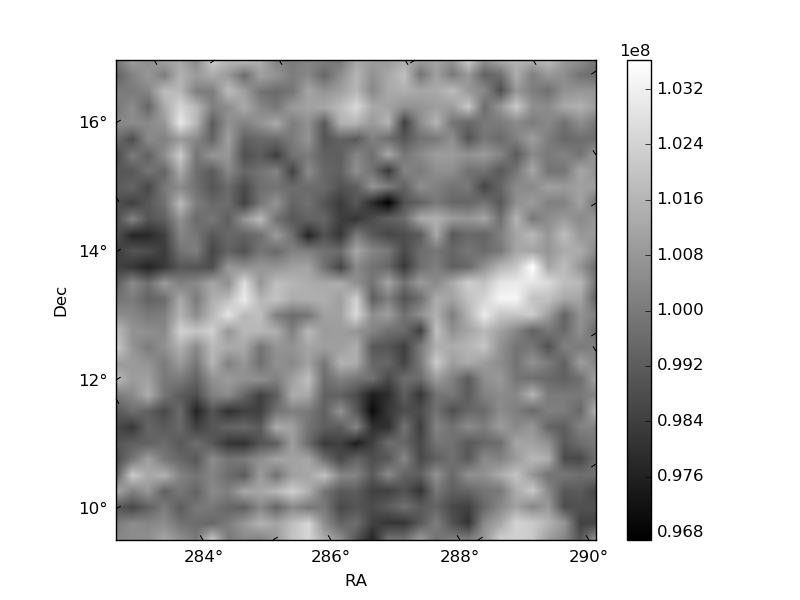
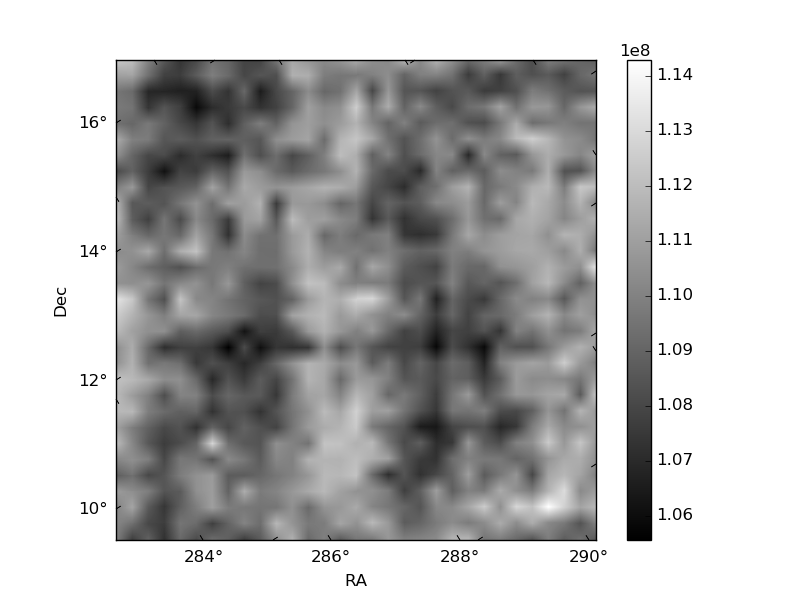
Histogram calculated using DETX and DETY for each event in the final _common_clean file
| Quadrant A | 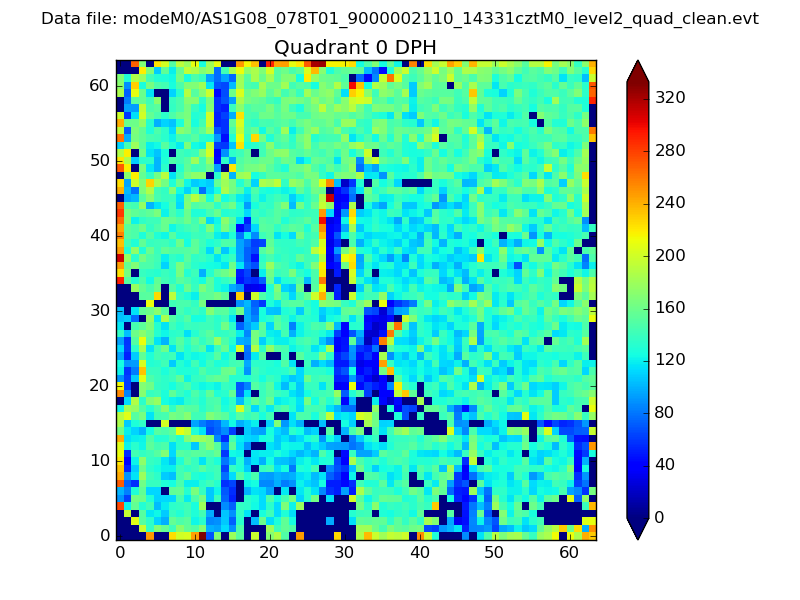 |
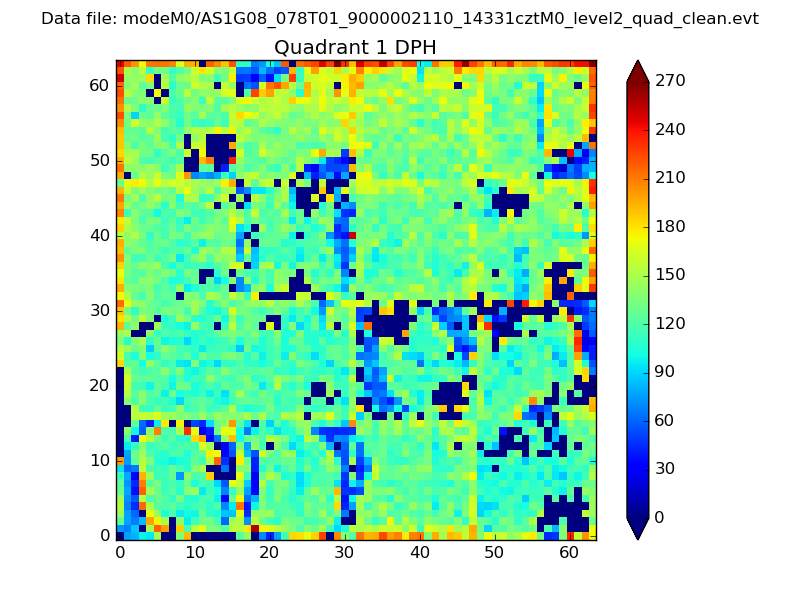 |
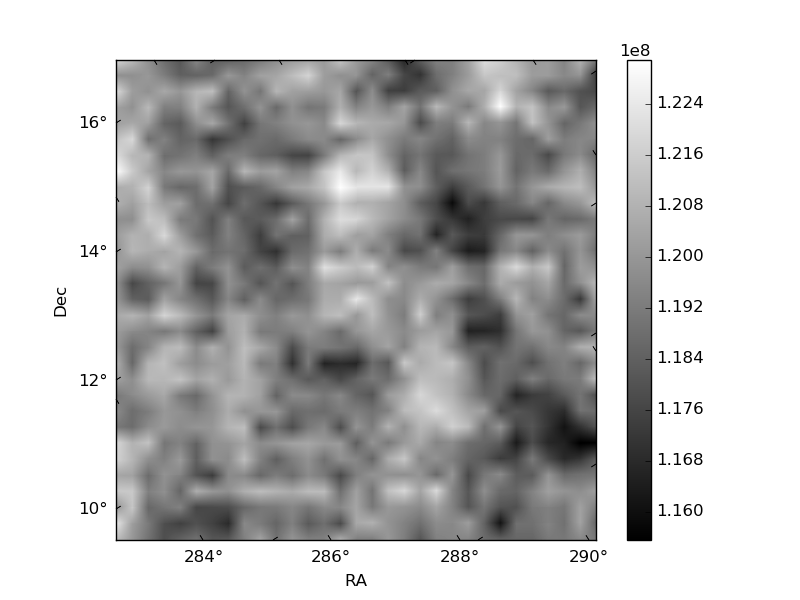
Quadrant B |
|---|---|---|---|
| Quadrant D | 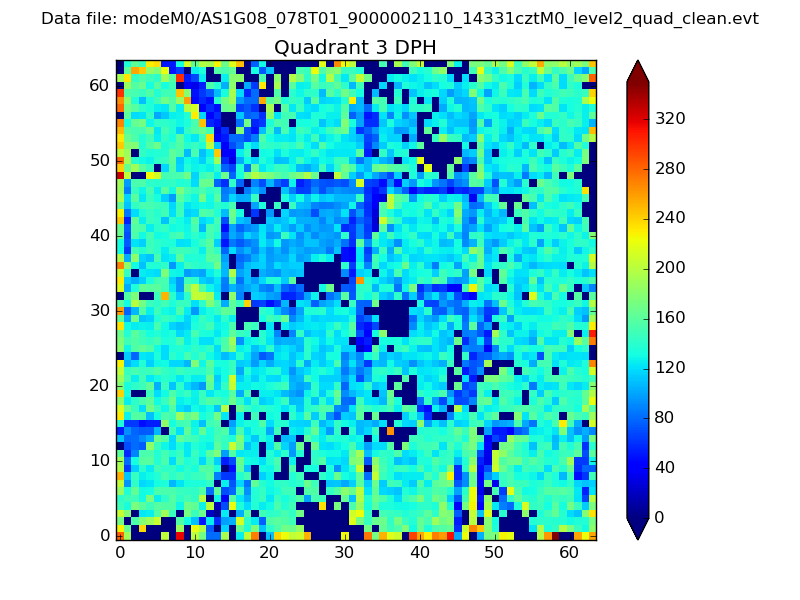 |
 |
Quadrant C |
| Plot type | Count rate plots | Images |
|---|---|---|
| Comparison with Poisson distribution Blue bars denote a histogram of data divided into 1 sec bins. Red curve is a Poisson curve with rate = median count rate of data. |
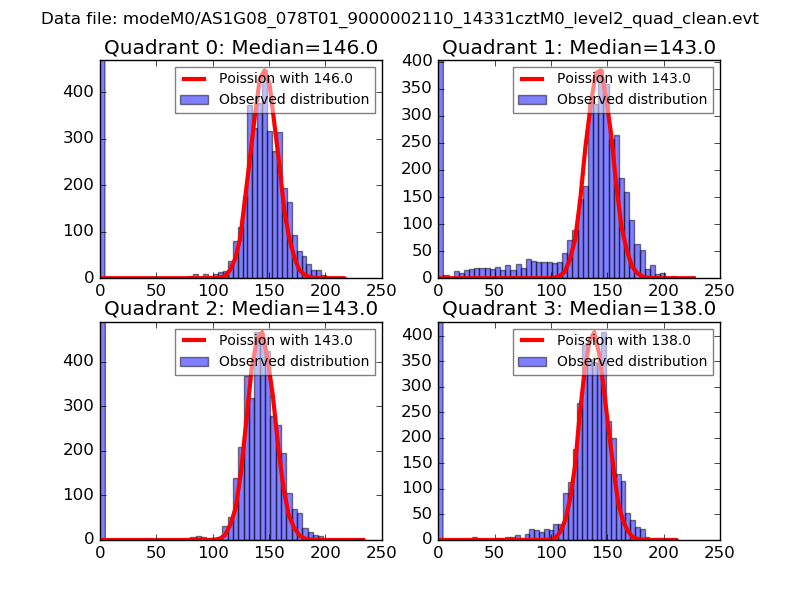 |
 |
| Quadrant-wise count rates Data is divided into 100 sec bins |
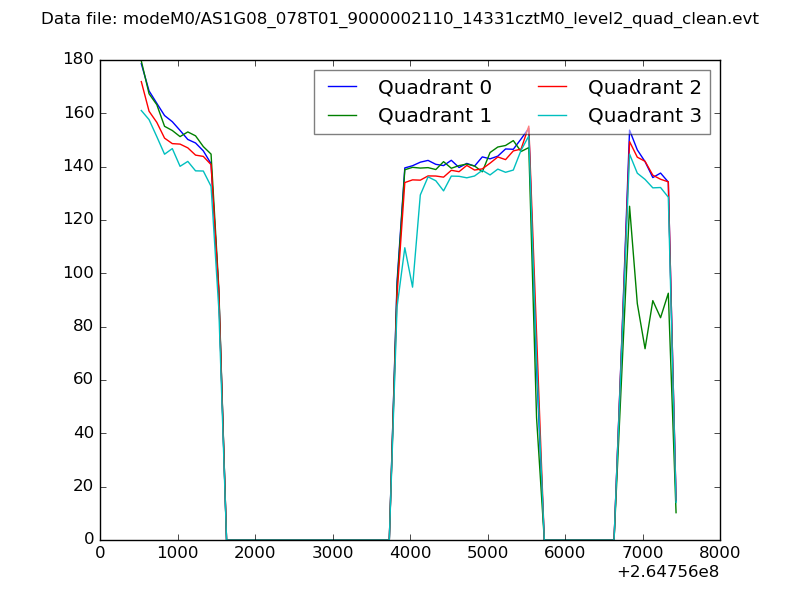 |
|
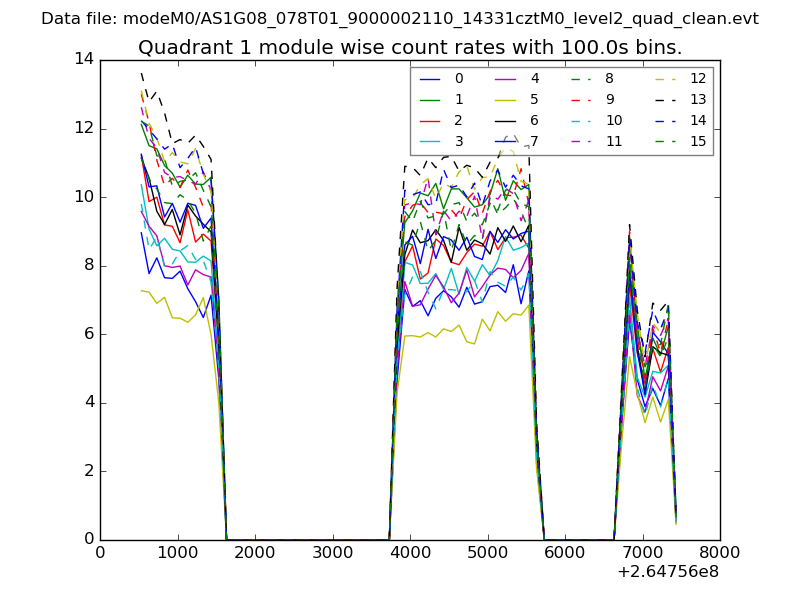
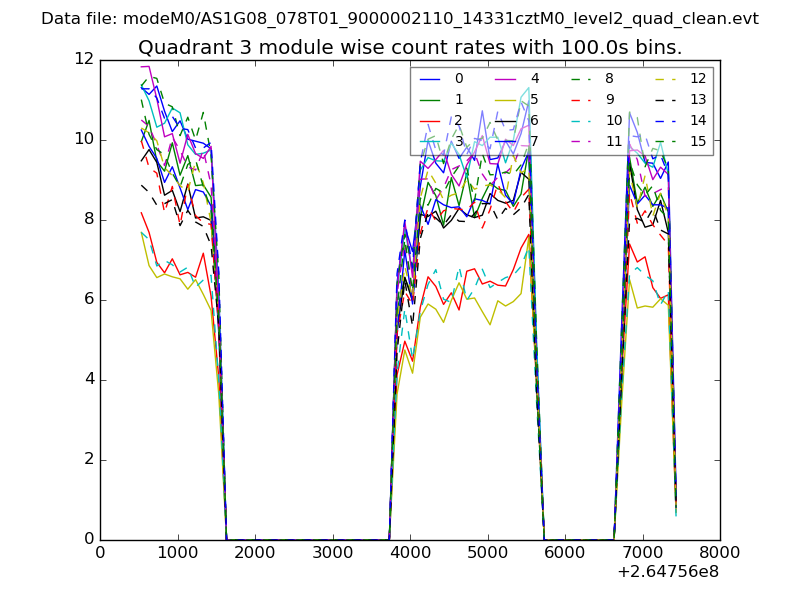
| Module-wise count rates for Quadrant A Data is divided into 100 sec bins |
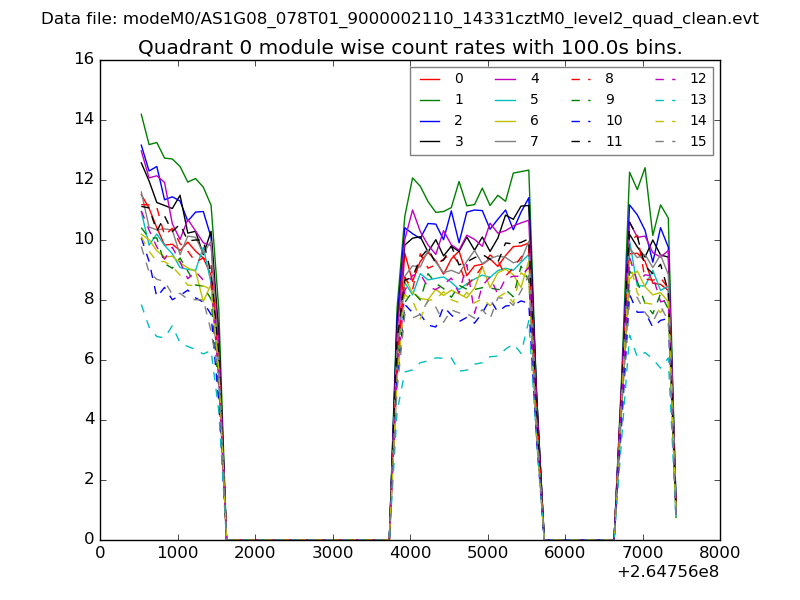 |
 |
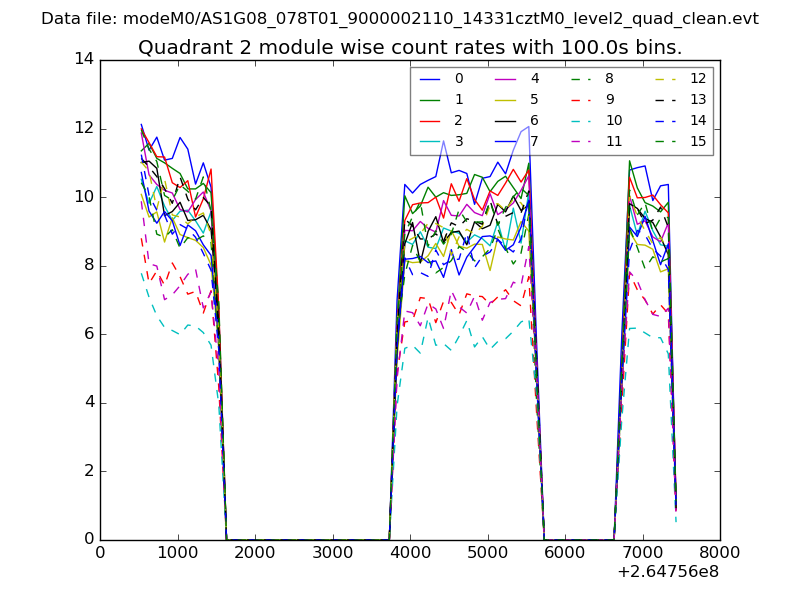
| Module-wise count rates for Quadrant B Data is divided into 100 sec bins |
 |
 |
| Module-wise count rates for Quadrant C Data is divided into 100 sec bins |
 |
 |
| Module-wise count rates for Quadrant D Data is divided into 100 sec bins |
 |
 |
| Parameter | Plot |
|---|---|
| CZT HV Monitor | 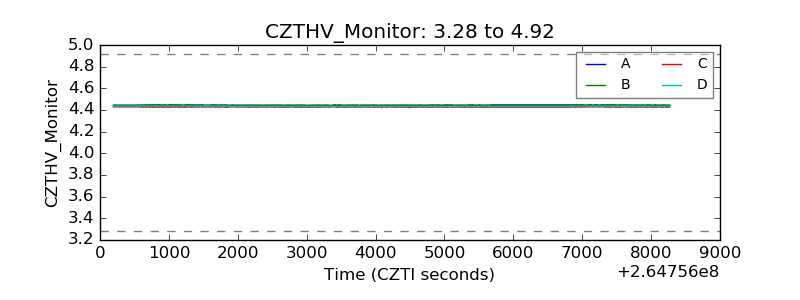 |
| D_VDD | 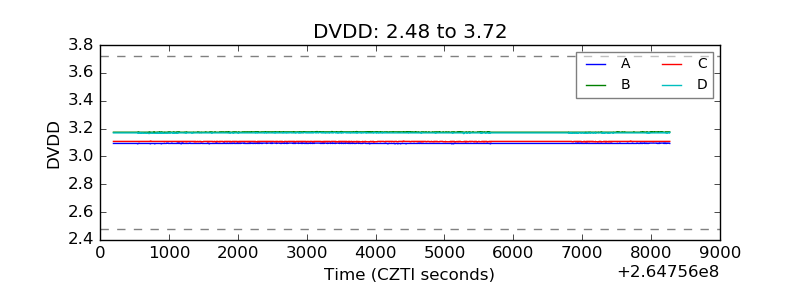 |
| Temperature 1 | 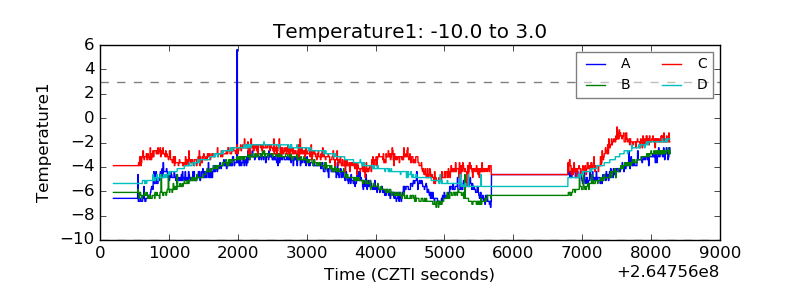 |
| Veto HV Monitor | 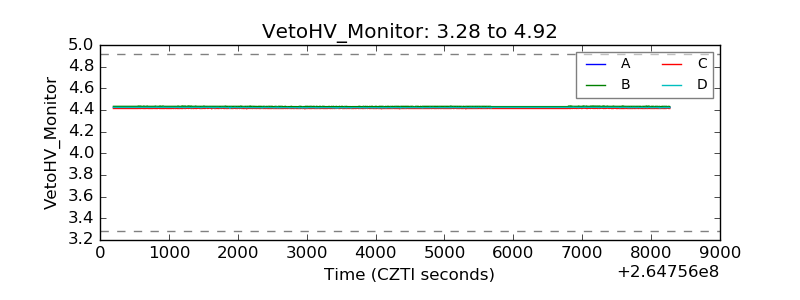 |
| Veto LLD |  |
| Alpha Counter | 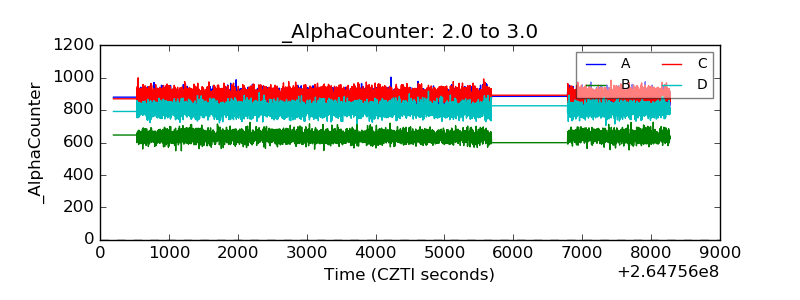 |
| _CPM_Rate | 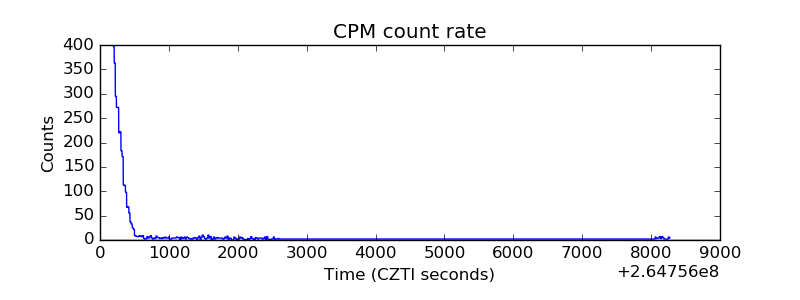 |
| CZT Counter | 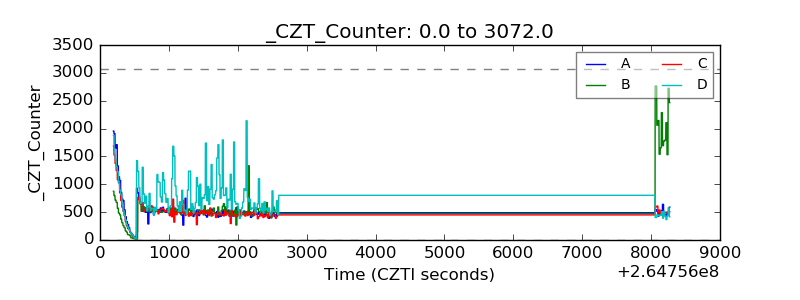 |
| +2.5 Volts monitor |  |
| +5 Volts monitor |  |
| _ROLL_ROT | 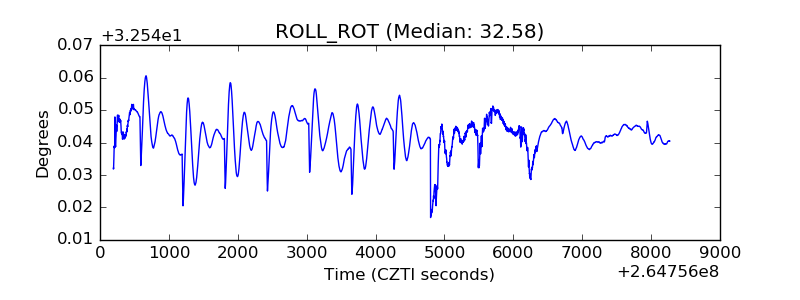 |
| _Roll_DEC | 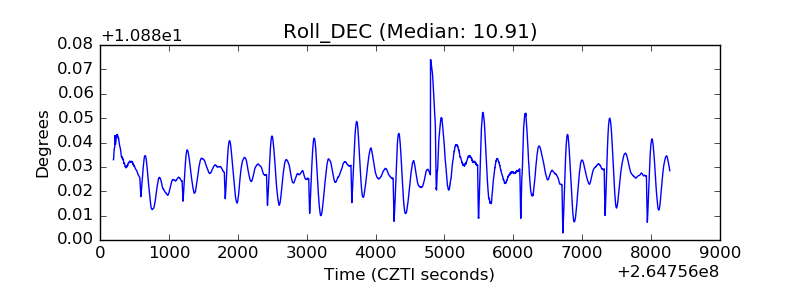 |
| _Roll_RA | 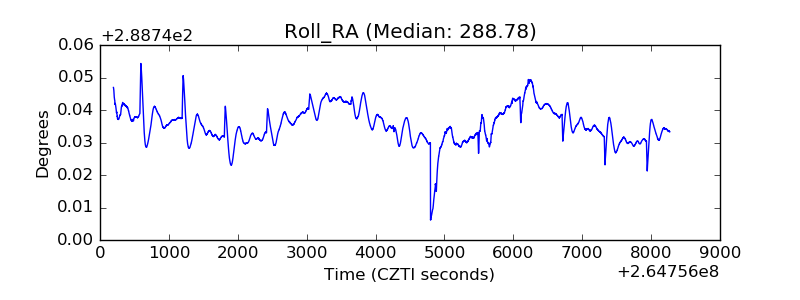 |
| Veto Counter | 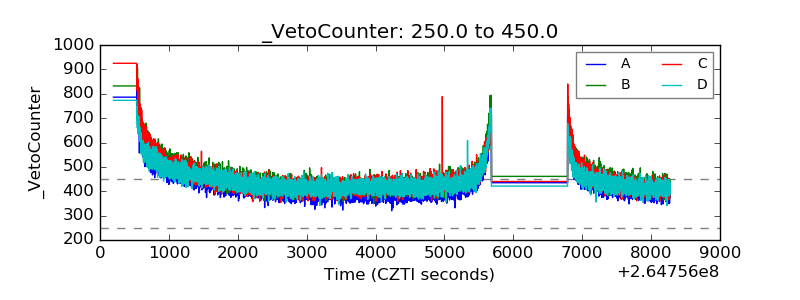 |