| Param | Original file | Final file |
|---|---|---|
| Filename | modeM0/AS1G08_078T01_9000002110_14332cztM0_level2.evt | modeM0/AS1G08_078T01_9000002110_14332cztM0_level2_quad_clean.evt |
| Size (bytes) | 877,322,880 | 71,216,640 |
| Size | 836.7 MB | 67.9 MB |
| Events in quadrant A | 3,609,601 | 479,273 |
| Events in quadrant B | 14,747,611 | 262,453 |
| Events in quadrant C | 3,648,332 | 471,344 |
| Events in quadrant D | 4,094,883 | 458,359 |
| Mode SS | |||
|---|---|---|---|
| Quadrant | BADHDUFLAG | Total packets | Discarded packets |
| A | 0 | 142 | 0 |
| B | 0 | 142 | 0 |
| C | 0 | 142 | 0 |
| D | 0 | 142 | 0 |
| Mode M0 | |||
|---|---|---|---|
| Quadrant | BADHDUFLAG | Total packets | Discarded packets |
| A | 0 | 14946 | 3 |
| B | 0 | 48541 | 2 |
| C | 0 | 14527 | 2 |
| D | 0 | 16678 | 2 |
| Mode M9 | |||
|---|---|---|---|
| Quadrant | BADHDUFLAG | Total packets | Discarded packets |
| A | 0 | 9 | 0 |
| B | 0 | 9 | 0 |
| C | 0 | 9 | 0 |
| D | 0 | 10 | 0 |
| Quadrant | Total seconds | Saturated seconds | Saturation percentage |
|---|---|---|---|
| A | 6937 | 79 | 1.138821% |
| B | 6937 | 5368 | 77.382154% |
| C | 6937 | 51 | 0.735188% |
| D | 6937 | 163 | 2.349719% |
Noise dominated data is calculated using 1-second bins in cleaned event files. If a bin has >2000 counts, and if more than 50% of those come from <1% of pixels, then it is considered to be noise-dominated and hence unusable.
| Quadrant | # 1 sec bins | Bins with >0 counts | Bins with >2000 counts | High rate bins dominated by noise | Noise dominated (total time) | Noise dominated (detector-on time) | Marked lightcurve |
|---|---|---|---|---|---|---|---|
| A | 7713 | 6938 | 0 | 0 | 0.00% | 0.00% | 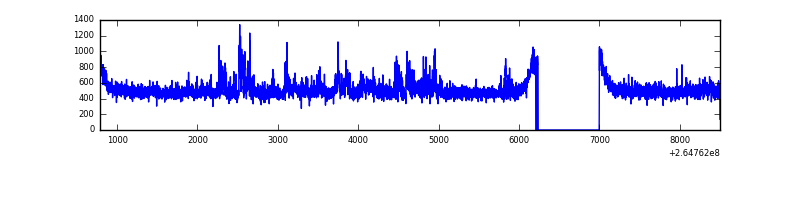 |
| B | 7712 | 6937 | 4650 | 4650 | 60.30% | 67.03% | 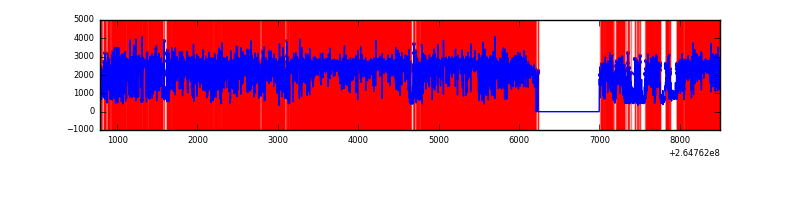 |
| C | 7713 | 6939 | 0 | 0 | 0.00% | 0.00% | 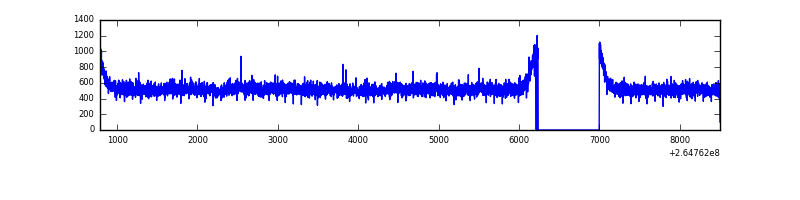 |
| D | 7713 | 6939 | 94 | 94 | 1.22% | 1.35% | 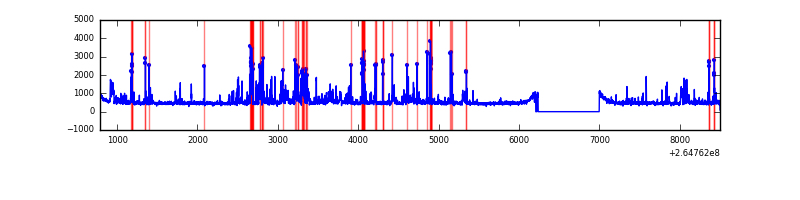 |
Top three noisy pixels from each quadrant. If the there are fewer than three noisy pixels in the level2.evt file, extra rows are filled as -1
| Pixel properties | Quadrant properties | ||||||
|---|---|---|---|---|---|---|---|
| Quadrant | DetID | PixID | Counts | Sigma | Mean | Median | Sigma |
| A | 12 | 189 | 259220 | 1471.28 | 865 | 848 | 175.6 |
| A | 8 | 15 | 23320 | 127.96 | 865 | 848 | 175.6 |
| A | 0 | 226 | 7544 | 38.13 | 865 | 848 | 175.6 |
| B | 10 | 245 | 12503642 | 116983.28 | 554 | 540 | 106.9 |
| B | 0 | 189 | 27971 | 256.65 | 554 | 540 | 106.9 |
| B | 0 | 219 | 19558 | 177.94 | 554 | 540 | 106.9 |
| C | 3 | 233 | 409290 | 2118.75 | 830 | 834 | 192.8 |
| C | 13 | 61 | 5922 | 26.39 | 830 | 834 | 192.8 |
| C | 10 | 22 | 3874 | 15.77 | 830 | 834 | 192.8 |
| D | 5 | 222 | 200461 | 1011.18 | 830 | 812 | 197.4 |
| D | 13 | 122 | 188915 | 952.7 | 830 | 812 | 197.4 |
| D | 2 | 120 | 166352 | 838.42 | 830 | 812 | 197.4 |
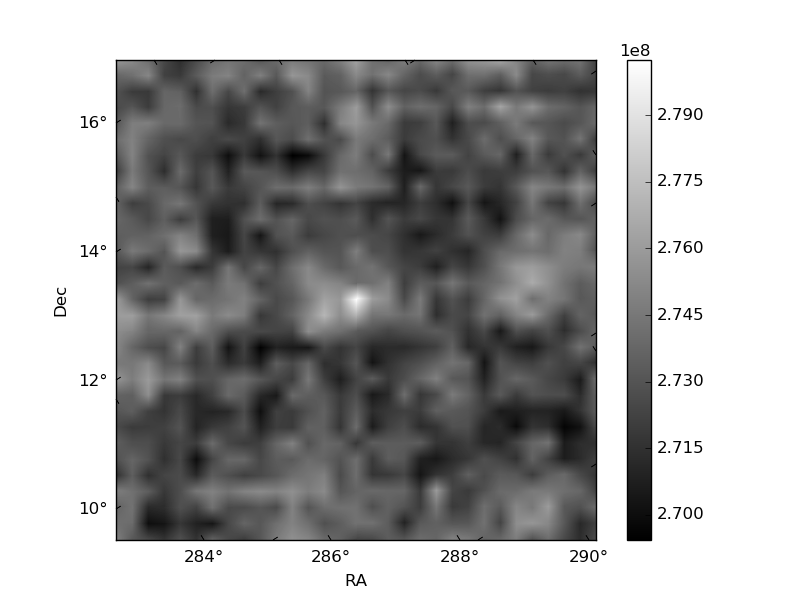
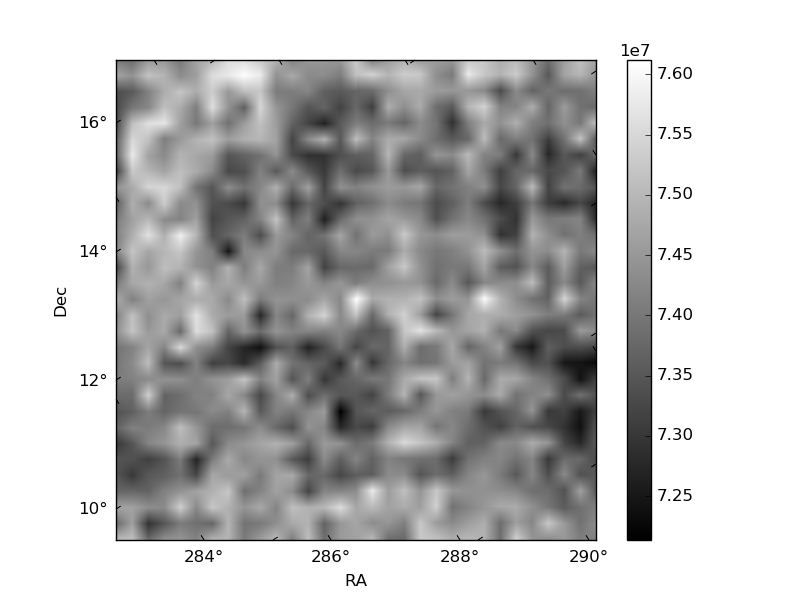
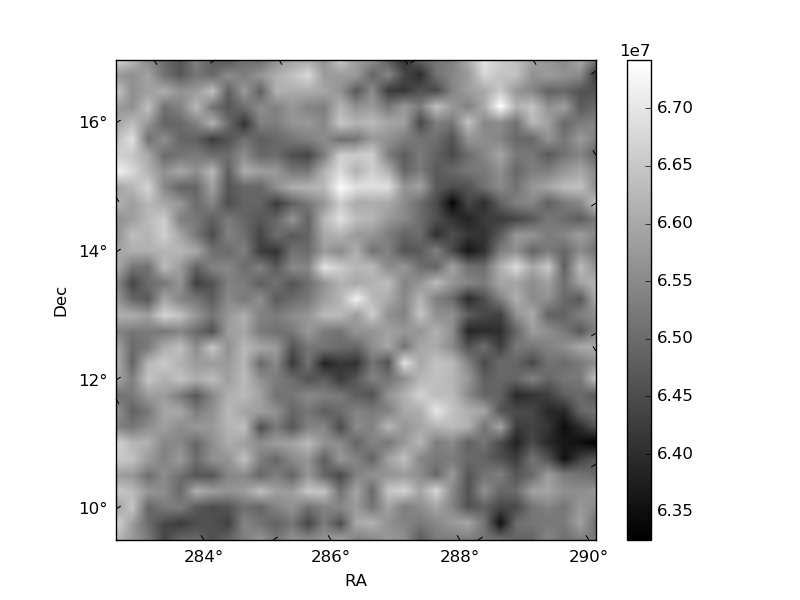
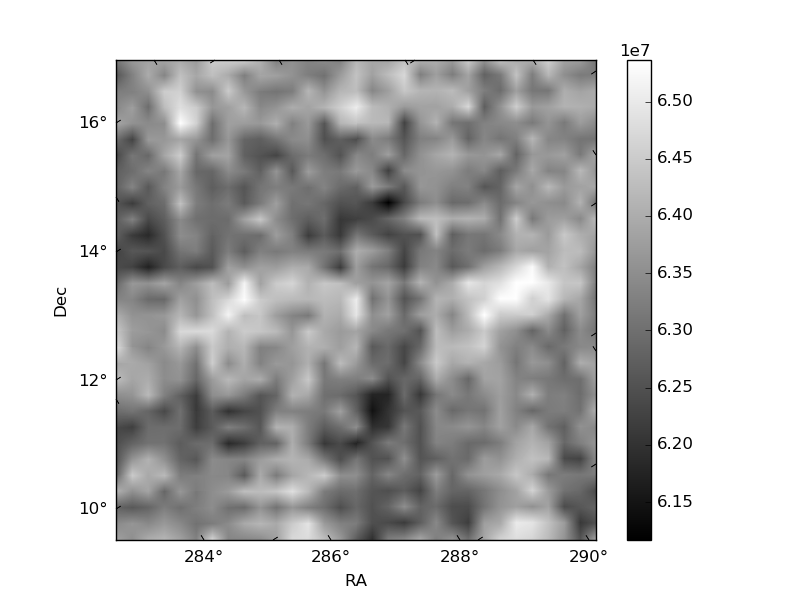
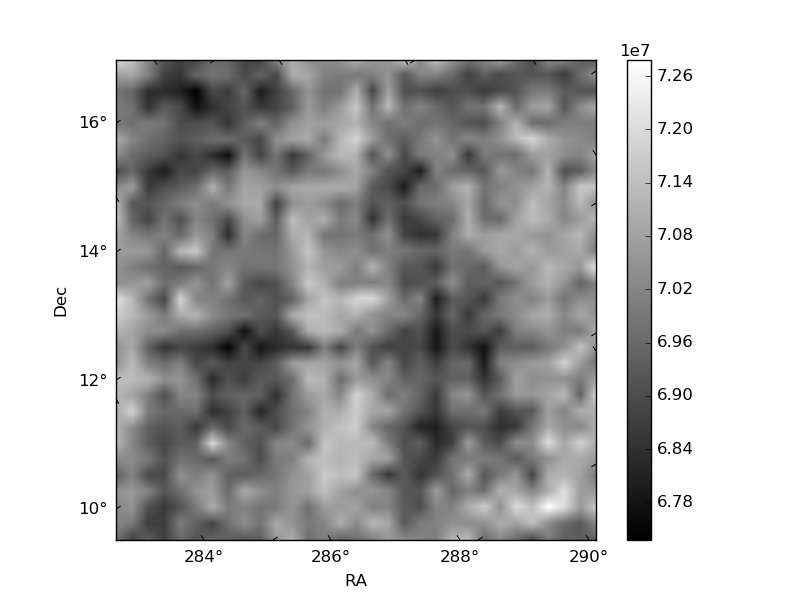
Histogram calculated using DETX and DETY for each event in the final _common_clean file
| Quadrant A | 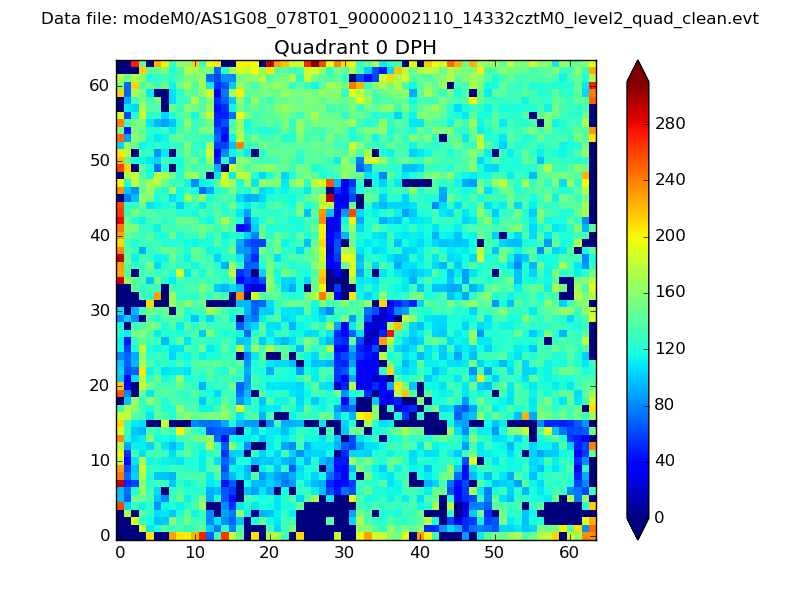 |
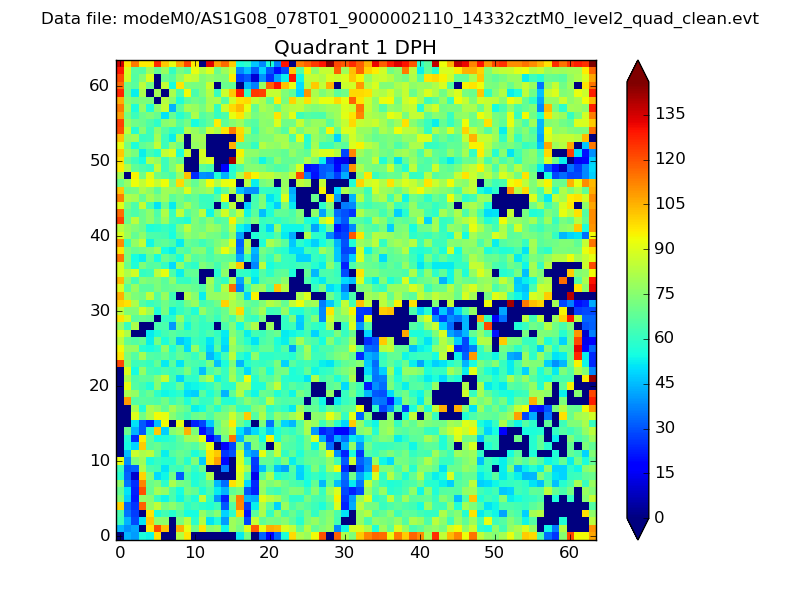 |
Quadrant B |
|---|---|---|---|
| Quadrant D | 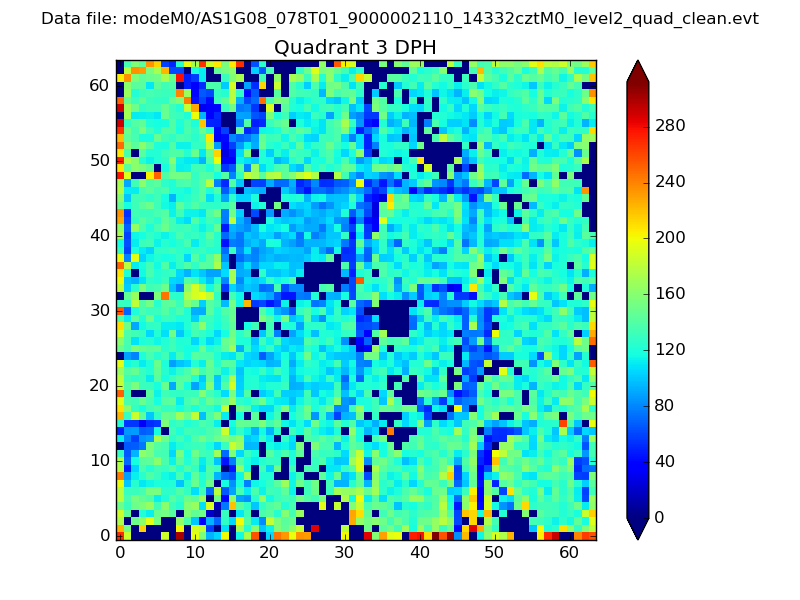 |
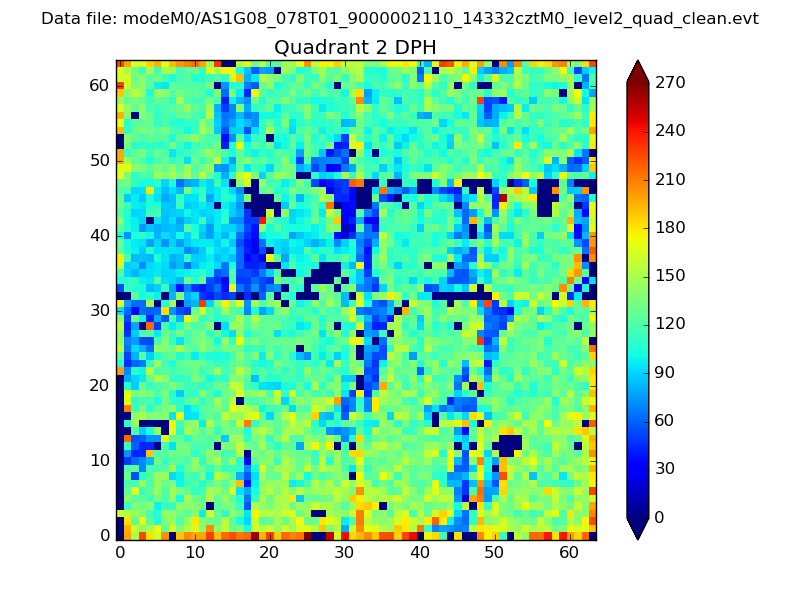 |
Quadrant C |
| Plot type | Count rate plots | Images |
|---|---|---|
| Comparison with Poisson distribution Blue bars denote a histogram of data divided into 1 sec bins. Red curve is a Poisson curve with rate = median count rate of data. |
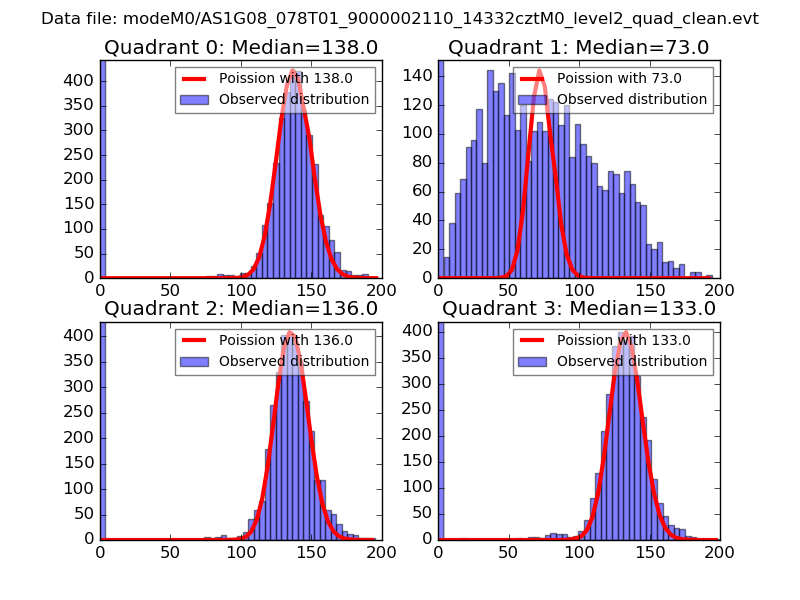 |
 |
| Quadrant-wise count rates Data is divided into 100 sec bins |
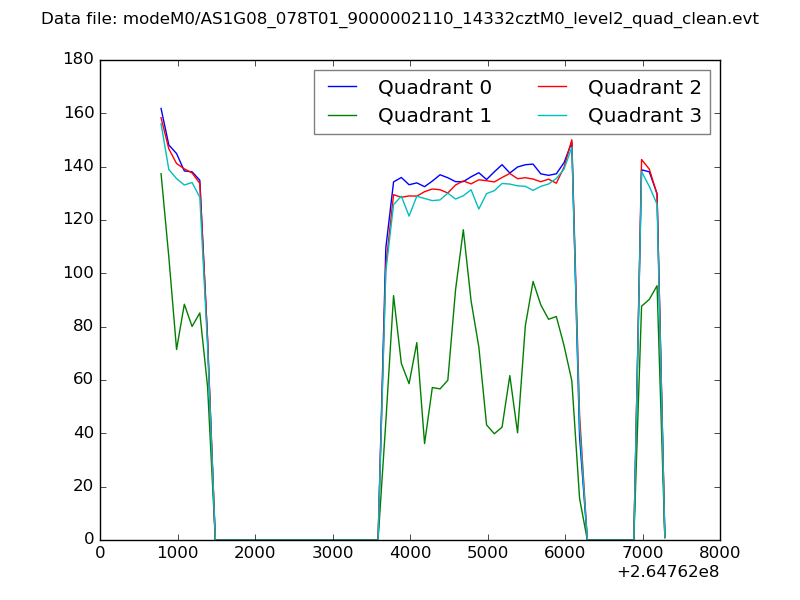 |
|
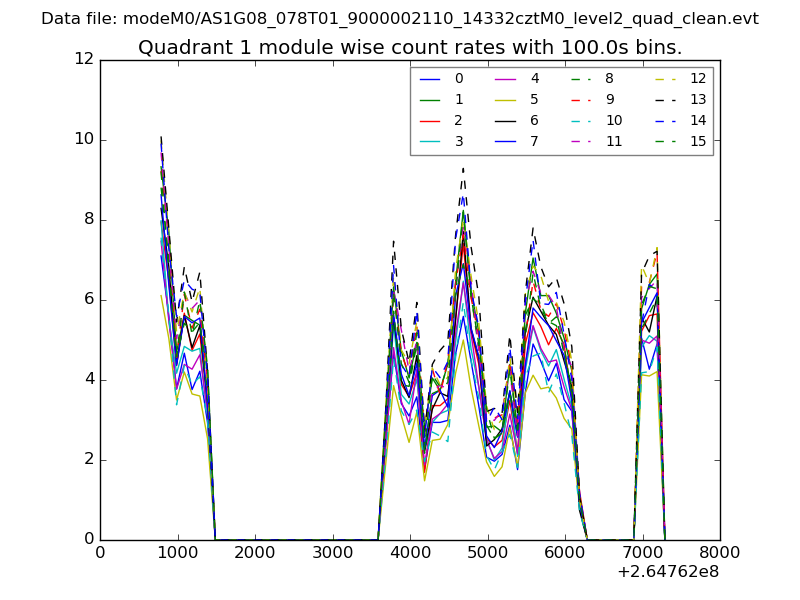
| Module-wise count rates for Quadrant A Data is divided into 100 sec bins |
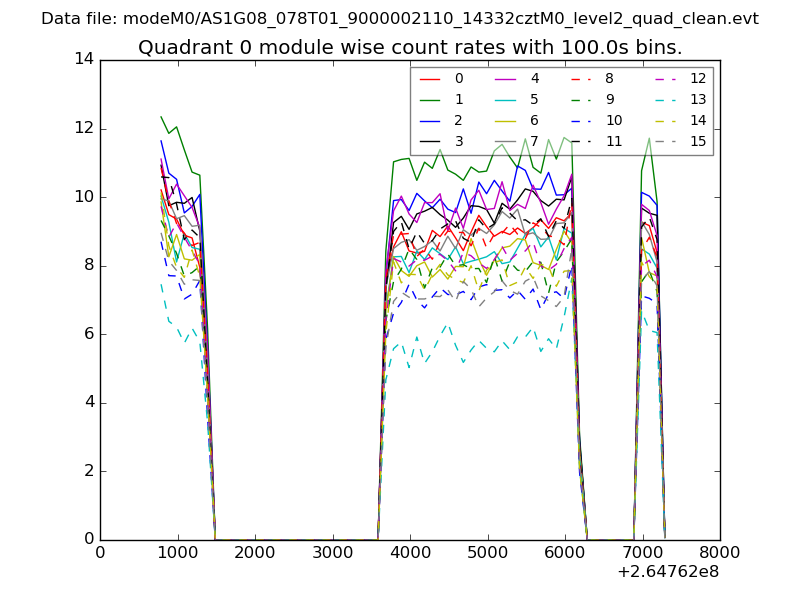 |
 |
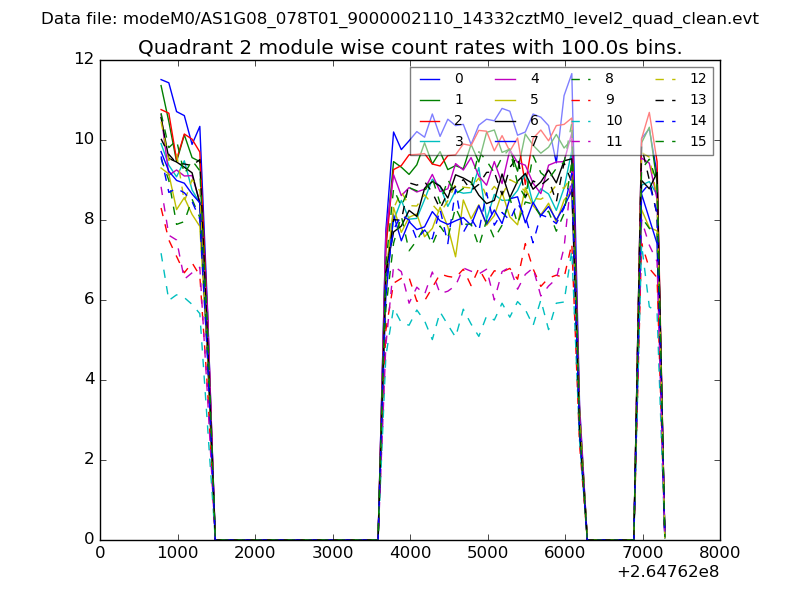
| Module-wise count rates for Quadrant B Data is divided into 100 sec bins |
 |
 |
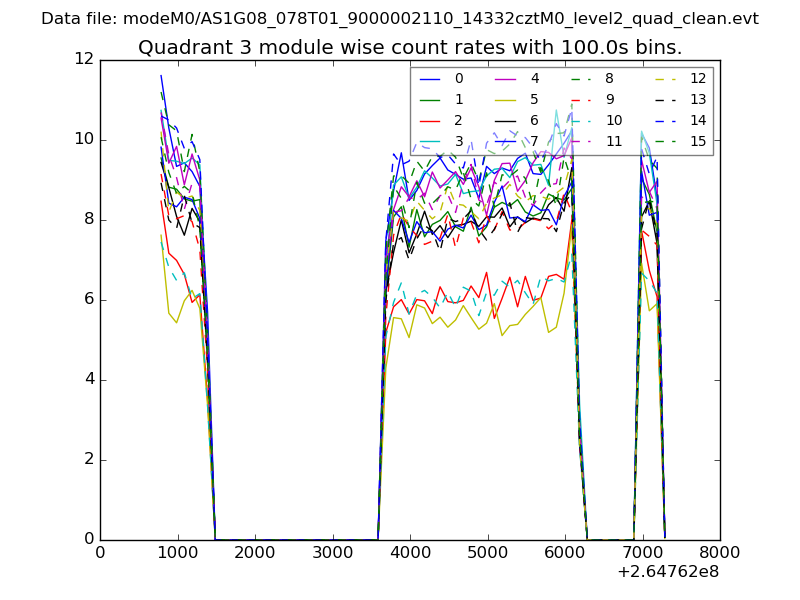
| Module-wise count rates for Quadrant C Data is divided into 100 sec bins |
 |
 |
| Module-wise count rates for Quadrant D Data is divided into 100 sec bins |
 |
 |
| Parameter | Plot |
|---|---|
| CZT HV Monitor | 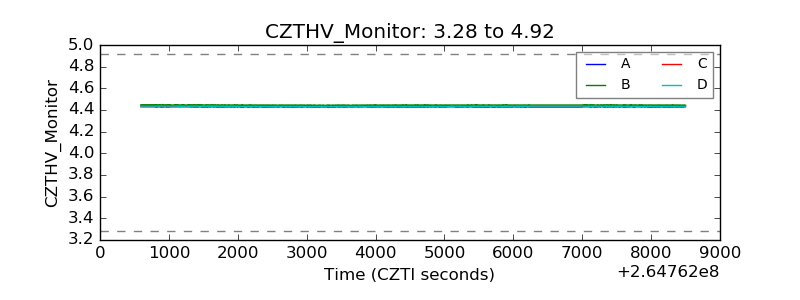 |
| D_VDD | 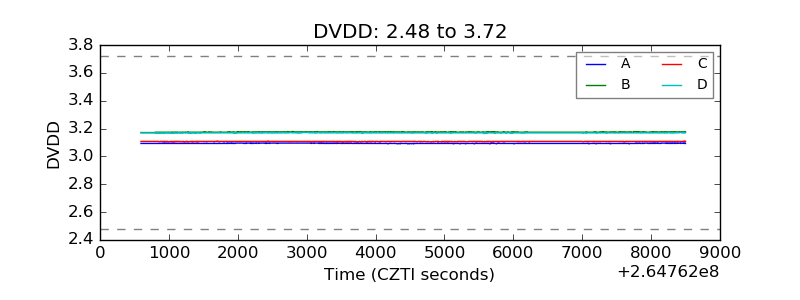 |
| Temperature 1 | 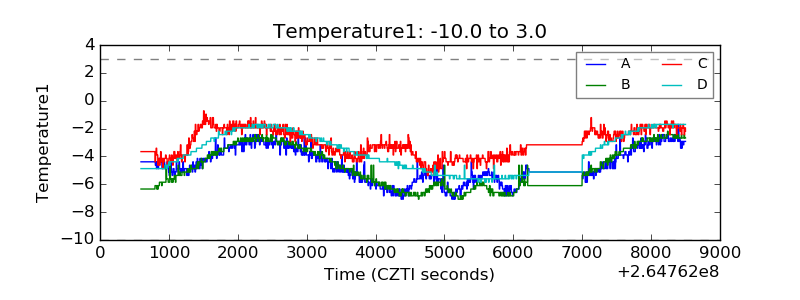 |
| Veto HV Monitor | 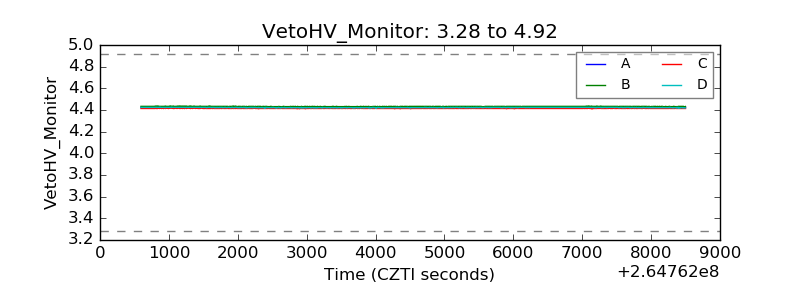 |
| Veto LLD | 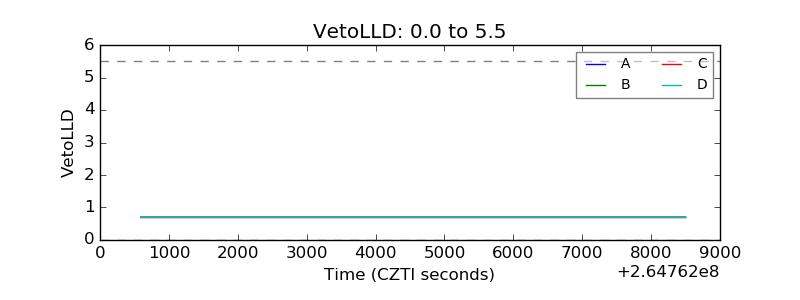 |
| Alpha Counter | 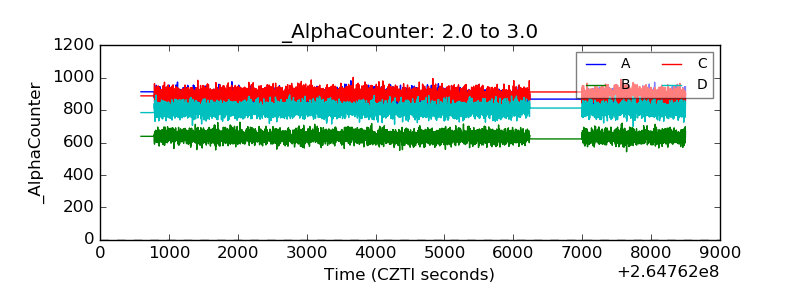 |
| _CPM_Rate | 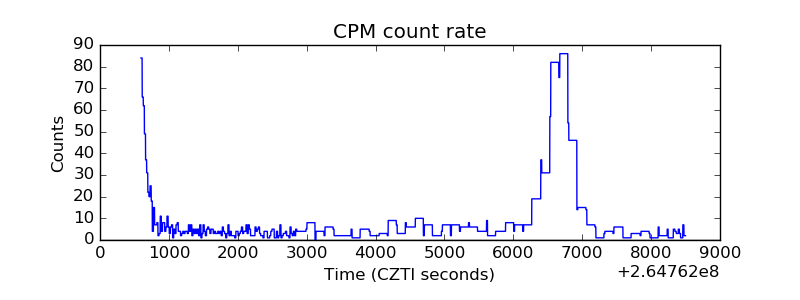 |
| CZT Counter | 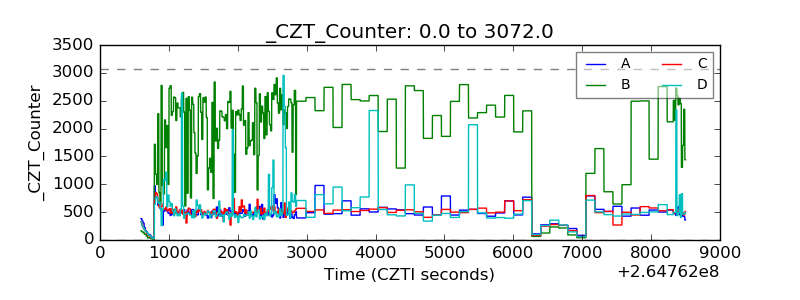 |
| +2.5 Volts monitor |  |
| +5 Volts monitor |  |
| _ROLL_ROT | 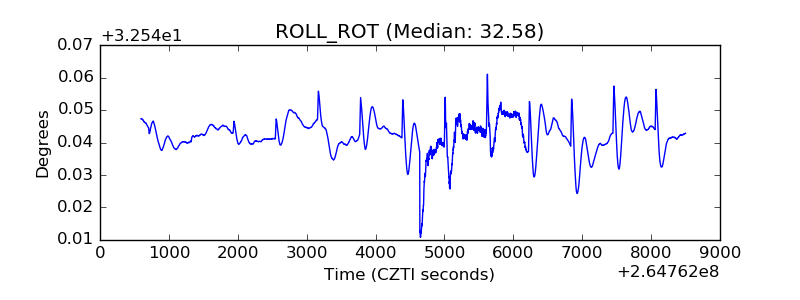 |
| _Roll_DEC | 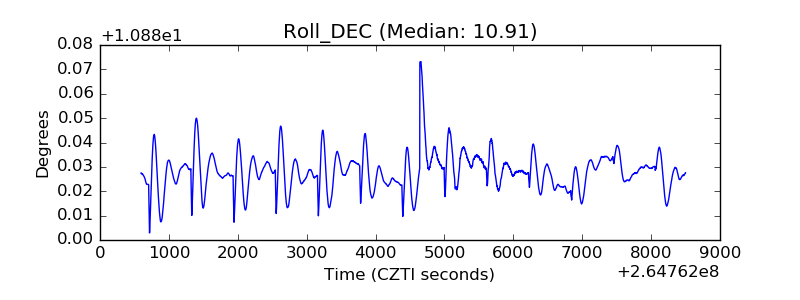 |
| _Roll_RA | 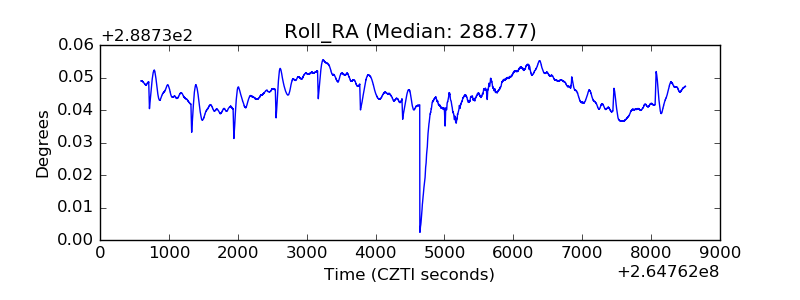 |
| Veto Counter |  |