| Param | Original file | Final file |
|---|---|---|
| Filename | modeM0/AS1G08_078T01_9000002110_14333cztM0_level2.evt | modeM0/AS1G08_078T01_9000002110_14333cztM0_level2_quad_clean.evt |
| Size (bytes) | 735,128,640 | 77,512,320 |
| Size | 701.1 MB | 73.9 MB |
| Events in quadrant A | 3,751,653 | 483,310 |
| Events in quadrant B | 8,699,716 | 440,303 |
| Events in quadrant C | 3,748,082 | 471,190 |
| Events in quadrant D | 5,574,388 | 447,715 |
| Mode SS | |||
|---|---|---|---|
| Quadrant | BADHDUFLAG | Total packets | Discarded packets |
| A | 0 | 148 | 0 |
| B | 0 | 148 | 0 |
| C | 0 | 148 | 0 |
| D | 0 | 148 | 0 |
| Mode M0 | |||
|---|---|---|---|
| Quadrant | BADHDUFLAG | Total packets | Discarded packets |
| A | 0 | 15595 | 4 |
| B | 0 | 30694 | 3 |
| C | 0 | 15171 | 3 |
| D | 0 | 21546 | 3 |
| Mode M9 | |||
|---|---|---|---|
| Quadrant | BADHDUFLAG | Total packets | Discarded packets |
| A | 0 | 3 | 0 |
| B | 0 | 3 | 0 |
| C | 0 | 3 | 0 |
| D | 0 | 4 | 0 |
| Quadrant | Total seconds | Saturated seconds | Saturation percentage |
|---|---|---|---|
| A | 7233 | 120 | 1.659063% |
| B | 7233 | 2105 | 29.102724% |
| C | 7233 | 107 | 1.479331% |
| D | 7233 | 618 | 8.544173% |
Noise dominated data is calculated using 1-second bins in cleaned event files. If a bin has >2000 counts, and if more than 50% of those come from <1% of pixels, then it is considered to be noise-dominated and hence unusable.
| Quadrant | # 1 sec bins | Bins with >0 counts | Bins with >2000 counts | High rate bins dominated by noise | Noise dominated (total time) | Noise dominated (detector-on time) | Marked lightcurve |
|---|---|---|---|---|---|---|---|
| A | 7609 | 7234 | 0 | 0 | 0.00% | 0.00% | 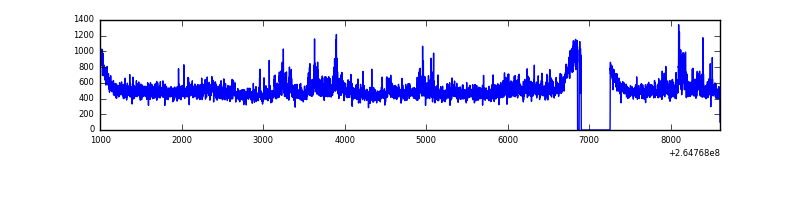 |
| B | 7609 | 7234 | 1642 | 1642 | 21.58% | 22.70% | 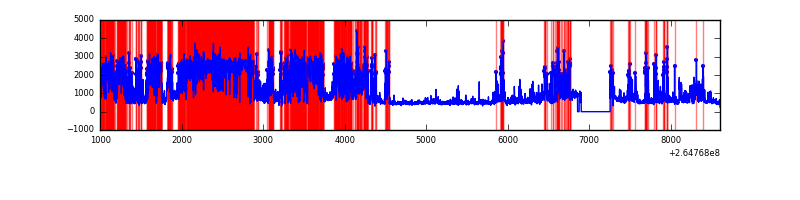 |
| C | 7609 | 7235 | 0 | 0 | 0.00% | 0.00% | 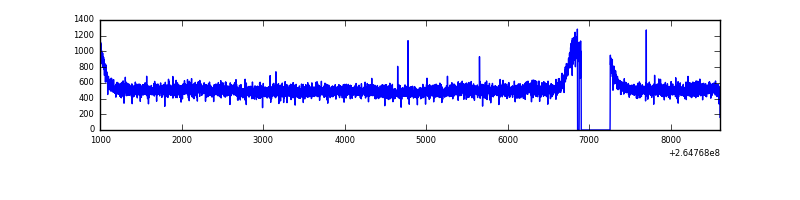 |
| D | 7609 | 7234 | 196 | 196 | 2.58% | 2.71% | 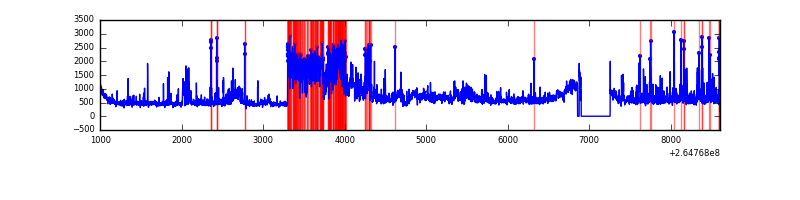 |
Top three noisy pixels from each quadrant. If the there are fewer than three noisy pixels in the level2.evt file, extra rows are filled as -1
| Pixel properties | Quadrant properties | ||||||
|---|---|---|---|---|---|---|---|
| Quadrant | DetID | PixID | Counts | Sigma | Mean | Median | Sigma |
| A | 8 | 15 | 148403 | 804.02 | 899 | 880 | 183.5 |
| A | 12 | 189 | 139871 | 757.52 | 899 | 880 | 183.5 |
| A | 0 | 226 | 7801 | 37.72 | 899 | 880 | 183.5 |
| B | 10 | 245 | 5264807 | 34025.19 | 790 | 769 | 154.7 |
| B | 10 | 16 | 214053 | 1378.6 | 790 | 769 | 154.7 |
| B | 0 | 189 | 59924 | 382.36 | 790 | 769 | 154.7 |
| C | 3 | 233 | 380228 | 1875.17 | 864 | 869 | 202.3 |
| C | 13 | 61 | 6098 | 25.85 | 864 | 869 | 202.3 |
| C | 14 | 234 | 3023 | 10.65 | 864 | 869 | 202.3 |
| D | 13 | 122 | 1632391 | 8021.18 | 847 | 828 | 203.4 |
| D | 5 | 222 | 319931 | 1568.79 | 847 | 828 | 203.4 |
| D | 2 | 120 | 140657 | 687.43 | 847 | 828 | 203.4 |
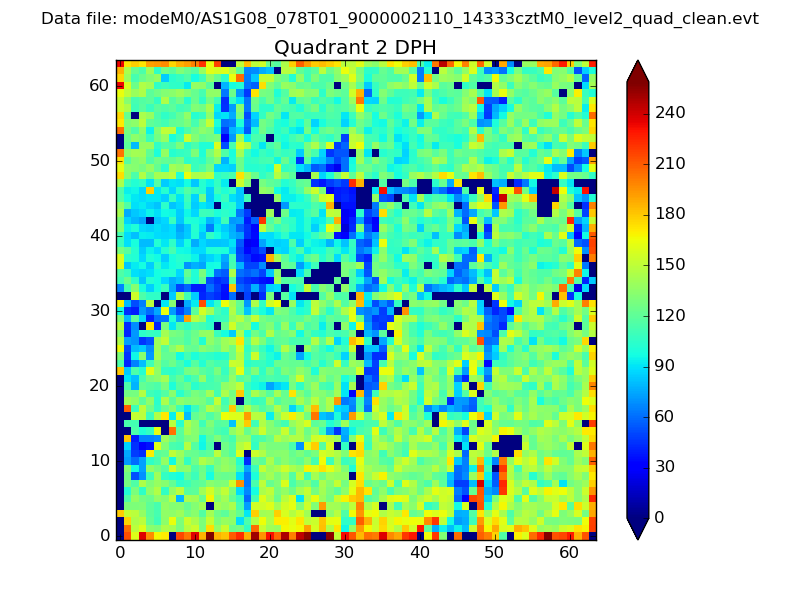
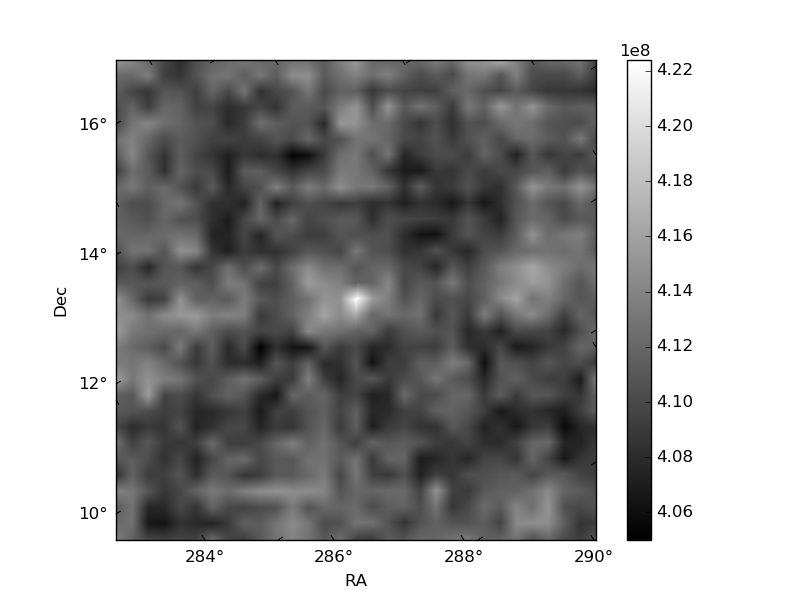
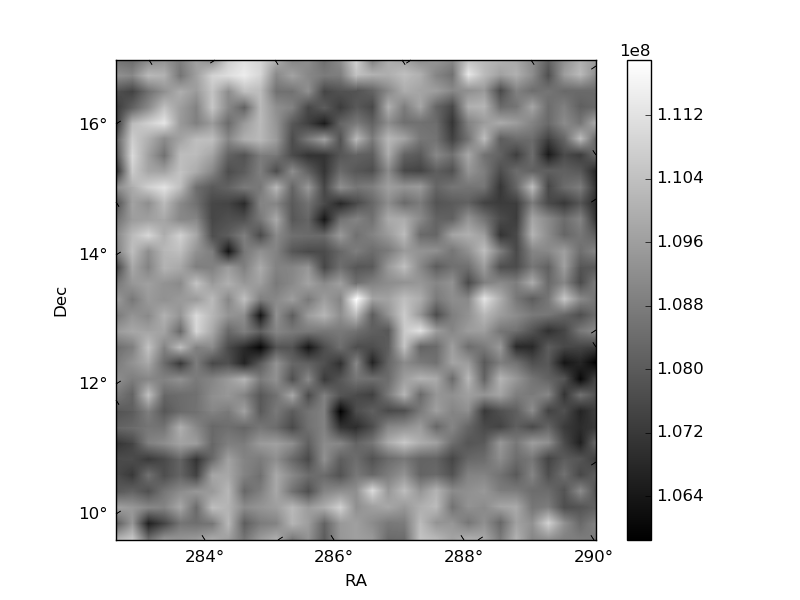
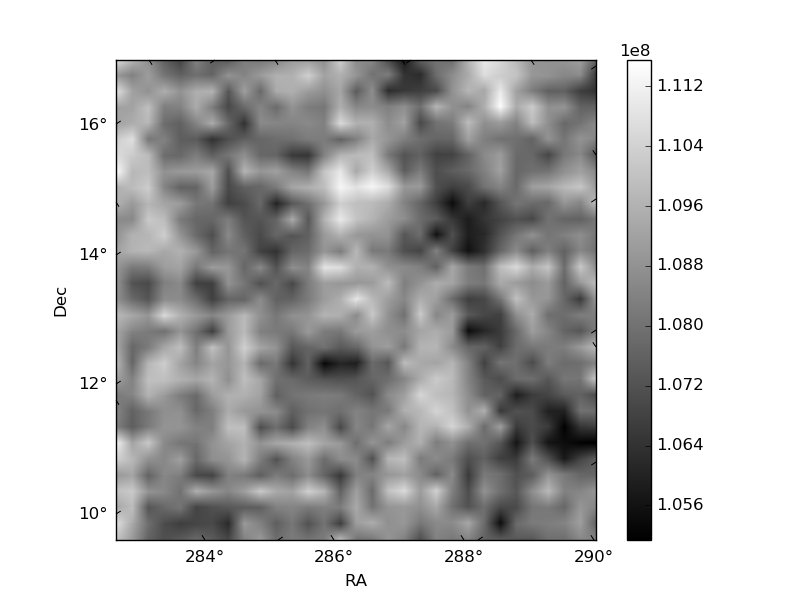
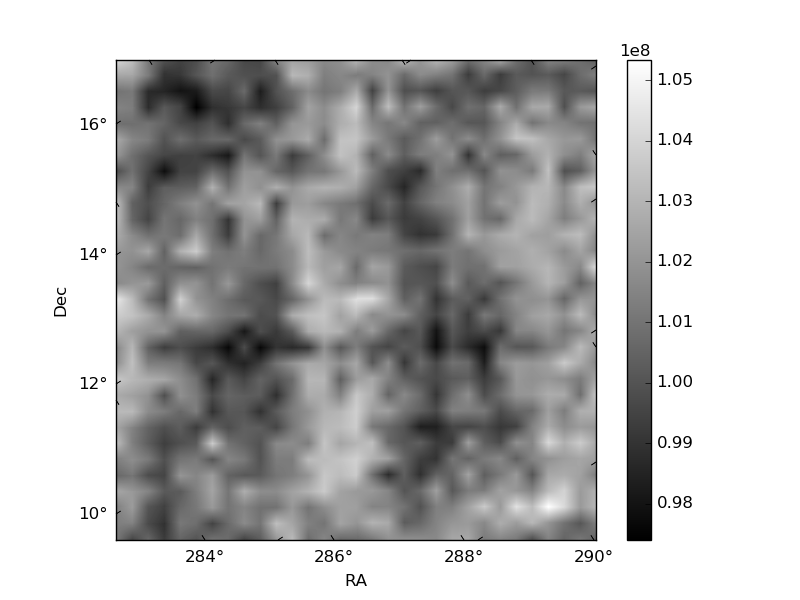
Histogram calculated using DETX and DETY for each event in the final _common_clean file
| Quadrant A | 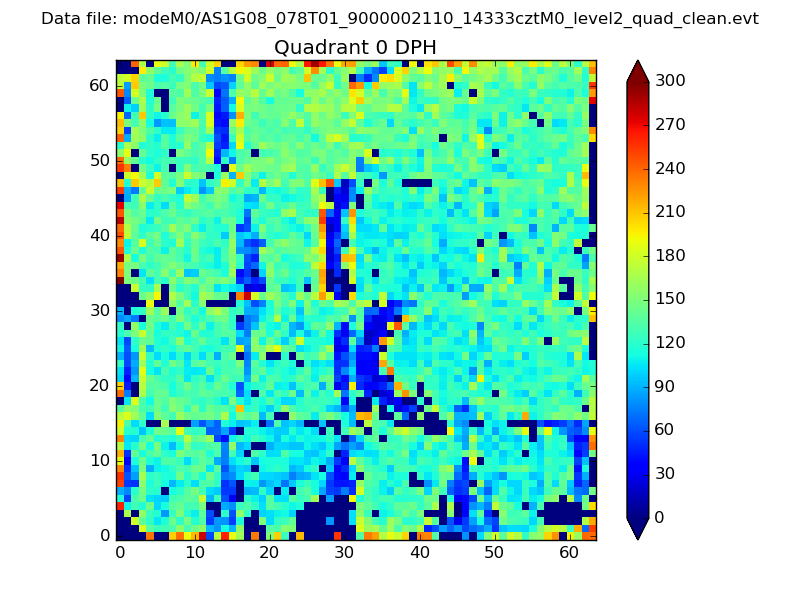 |
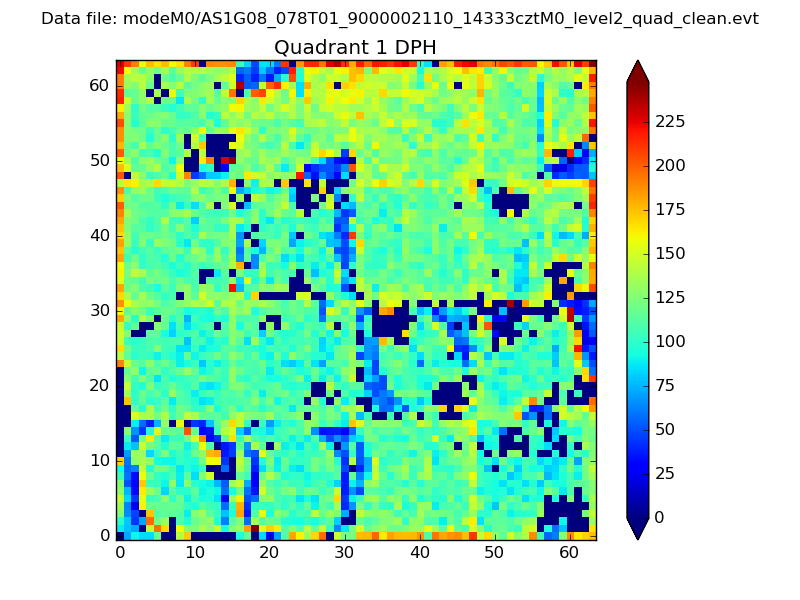 |
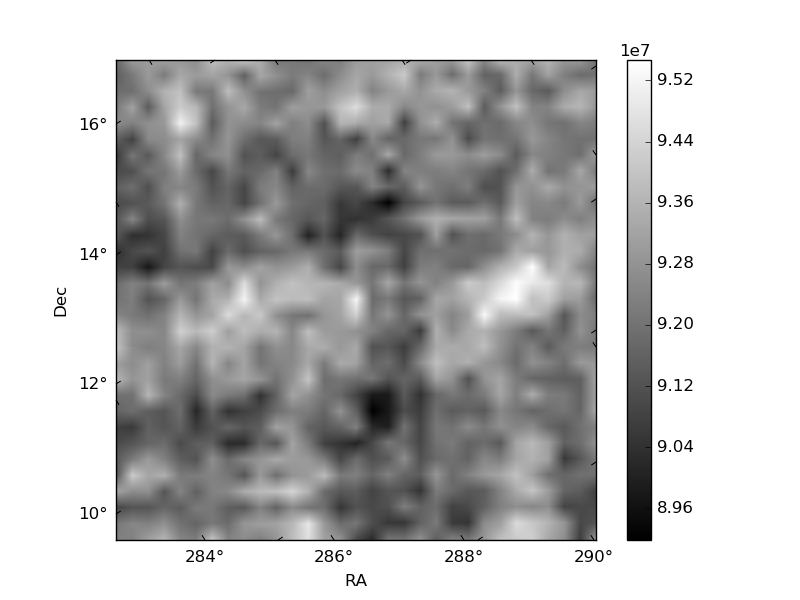
Quadrant B |
|---|---|---|---|
| Quadrant D | 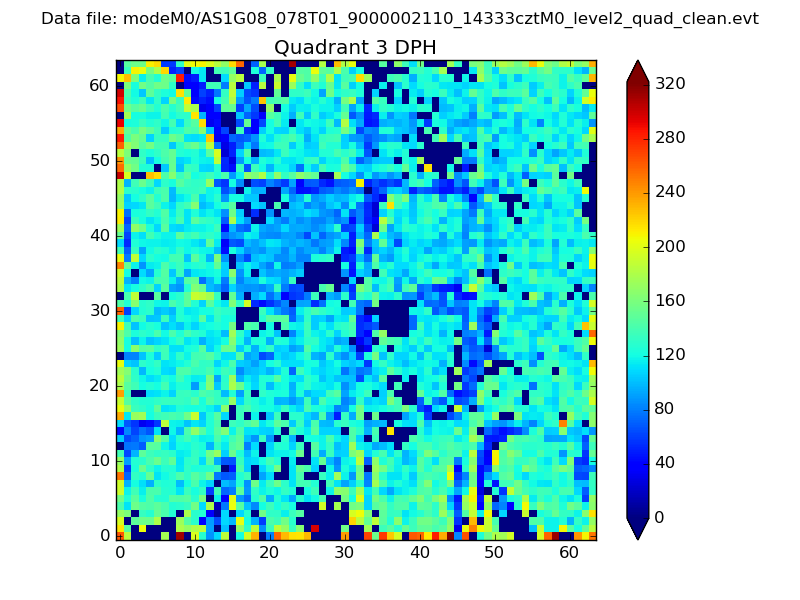 |
 |
Quadrant C |
| Plot type | Count rate plots | Images |
|---|---|---|
| Comparison with Poisson distribution Blue bars denote a histogram of data divided into 1 sec bins. Red curve is a Poisson curve with rate = median count rate of data. |
 |
 |
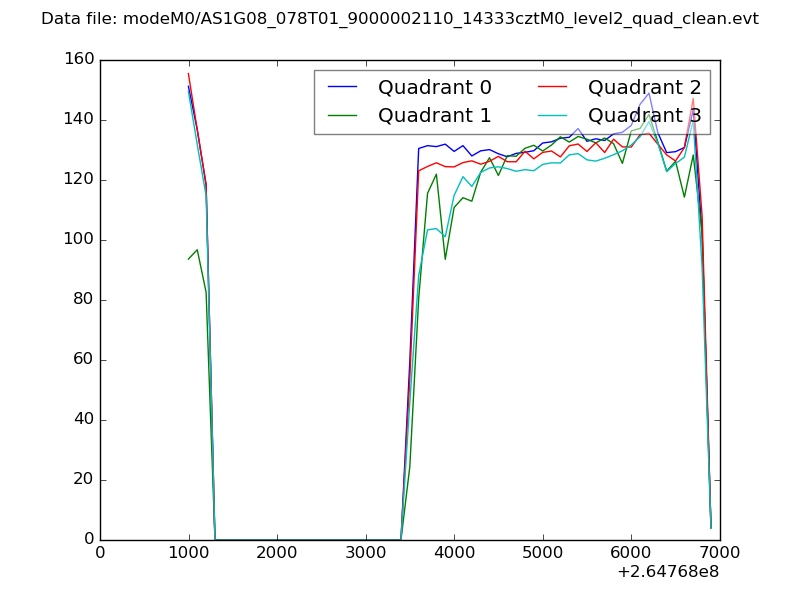
| Quadrant-wise count rates Data is divided into 100 sec bins |
 |
|
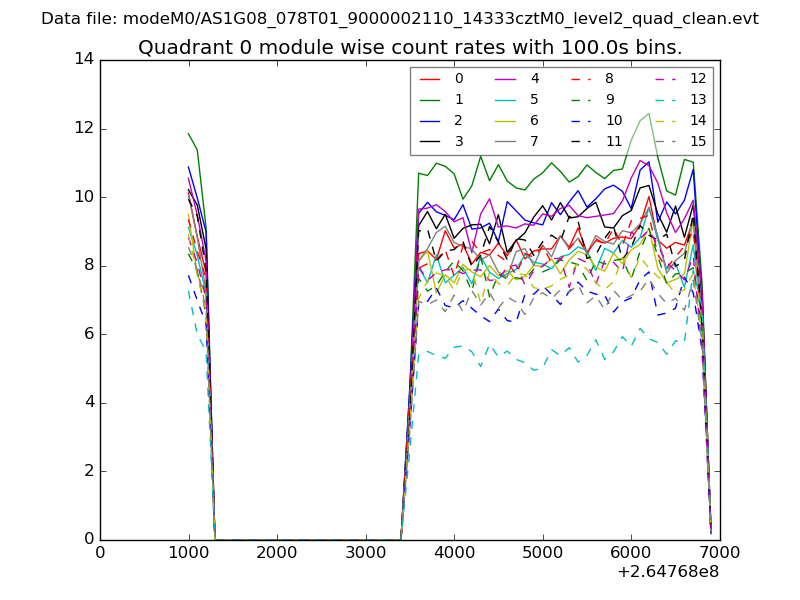
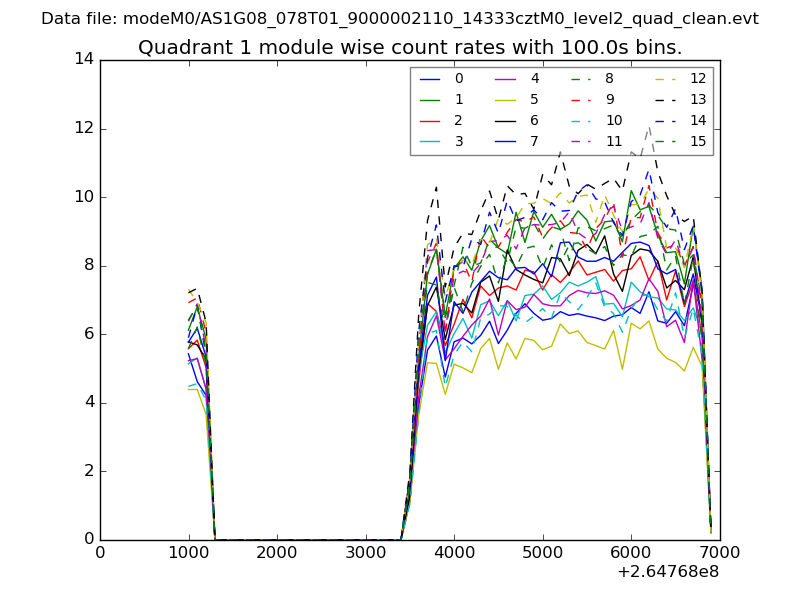
| Module-wise count rates for Quadrant A Data is divided into 100 sec bins |
 |
 |
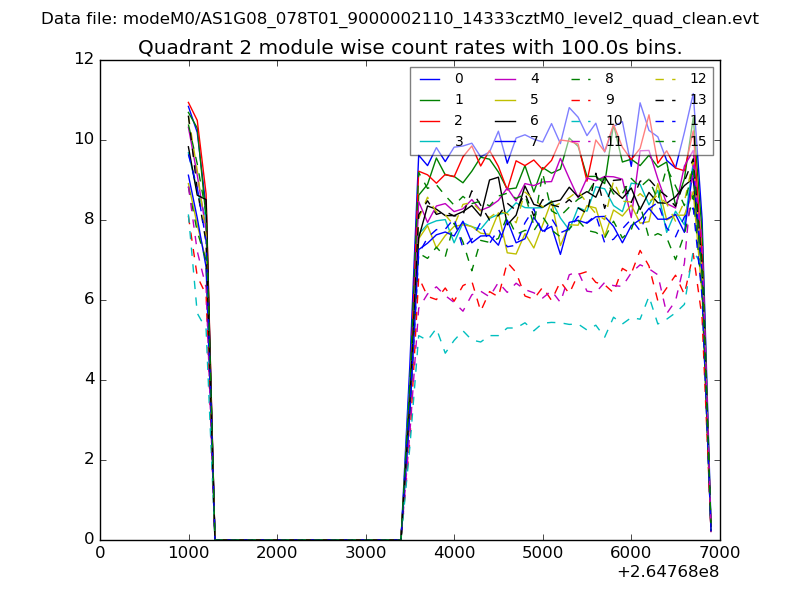
| Module-wise count rates for Quadrant B Data is divided into 100 sec bins |
 |
 |
| Module-wise count rates for Quadrant C Data is divided into 100 sec bins |
 |
 |
| Module-wise count rates for Quadrant D Data is divided into 100 sec bins |
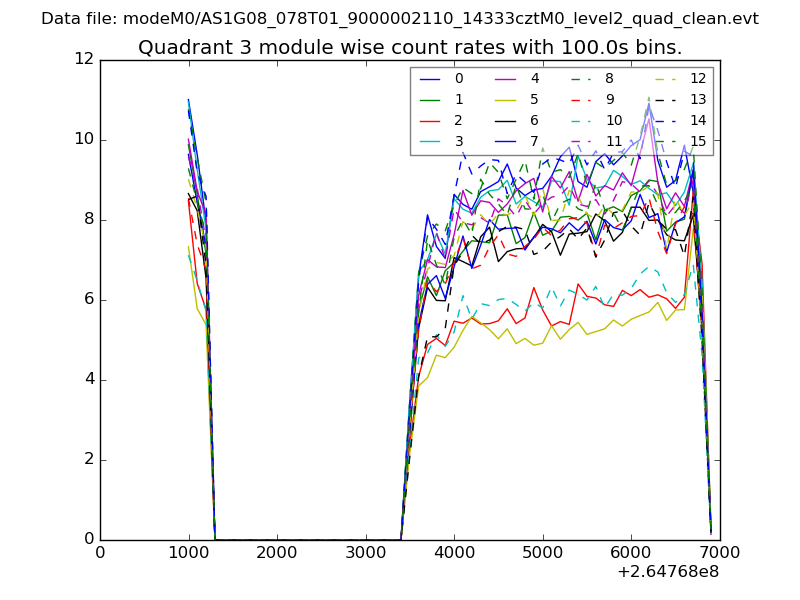 |
 |
| Parameter | Plot |
|---|---|
| CZT HV Monitor | 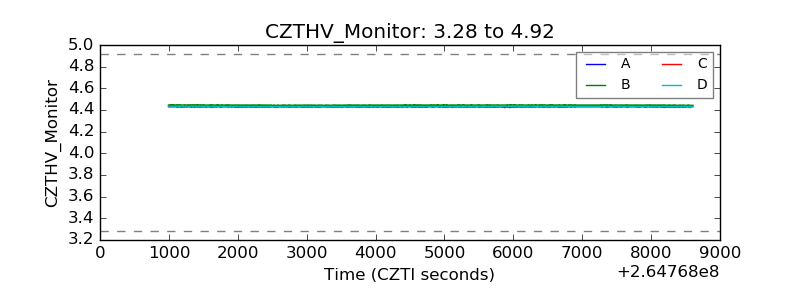 |
| D_VDD | 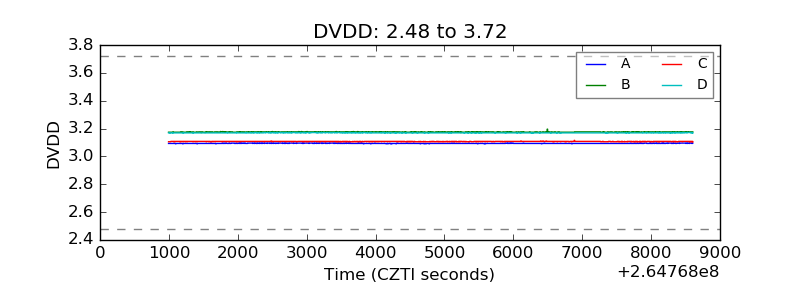 |
| Temperature 1 | 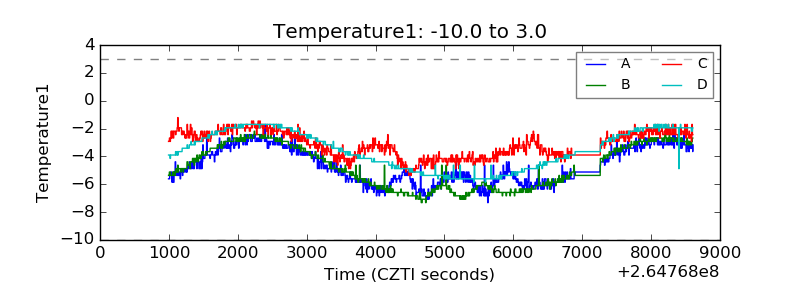 |
| Veto HV Monitor | 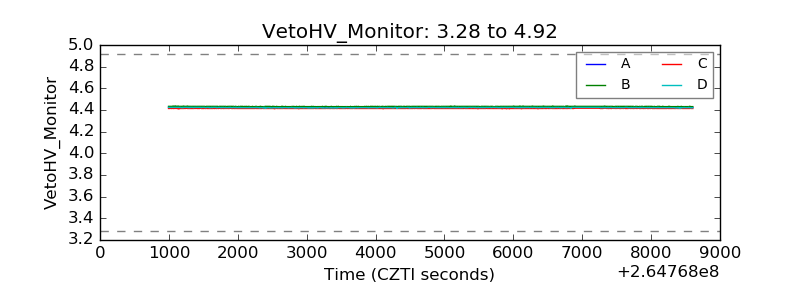 |
| Veto LLD | 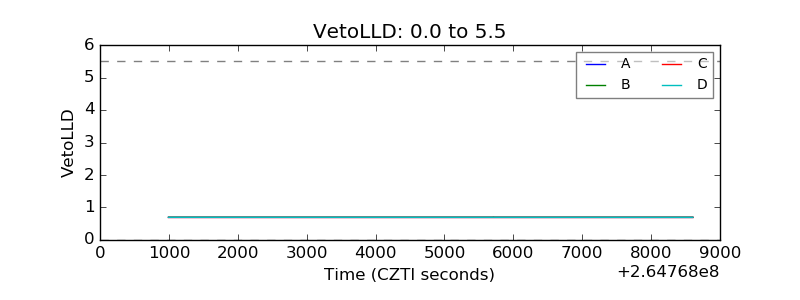 |
| Alpha Counter | 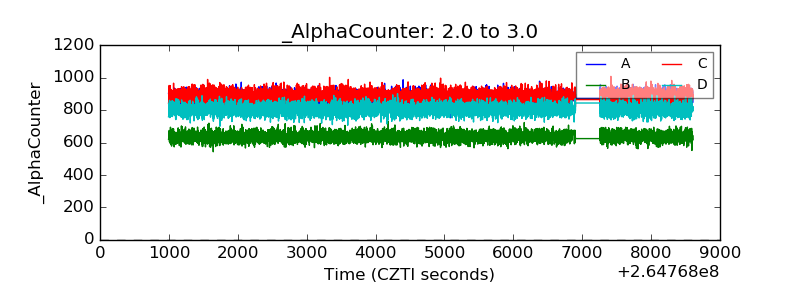 |
| _CPM_Rate | 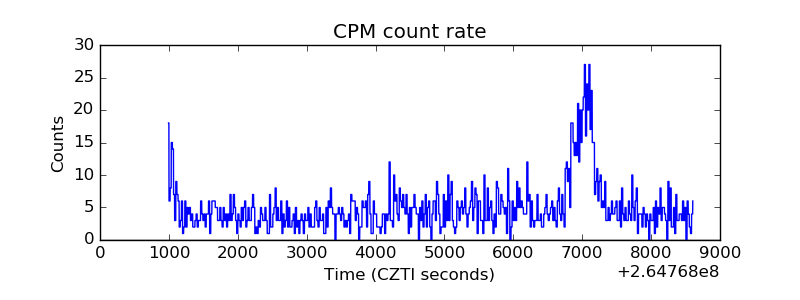 |
| CZT Counter | 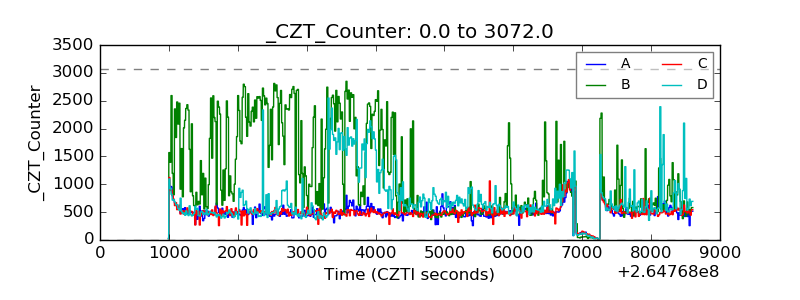 |
| +2.5 Volts monitor |  |
| +5 Volts monitor | 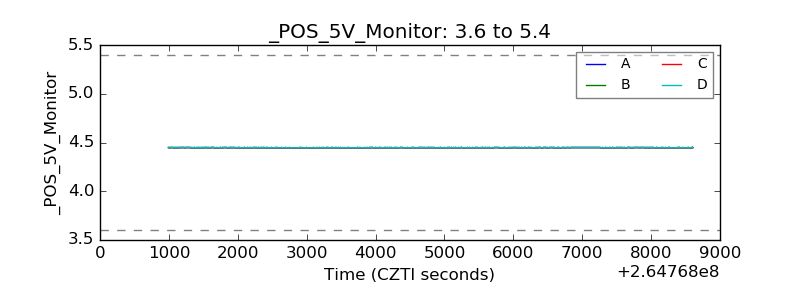 |
| _ROLL_ROT | 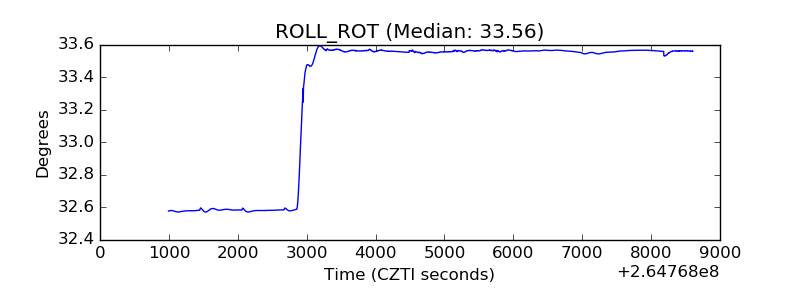 |
| _Roll_DEC | 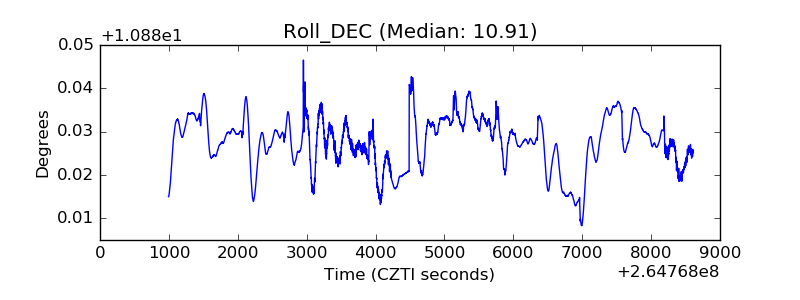 |
| _Roll_RA | 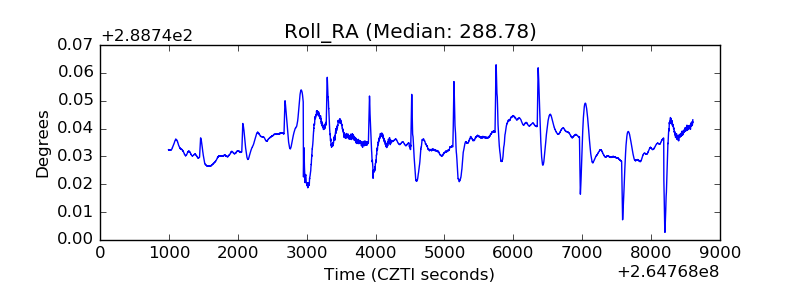 |
| Veto Counter | 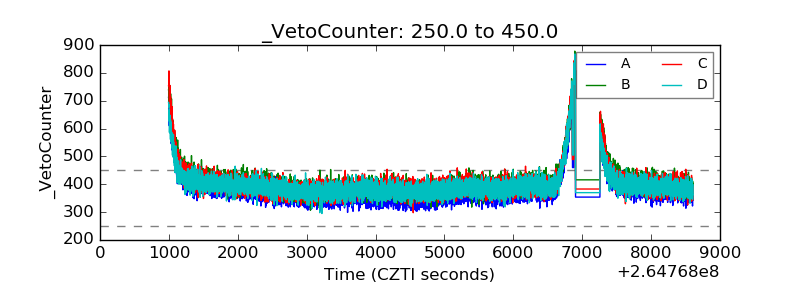 |