| Param | Original file | Final file |
|---|---|---|
| Filename | modeM0/AS1G08_078T01_9000002110_14334cztM0_level2.evt | modeM0/AS1G08_078T01_9000002110_14334cztM0_level2_quad_clean.evt |
| Size (bytes) | 647,527,680 | 82,612,800 |
| Size | 617.5 MB | 78.8 MB |
| Events in quadrant A | 4,020,447 | 499,454 |
| Events in quadrant B | 5,452,582 | 491,321 |
| Events in quadrant C | 4,146,948 | 490,368 |
| Events in quadrant D | 5,458,153 | 473,840 |
| Mode SS | |||
|---|---|---|---|
| Quadrant | BADHDUFLAG | Total packets | Discarded packets |
| A | 0 | 160 | 0 |
| B | 0 | 160 | 0 |
| C | 0 | 160 | 0 |
| D | 0 | 160 | 0 |
| Mode M0 | |||
|---|---|---|---|
| Quadrant | BADHDUFLAG | Total packets | Discarded packets |
| A | 0 | 16989 | 4 |
| B | 0 | 21302 | 3 |
| C | 0 | 16837 | 3 |
| D | 0 | 21428 | 3 |
| Mode M9 | |||
|---|---|---|---|
| Quadrant | BADHDUFLAG | Total packets | Discarded packets |
| A | 0 | 6 | 0 |
| B | 0 | 6 | 0 |
| C | 0 | 6 | 0 |
| D | 0 | 6 | 0 |
| Quadrant | Total seconds | Saturated seconds | Saturation percentage |
|---|---|---|---|
| A | 7863 | 209 | 2.658019% |
| B | 7863 | 507 | 6.447921% |
| C | 7863 | 182 | 2.314638% |
| D | 7863 | 406 | 5.163424% |
Noise dominated data is calculated using 1-second bins in cleaned event files. If a bin has >2000 counts, and if more than 50% of those come from <1% of pixels, then it is considered to be noise-dominated and hence unusable.
| Quadrant | # 1 sec bins | Bins with >0 counts | Bins with >2000 counts | High rate bins dominated by noise | Noise dominated (total time) | Noise dominated (detector-on time) | Marked lightcurve |
|---|---|---|---|---|---|---|---|
| A | 8459 | 7865 | 5 | 5 | 0.06% | 0.06% | 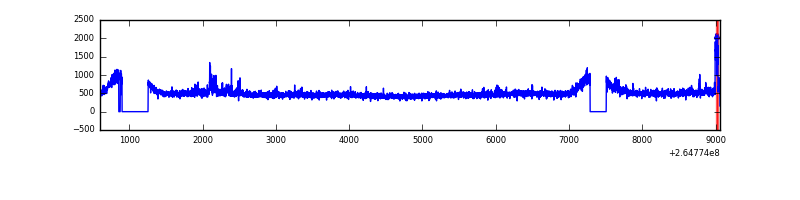 |
| B | 8459 | 7864 | 166 | 166 | 1.96% | 2.11% | 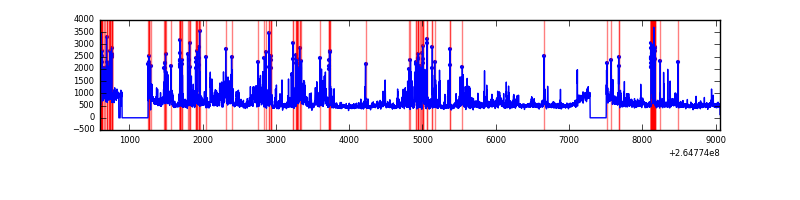 |
| C | 8459 | 7866 | 0 | 0 | 0.00% | 0.00% | 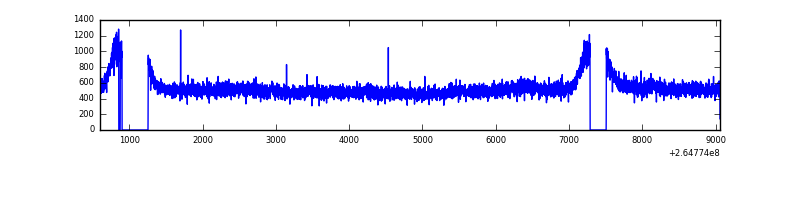 |
| D | 8459 | 7864 | 182 | 182 | 2.15% | 2.31% | 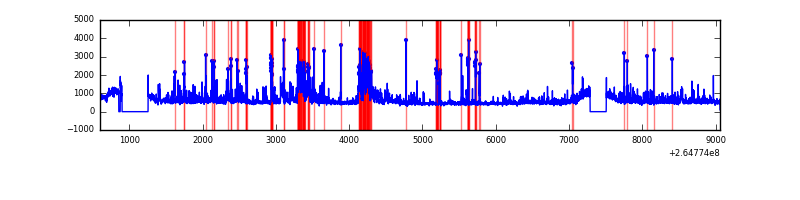 |
Top three noisy pixels from each quadrant. If the there are fewer than three noisy pixels in the level2.evt file, extra rows are filled as -1
| Pixel properties | Quadrant properties | ||||||
|---|---|---|---|---|---|---|---|
| Quadrant | DetID | PixID | Counts | Sigma | Mean | Median | Sigma |
| A | 8 | 15 | 147586 | 731.17 | 986 | 967 | 200.5 |
| A | 11 | 29 | 41524 | 202.25 | 986 | 967 | 200.5 |
| A | 12 | 189 | 39270 | 191.01 | 986 | 967 | 200.5 |
| B | 10 | 245 | 1261785 | 6626.8 | 963 | 942 | 190.3 |
| B | 10 | 16 | 230474 | 1206.38 | 963 | 942 | 190.3 |
| B | 0 | 189 | 85138 | 442.52 | 963 | 942 | 190.3 |
| C | 3 | 233 | 438865 | 1953.75 | 951 | 953 | 224.1 |
| C | 13 | 61 | 6799 | 26.08 | 951 | 953 | 224.1 |
| C | 14 | 234 | 2383 | 6.38 | 951 | 953 | 224.1 |
| D | 5 | 222 | 650521 | 2864.86 | 944 | 921 | 226.7 |
| D | 13 | 122 | 427665 | 1882.03 | 944 | 921 | 226.7 |
| D | 10 | 199 | 325604 | 1431.92 | 944 | 921 | 226.7 |
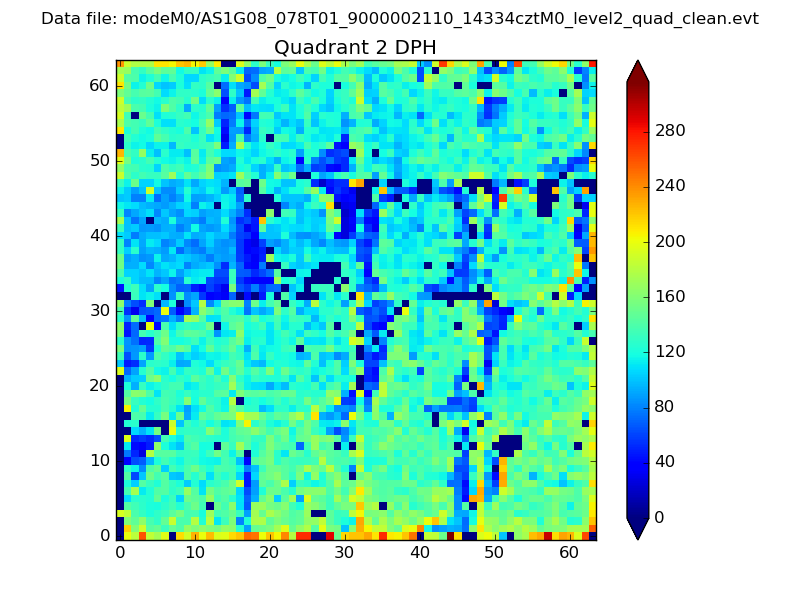
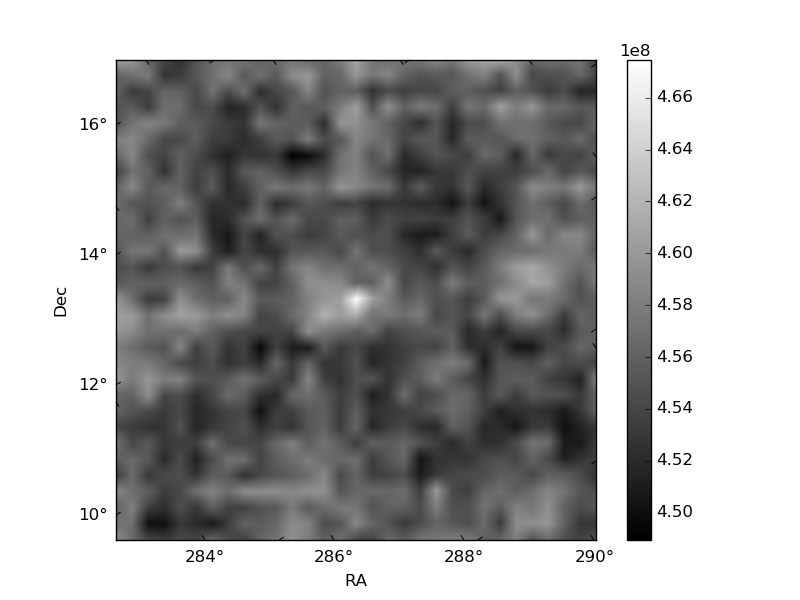
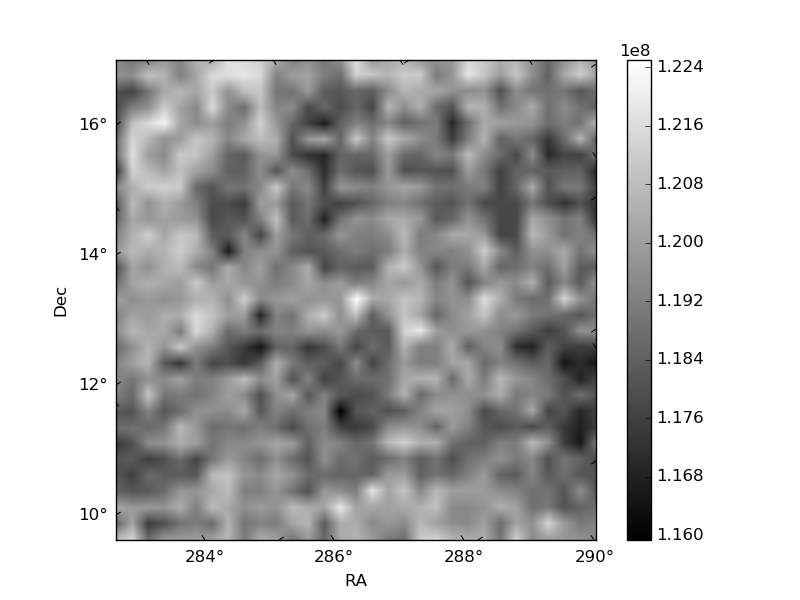
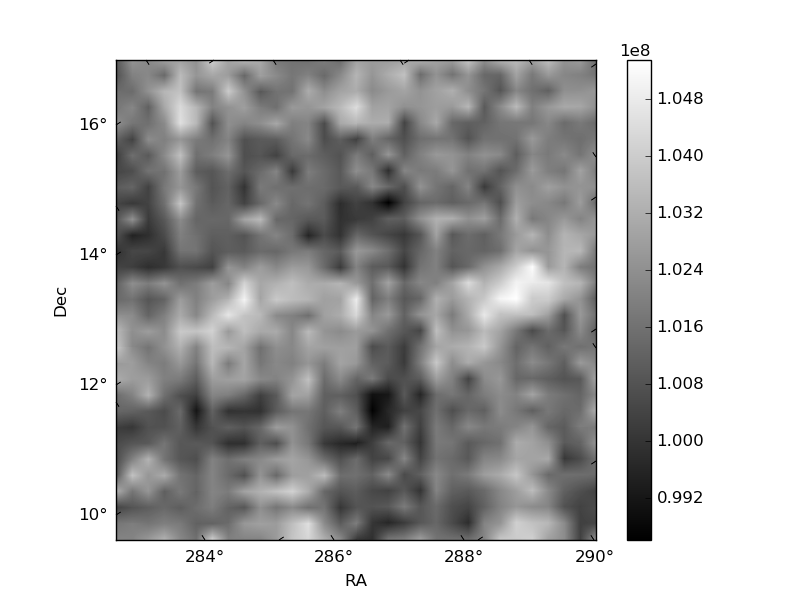
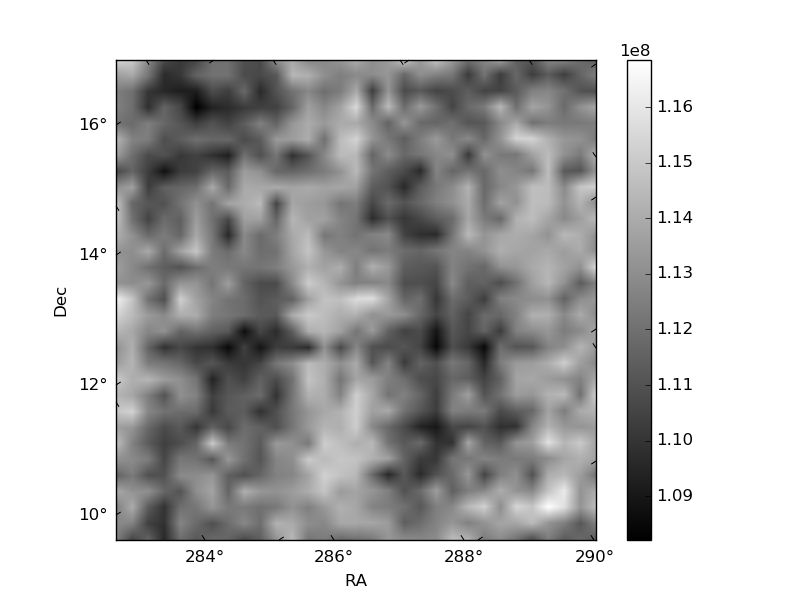
Histogram calculated using DETX and DETY for each event in the final _common_clean file
| Quadrant A | 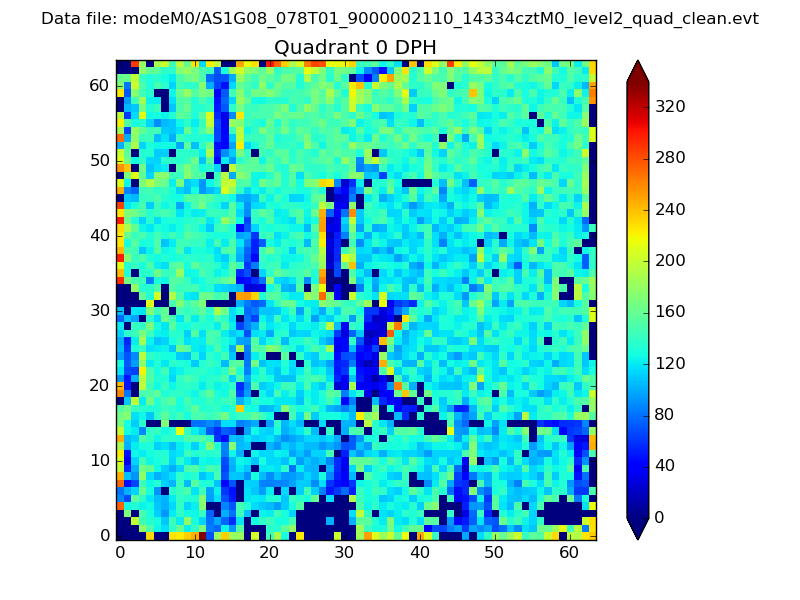 |
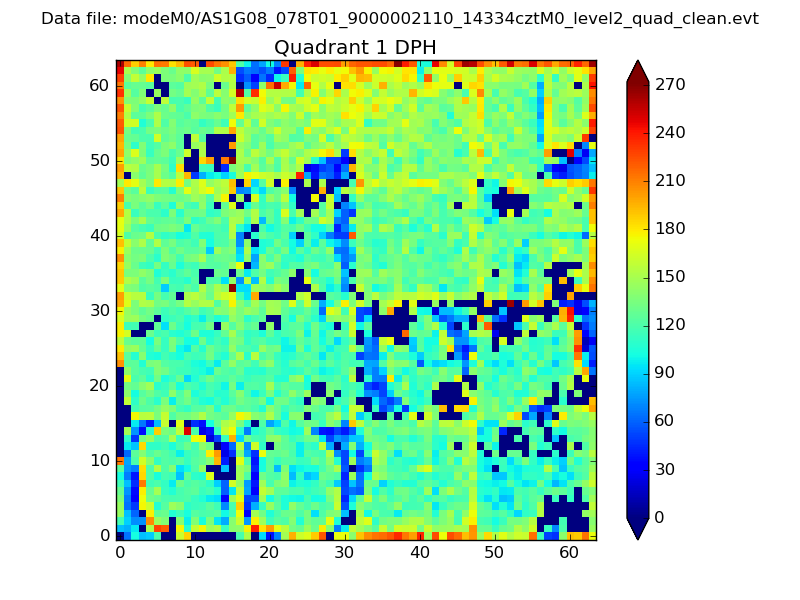 |
Quadrant B |
|---|---|---|---|
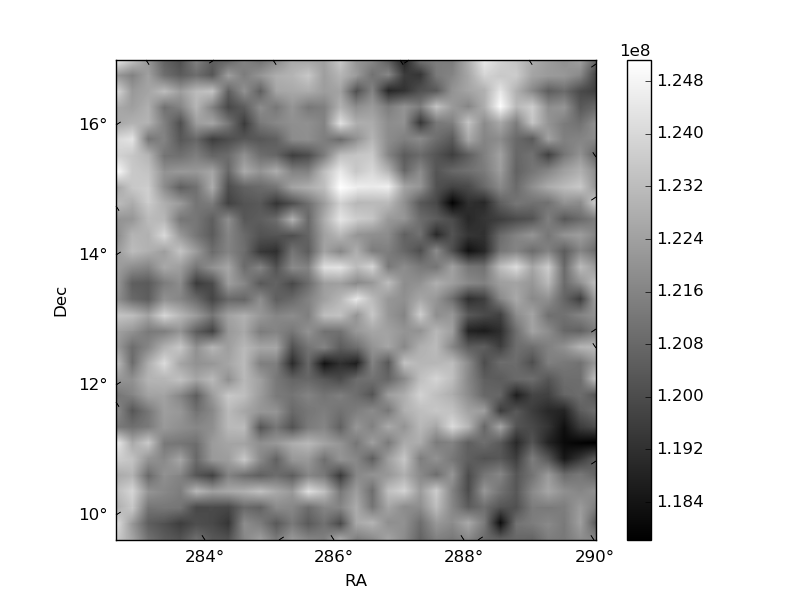
| Quadrant D | 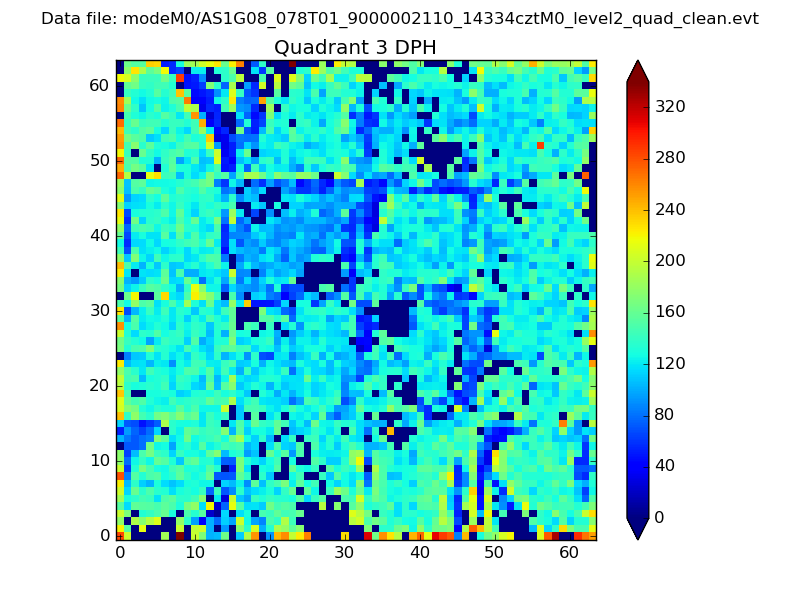 |
 |
Quadrant C |
| Plot type | Count rate plots | Images |
|---|---|---|
| Comparison with Poisson distribution Blue bars denote a histogram of data divided into 1 sec bins. Red curve is a Poisson curve with rate = median count rate of data. |
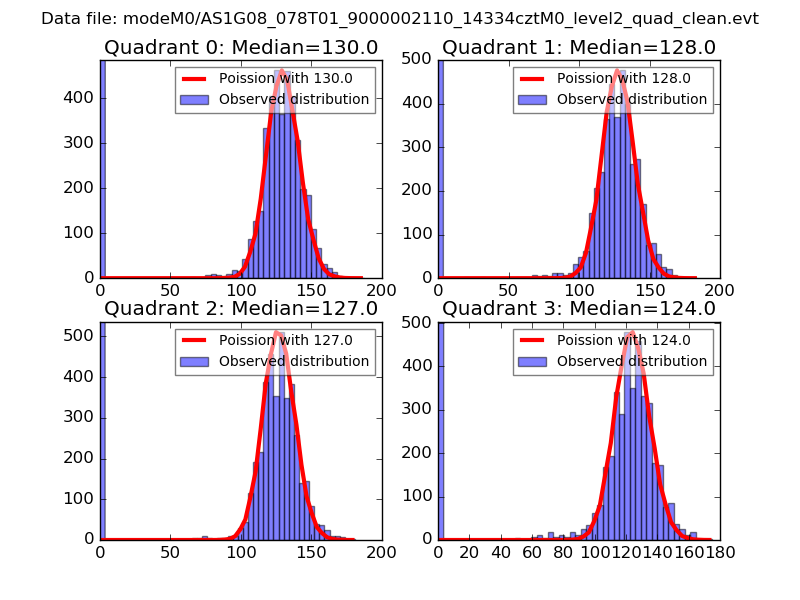 |
 |
| Quadrant-wise count rates Data is divided into 100 sec bins |
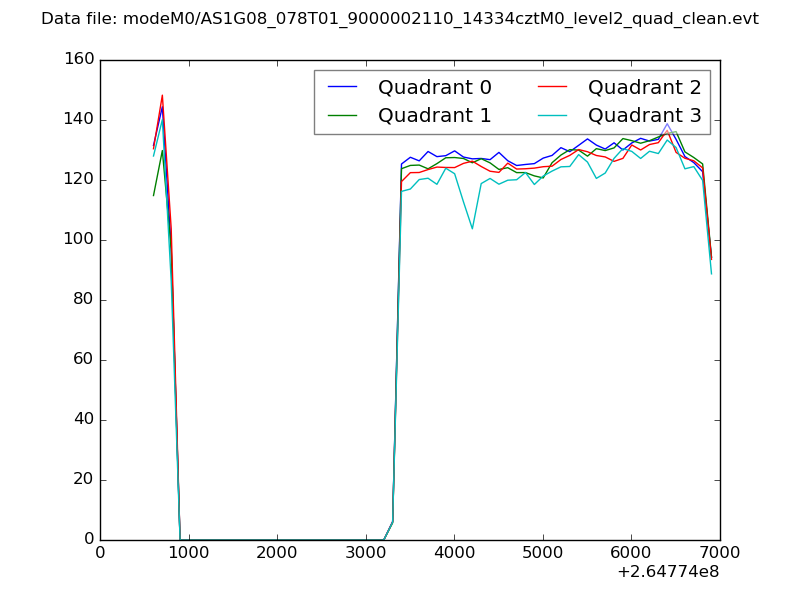 |
|
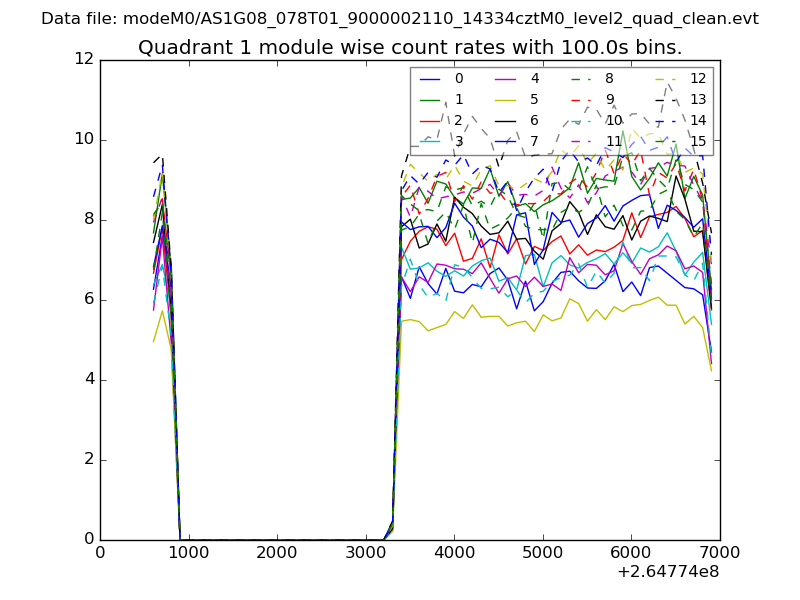
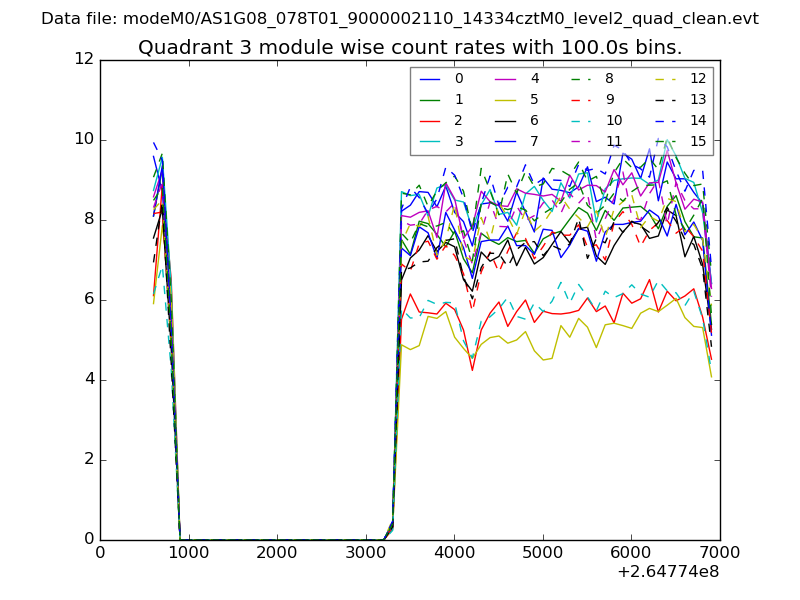
| Module-wise count rates for Quadrant A Data is divided into 100 sec bins |
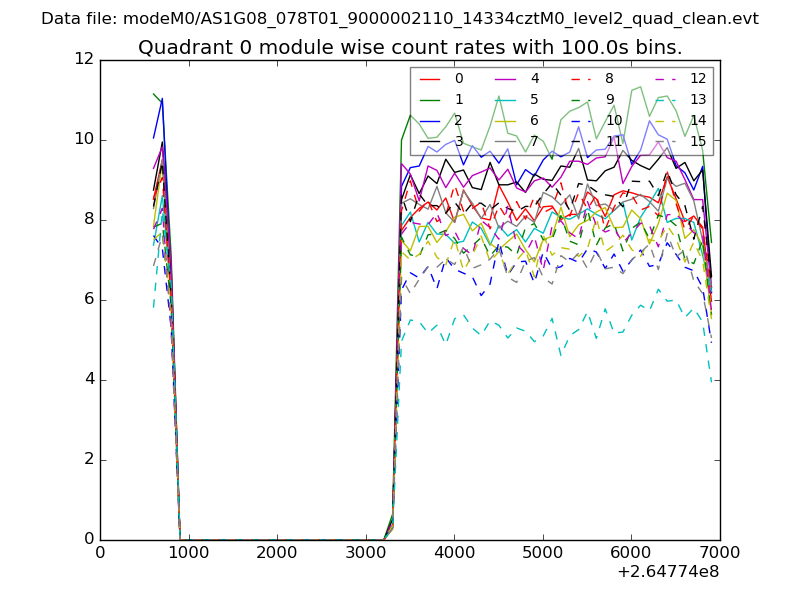 |
 |
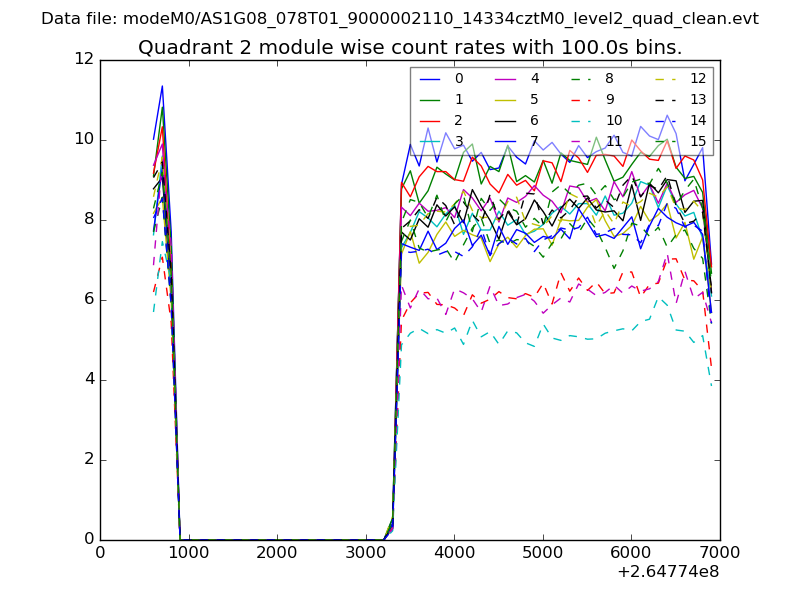
| Module-wise count rates for Quadrant B Data is divided into 100 sec bins |
 |
 |
| Module-wise count rates for Quadrant C Data is divided into 100 sec bins |
 |
 |
| Module-wise count rates for Quadrant D Data is divided into 100 sec bins |
 |
 |
| Parameter | Plot |
|---|---|
| CZT HV Monitor | 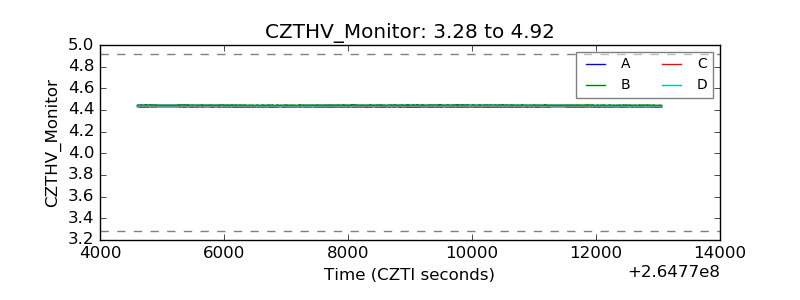 |
| D_VDD |  |
| Temperature 1 | 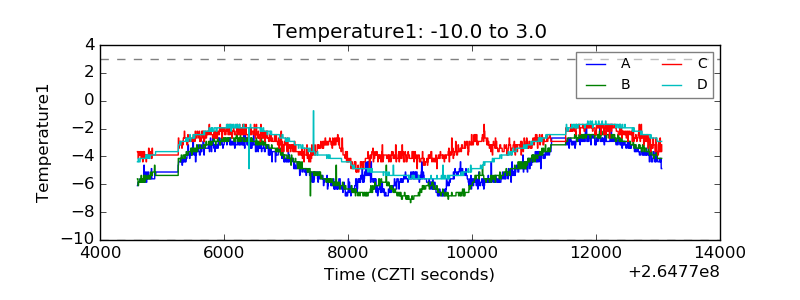 |
| Veto HV Monitor | 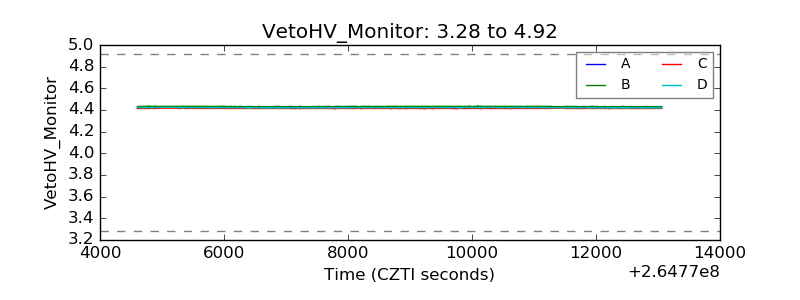 |
| Veto LLD |  |
| Alpha Counter | 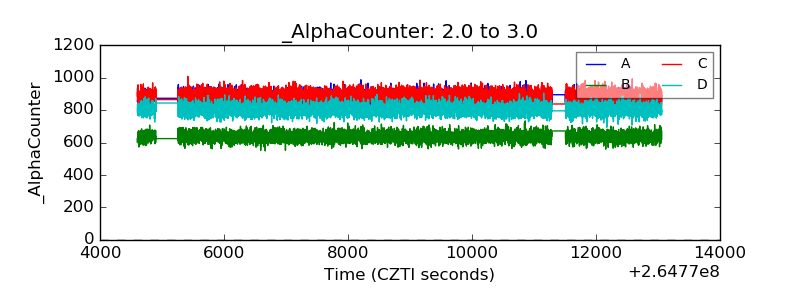 |
| _CPM_Rate | 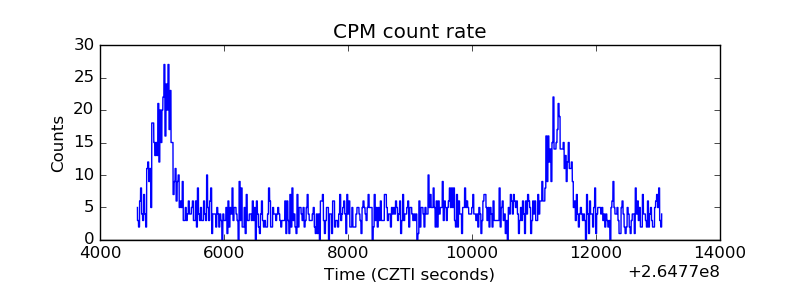 |
| CZT Counter | 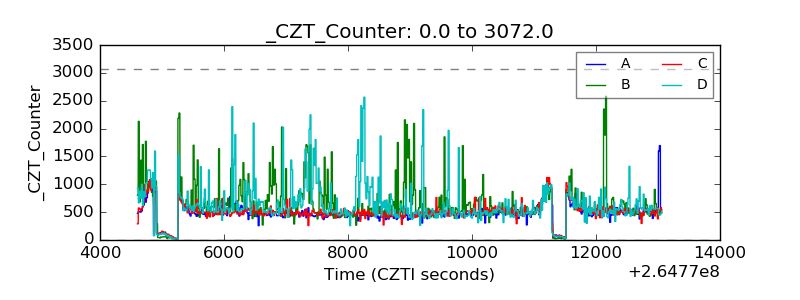 |
| +2.5 Volts monitor | 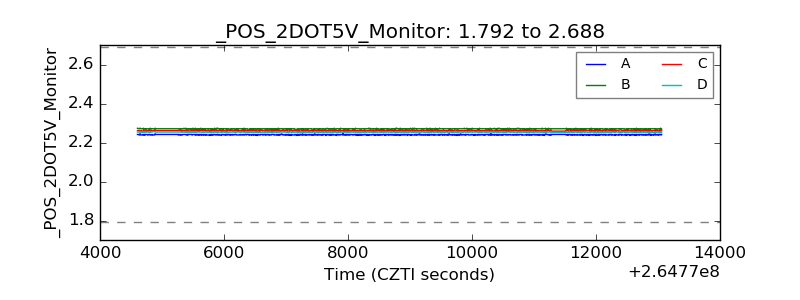 |
| +5 Volts monitor |  |
| _ROLL_ROT | 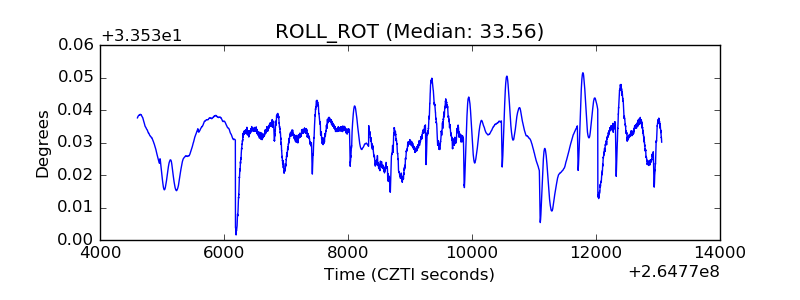 |
| _Roll_DEC | 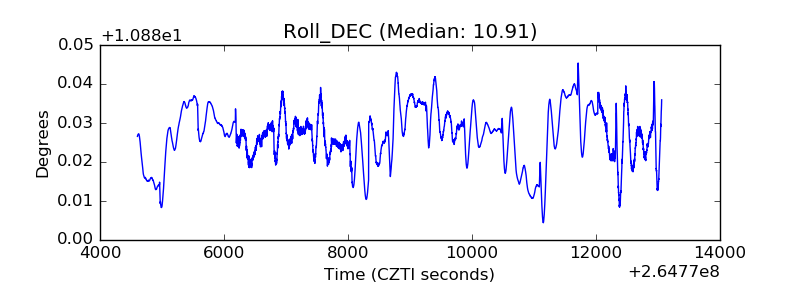 |
| _Roll_RA | 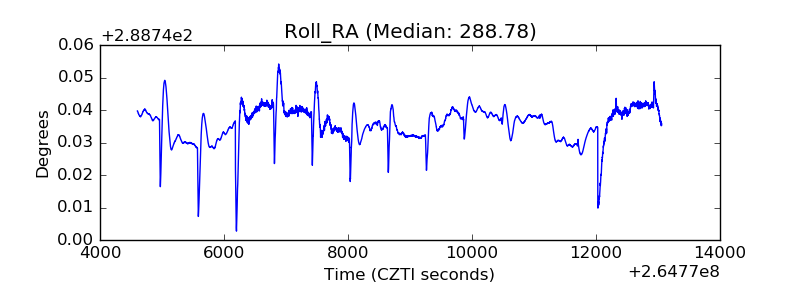 |
| Veto Counter | 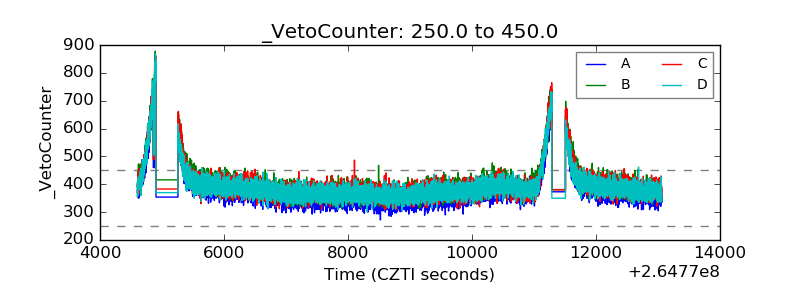 |