| Param | Original file | Final file |
|---|---|---|
| Filename | modeM0/AS1G08_078T01_9000002110_14335cztM0_level2.evt | modeM0/AS1G08_078T01_9000002110_14335cztM0_level2_quad_clean.evt |
| Size (bytes) | 534,968,640 | 81,112,320 |
| Size | 510.2 MB | 77.4 MB |
| Events in quadrant A | 3,612,777 | 498,535 |
| Events in quadrant B | 3,815,405 | 494,165 |
| Events in quadrant C | 3,679,130 | 484,951 |
| Events in quadrant D | 4,602,387 | 473,737 |
| Mode SS | |||
|---|---|---|---|
| Quadrant | BADHDUFLAG | Total packets | Discarded packets |
| A | 0 | 148 | 0 |
| B | 0 | 148 | 0 |
| C | 0 | 148 | 0 |
| D | 0 | 148 | 0 |
| Mode M0 | |||
|---|---|---|---|
| Quadrant | BADHDUFLAG | Total packets | Discarded packets |
| A | 0 | 15284 | 2 |
| B | 0 | 15901 | 1 |
| C | 0 | 14998 | 1 |
| D | 0 | 18558 | 1 |
| Mode M9 | |||
|---|---|---|---|
| Quadrant | BADHDUFLAG | Total packets | Discarded packets |
| A | 0 | 3 | 0 |
| B | 0 | 3 | 0 |
| C | 0 | 3 | 0 |
| D | 0 | 3 | 0 |
| Quadrant | Total seconds | Saturated seconds | Saturation percentage |
|---|---|---|---|
| A | 7246 | 103 | 1.421474% |
| B | 7246 | 183 | 2.525531% |
| C | 7246 | 78 | 1.076456% |
| D | 7246 | 159 | 2.194314% |
Noise dominated data is calculated using 1-second bins in cleaned event files. If a bin has >2000 counts, and if more than 50% of those come from <1% of pixels, then it is considered to be noise-dominated and hence unusable.
| Quadrant | # 1 sec bins | Bins with >0 counts | Bins with >2000 counts | High rate bins dominated by noise | Noise dominated (total time) | Noise dominated (detector-on time) | Marked lightcurve |
|---|---|---|---|---|---|---|---|
| A | 7607 | 7247 | 6 | 6 | 0.08% | 0.08% | 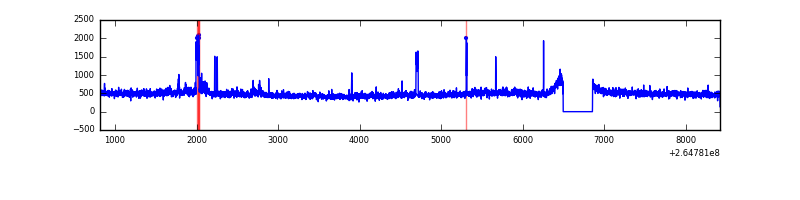 |
| B | 7607 | 7247 | 72 | 72 | 0.95% | 0.99% | 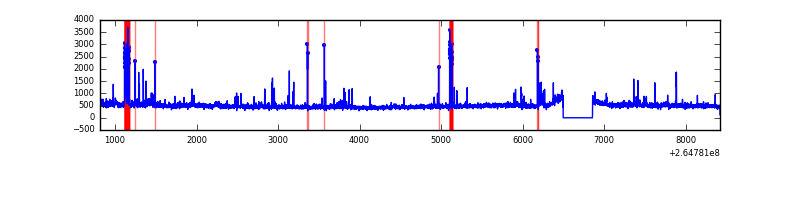 |
| C | 7607 | 7247 | 0 | 0 | 0.00% | 0.00% | 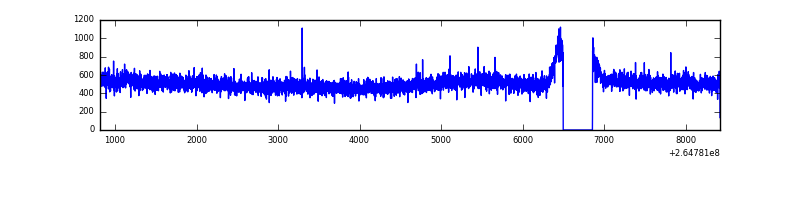 |
| D | 7607 | 7247 | 59 | 59 | 0.78% | 0.81% | 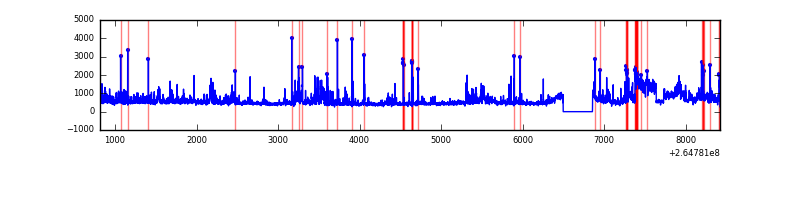 |
Top three noisy pixels from each quadrant. If the there are fewer than three noisy pixels in the level2.evt file, extra rows are filled as -1
| Pixel properties | Quadrant properties | ||||||
|---|---|---|---|---|---|---|---|
| Quadrant | DetID | PixID | Counts | Sigma | Mean | Median | Sigma |
| A | 8 | 15 | 101512 | 563.69 | 874 | 853 | 178.6 |
| A | 11 | 29 | 84781 | 469.99 | 874 | 853 | 178.6 |
| A | 12 | 189 | 66989 | 370.36 | 874 | 853 | 178.6 |
| B | 10 | 16 | 193334 | 1141.44 | 862 | 839 | 168.6 |
| B | 10 | 245 | 144378 | 851.14 | 862 | 839 | 168.6 |
| B | 0 | 189 | 44188 | 257.05 | 862 | 839 | 168.6 |
| C | 3 | 233 | 391686 | 1971.26 | 843 | 845 | 198.3 |
| C | 13 | 61 | 5988 | 25.94 | 843 | 845 | 198.3 |
| C | 3 | 202 | 2054 | 6.1 | 843 | 845 | 198.3 |
| D | 12 | 110 | 473480 | 2360.97 | 839 | 819 | 200.2 |
| D | 5 | 222 | 385209 | 1920.05 | 839 | 819 | 200.2 |
| D | 10 | 199 | 149130 | 740.82 | 839 | 819 | 200.2 |
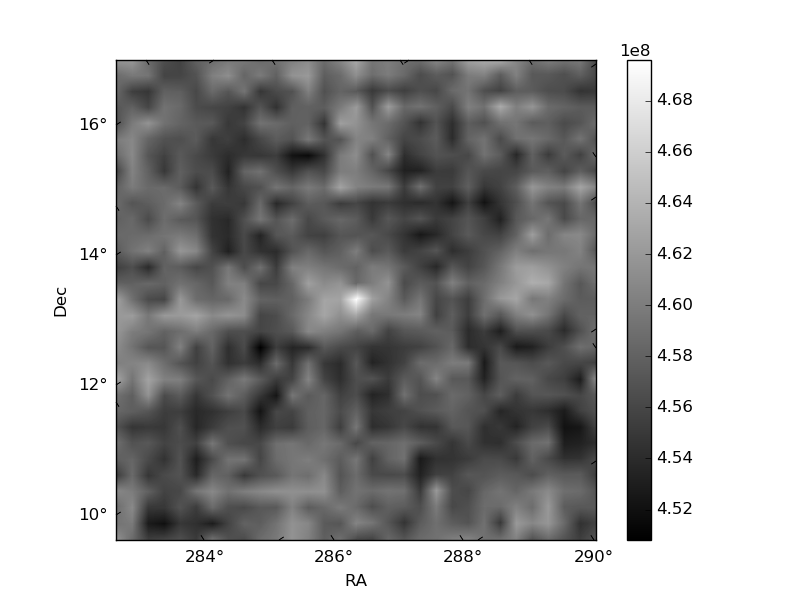
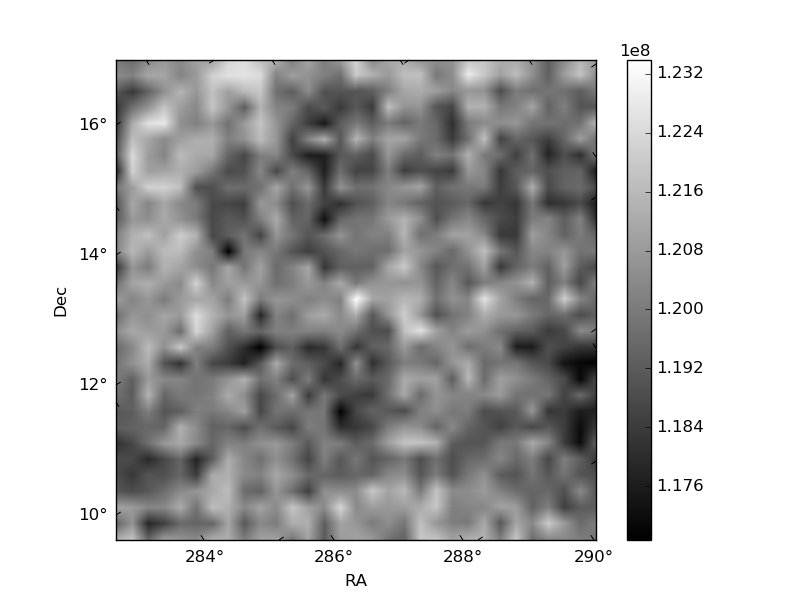
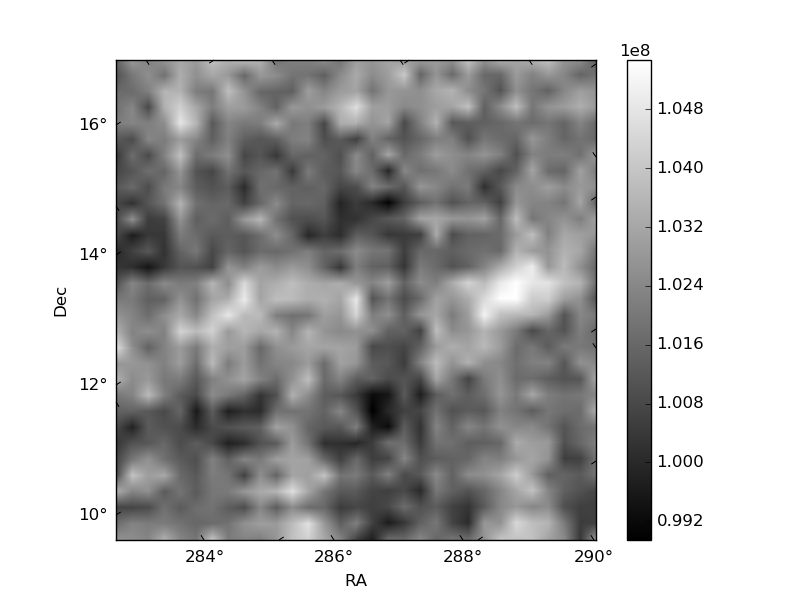
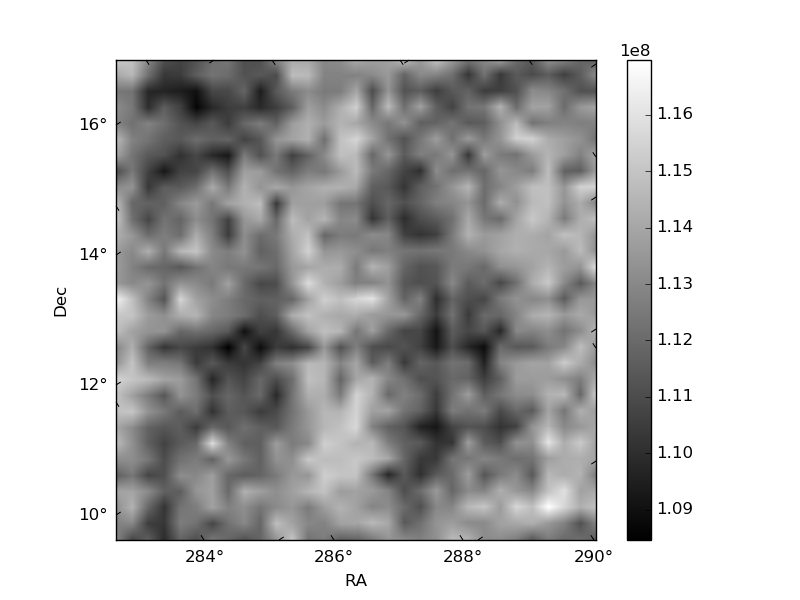
Histogram calculated using DETX and DETY for each event in the final _common_clean file
| Quadrant A | 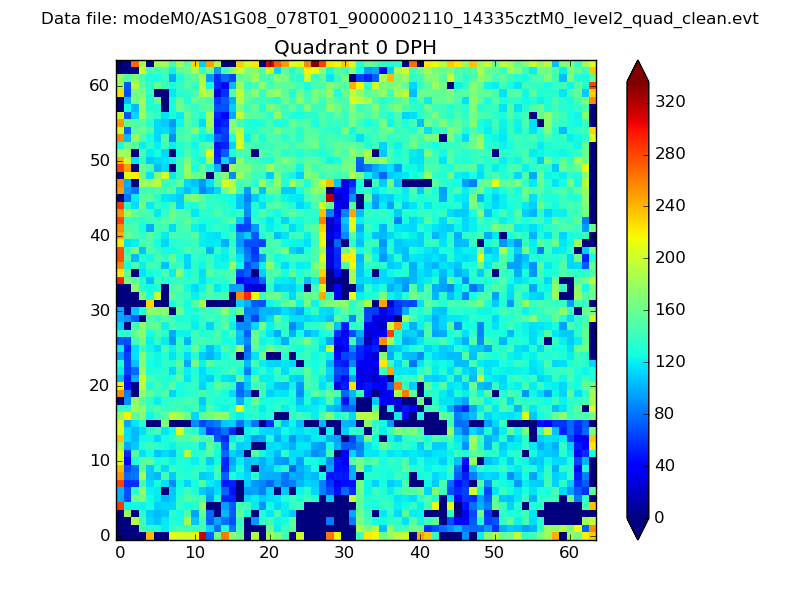 |
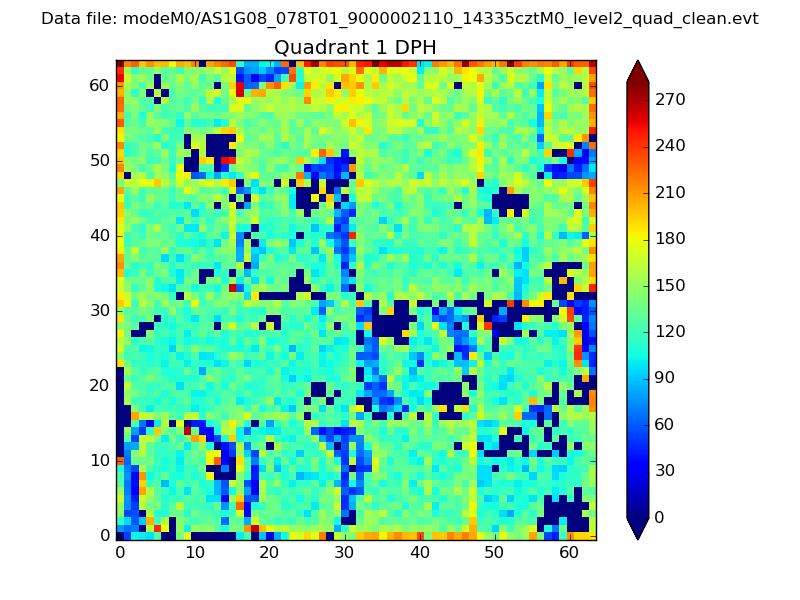 |
Quadrant B |
|---|---|---|---|
| Quadrant D |  |
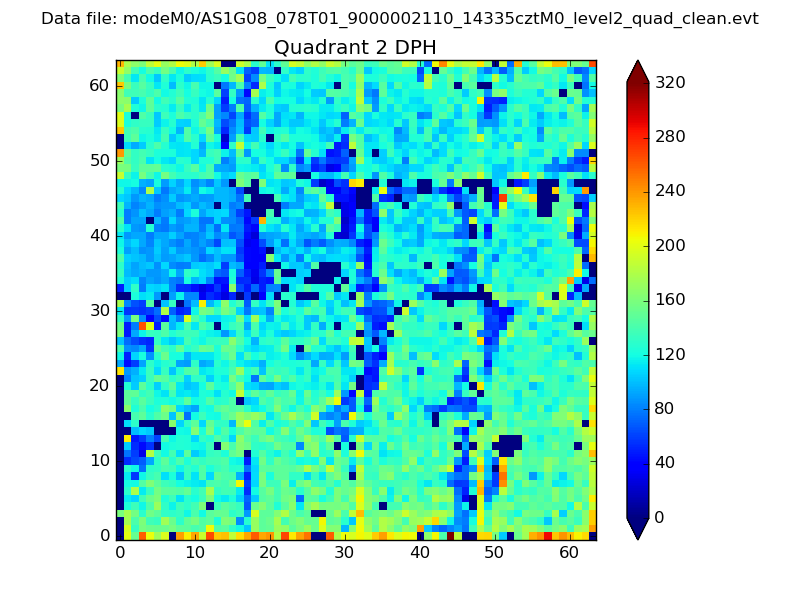 |
Quadrant C |
| Plot type | Count rate plots | Images |
|---|---|---|
| Comparison with Poisson distribution Blue bars denote a histogram of data divided into 1 sec bins. Red curve is a Poisson curve with rate = median count rate of data. |
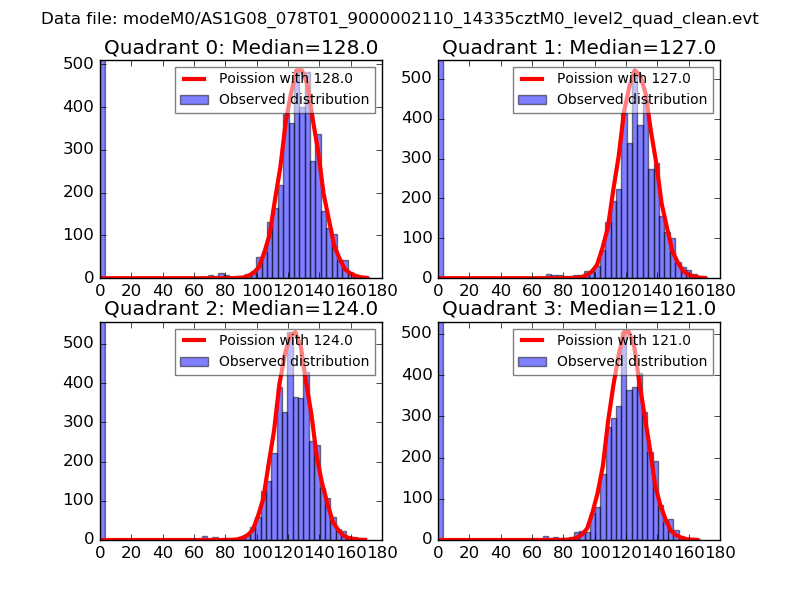 |
 |
| Quadrant-wise count rates Data is divided into 100 sec bins |
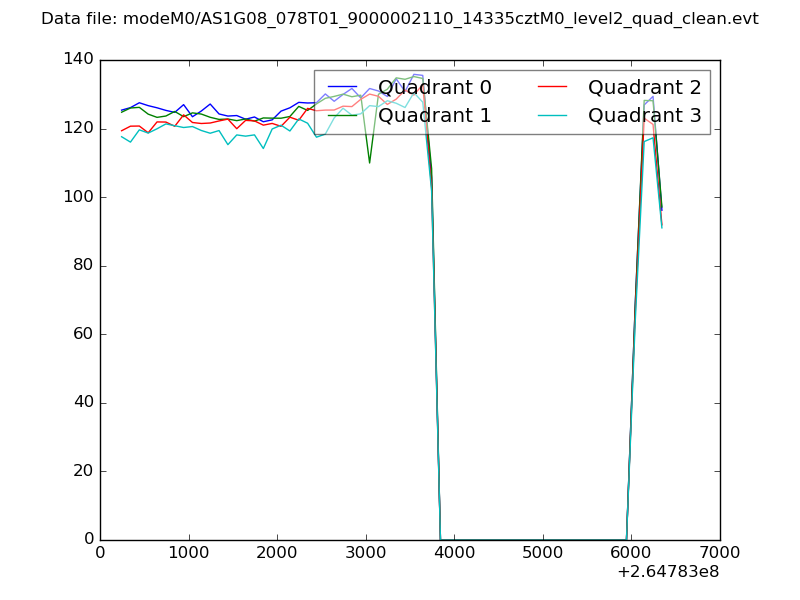 |
|
| Module-wise count rates for Quadrant A Data is divided into 100 sec bins |
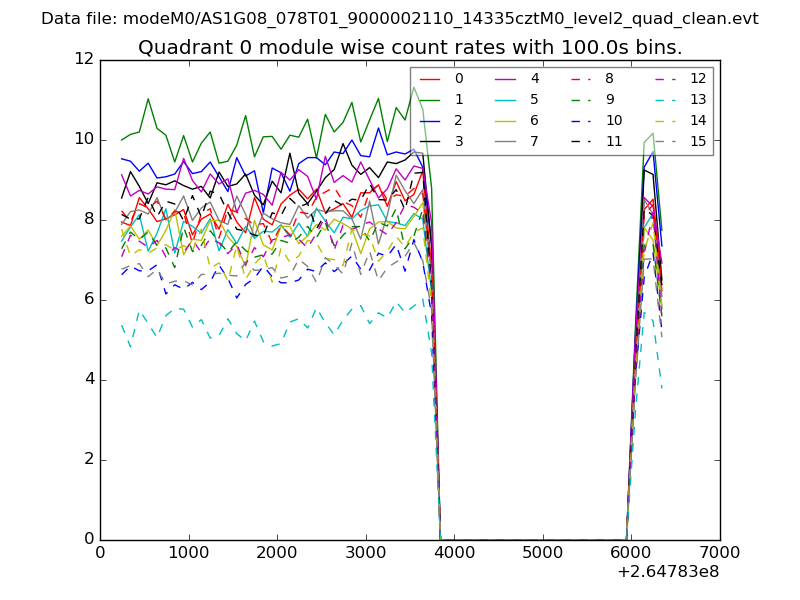 |
 |
| Module-wise count rates for Quadrant B Data is divided into 100 sec bins |
 |
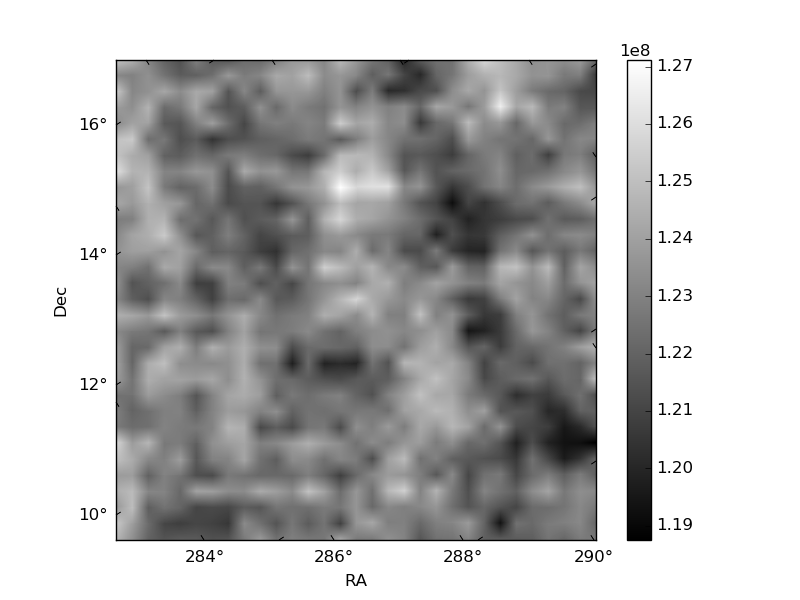 |
| Module-wise count rates for Quadrant C Data is divided into 100 sec bins |
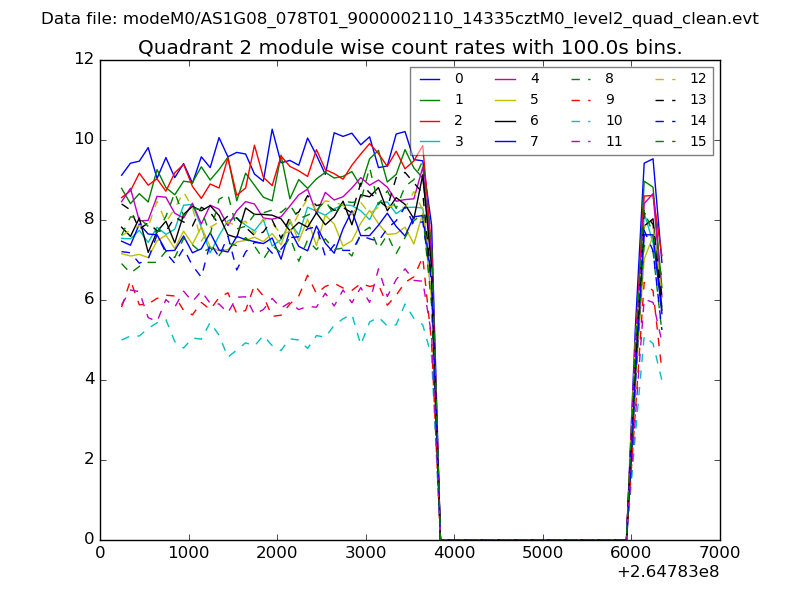 |
 |
| Module-wise count rates for Quadrant D Data is divided into 100 sec bins |
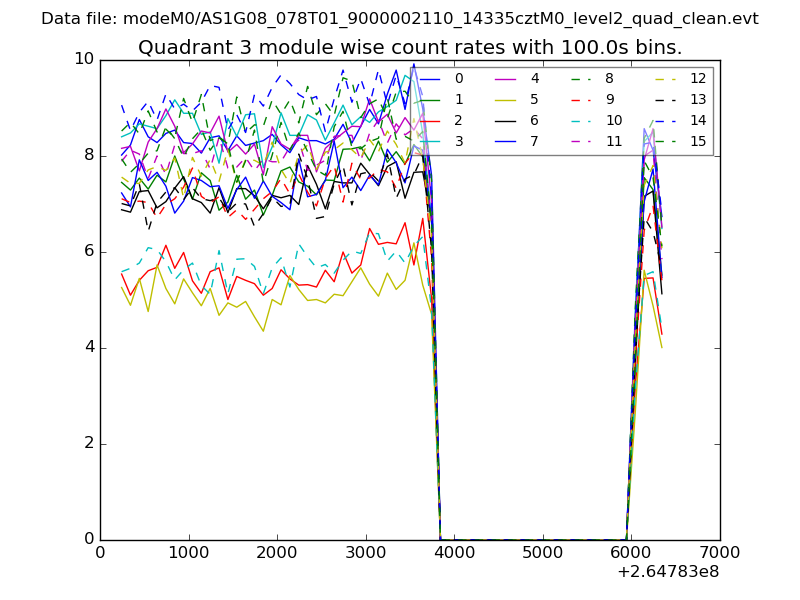 |
 |
| Parameter | Plot |
|---|---|
| CZT HV Monitor | 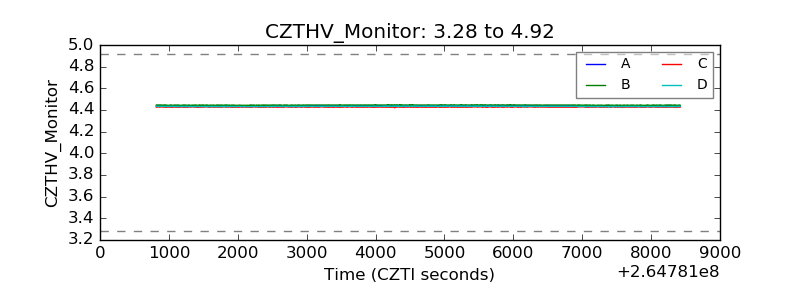 |
| D_VDD |  |
| Temperature 1 | 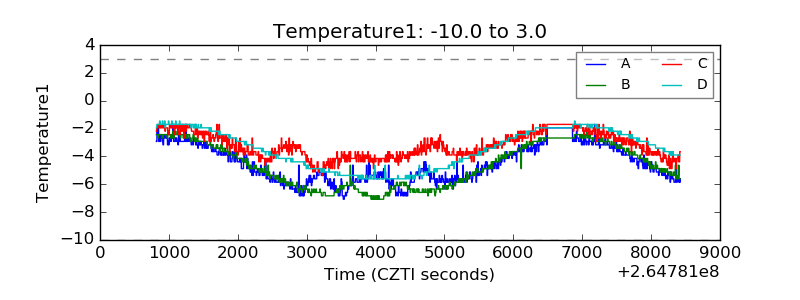 |
| Veto HV Monitor | 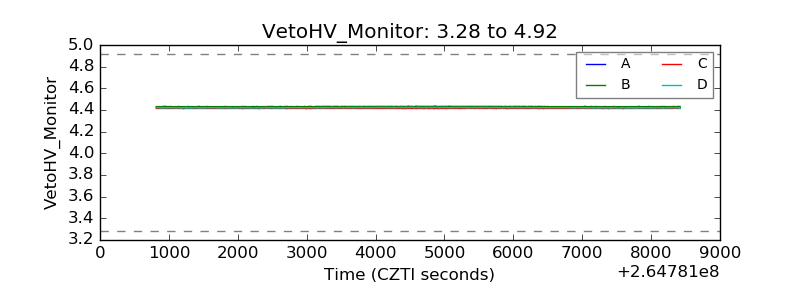 |
| Veto LLD | 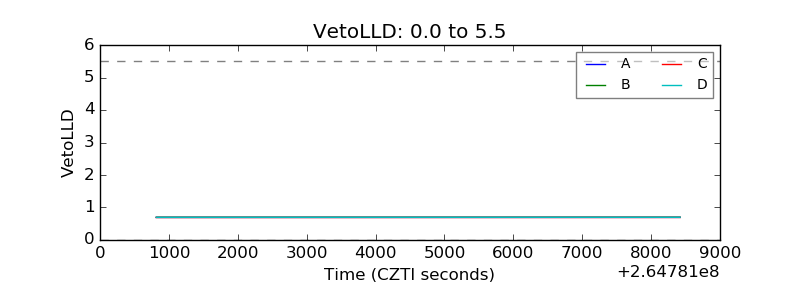 |
| Alpha Counter | 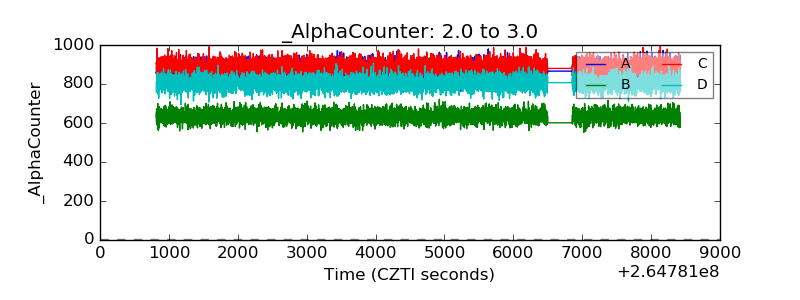 |
| _CPM_Rate | 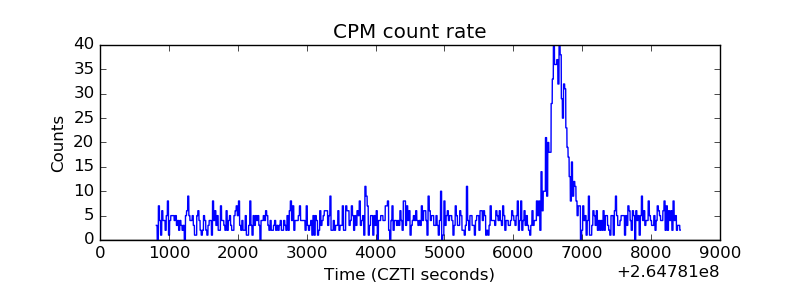 |
| CZT Counter | 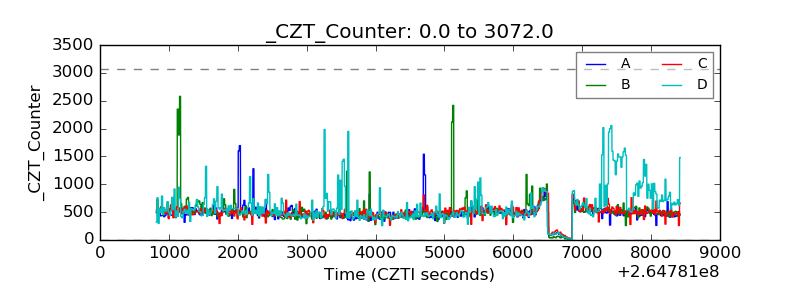 |
| +2.5 Volts monitor |  |
| +5 Volts monitor |  |
| _ROLL_ROT | 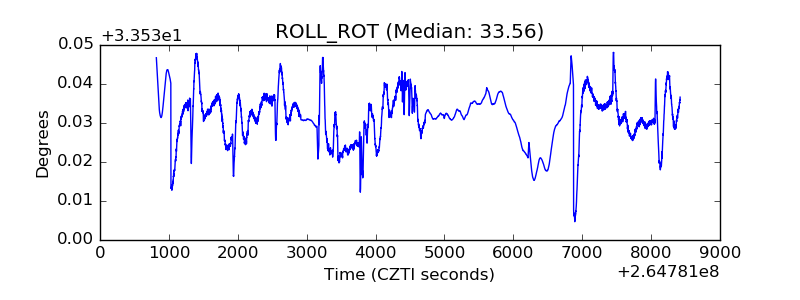 |
| _Roll_DEC | 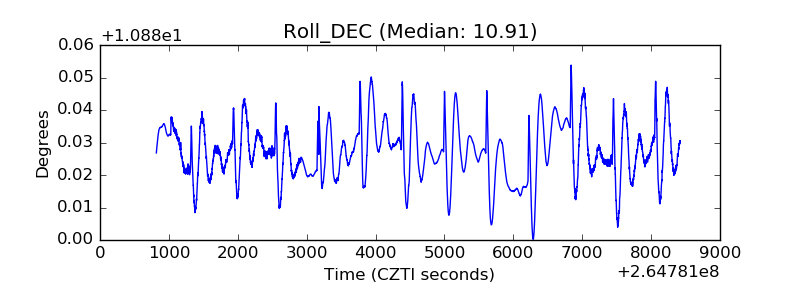 |
| _Roll_RA | 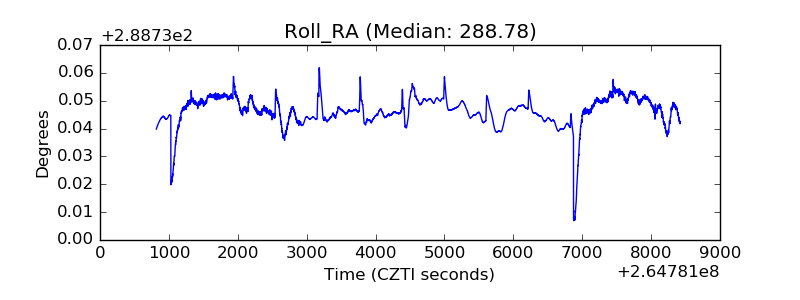 |
| Veto Counter | 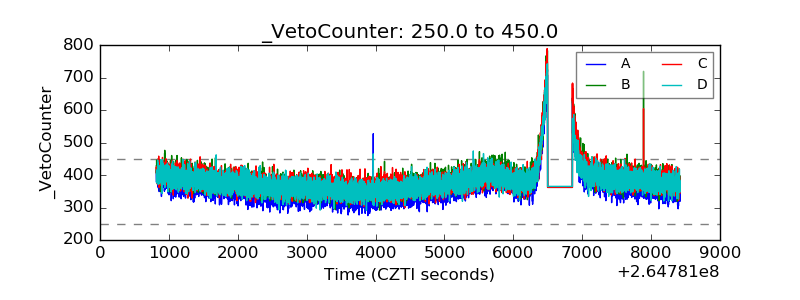 |