| Param | Original file | Final file |
|---|---|---|
| Filename | modeM0/AS1G08_078T01_9000002110_14337cztM0_level2.evt | modeM0/AS1G08_078T01_9000002110_14337cztM0_level2_quad_clean.evt |
| Size (bytes) | 983,332,800 | 163,108,800 |
| Size | 937.8 MB | 155.6 MB |
| Events in quadrant A | 5,980,839 | 1,040,444 |
| Events in quadrant B | 6,785,327 | 1,027,007 |
| Events in quadrant C | 6,199,022 | 1,024,129 |
| Events in quadrant D | 9,972,401 | 985,934 |
| Mode SS | |||
|---|---|---|---|
| Quadrant | BADHDUFLAG | Total packets | Discarded packets |
| A | 0 | 256 | 0 |
| B | 0 | 256 | 0 |
| C | 0 | 256 | 0 |
| D | 0 | 256 | 0 |
| Mode M0 | |||
|---|---|---|---|
| Quadrant | BADHDUFLAG | Total packets | Discarded packets |
| A | 0 | 25793 | 3 |
| B | 0 | 28310 | 2 |
| C | 0 | 25635 | 2 |
| D | 0 | 38230 | 2 |
| Mode M9 | |||
|---|---|---|---|
| Quadrant | BADHDUFLAG | Total packets | Discarded packets |
| A | 0 | 12 | 0 |
| B | 0 | 12 | 0 |
| C | 0 | 12 | 0 |
| D | 0 | 12 | 0 |
| Quadrant | Total seconds | Saturated seconds | Saturation percentage |
|---|---|---|---|
| A | 12468 | 54 | 0.433109% |
| B | 12468 | 282 | 2.261790% |
| C | 12468 | 42 | 0.336862% |
| D | 12468 | 336 | 2.694899% |
Noise dominated data is calculated using 1-second bins in cleaned event files. If a bin has >2000 counts, and if more than 50% of those come from <1% of pixels, then it is considered to be noise-dominated and hence unusable.
| Quadrant | # 1 sec bins | Bins with >0 counts | Bins with >2000 counts | High rate bins dominated by noise | Noise dominated (total time) | Noise dominated (detector-on time) | Marked lightcurve |
|---|---|---|---|---|---|---|---|
| A | 13784 | 12470 | 0 | 0 | 0.00% | 0.00% | 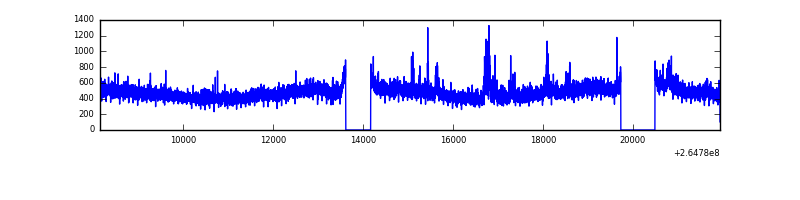 |
| B | 13784 | 12470 | 179 | 179 | 1.30% | 1.44% | 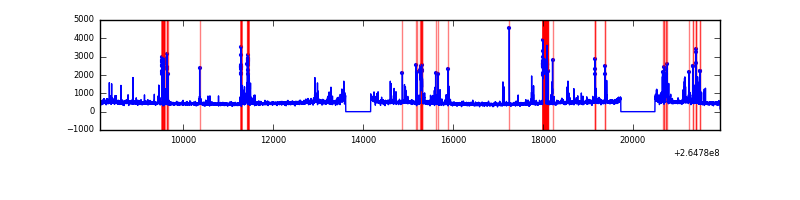 |
| C | 13784 | 12471 | 1 | 1 | 0.01% | 0.01% | 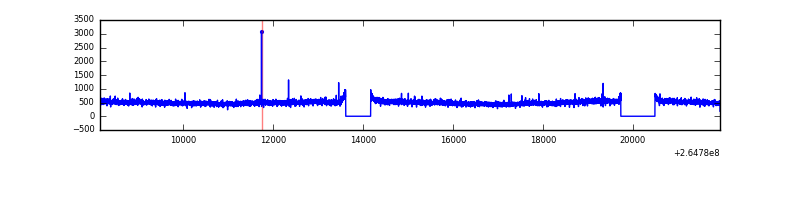 |
| D | 13784 | 12471 | 229 | 229 | 1.66% | 1.84% | 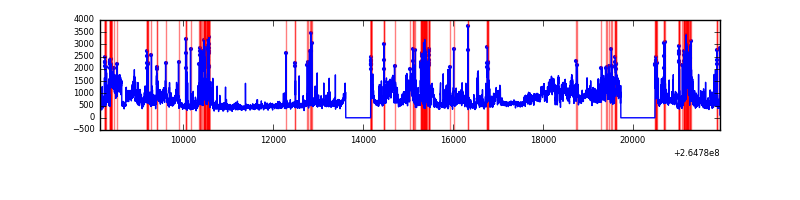 |
Top three noisy pixels from each quadrant. If the there are fewer than three noisy pixels in the level2.evt file, extra rows are filled as -1
| Pixel properties | Quadrant properties | ||||||
|---|---|---|---|---|---|---|---|
| Quadrant | DetID | PixID | Counts | Sigma | Mean | Median | Sigma |
| A | 12 | 189 | 149493 | 493.33 | 1483 | 1455 | 300.1 |
| A | 8 | 15 | 127170 | 418.94 | 1483 | 1455 | 300.1 |
| A | 0 | 226 | 13048 | 38.63 | 1483 | 1455 | 300.1 |
| B | 10 | 16 | 601544 | 2126.36 | 1466 | 1431 | 282.2 |
| B | 10 | 245 | 310064 | 1093.57 | 1466 | 1431 | 282.2 |
| B | 0 | 189 | 52778 | 181.93 | 1466 | 1431 | 282.2 |
| C | 3 | 233 | 586099 | 1738.55 | 1439 | 1446 | 336.3 |
| C | 13 | 61 | 10271 | 26.24 | 1439 | 1446 | 336.3 |
| C | 14 | 234 | 7475 | 17.93 | 1439 | 1446 | 336.3 |
| D | 12 | 110 | 1339356 | 3960.7 | 1421 | 1387 | 337.8 |
| D | 8 | 195 | 1010067 | 2985.93 | 1421 | 1387 | 337.8 |
| D | 1 | 52 | 584762 | 1726.93 | 1421 | 1387 | 337.8 |
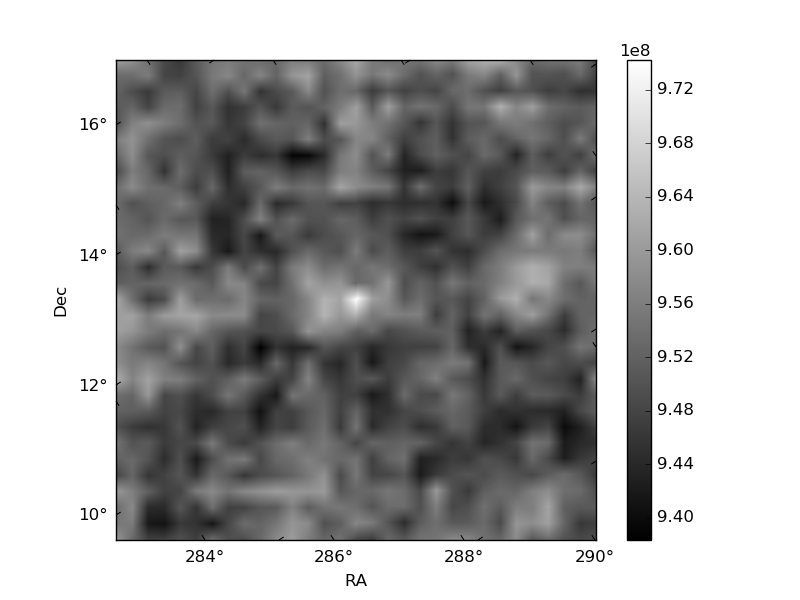
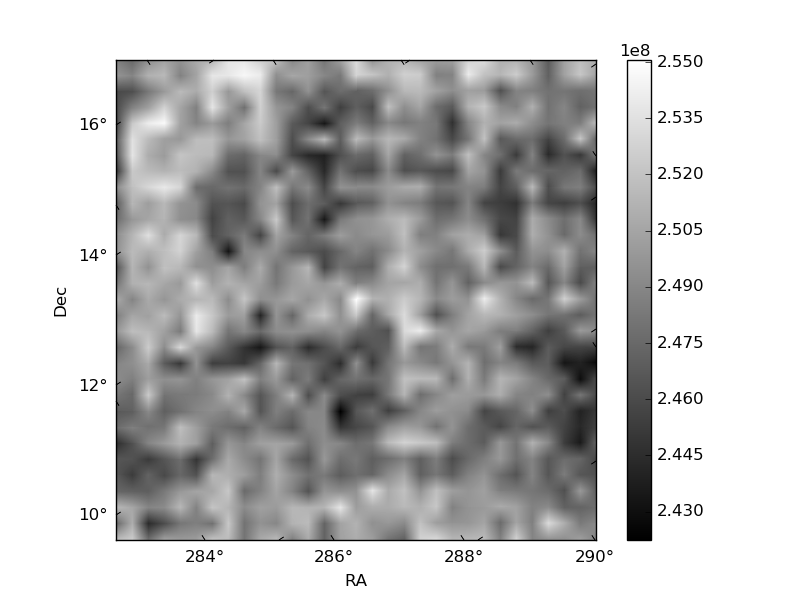
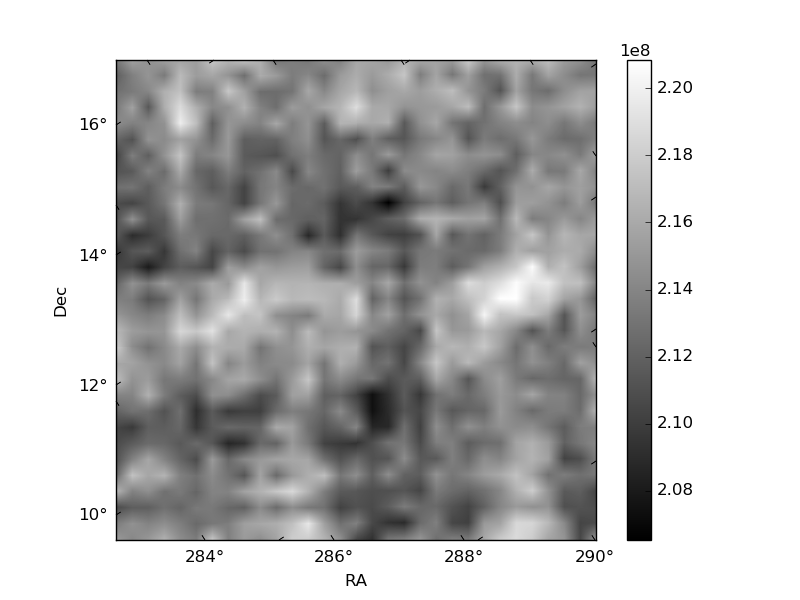
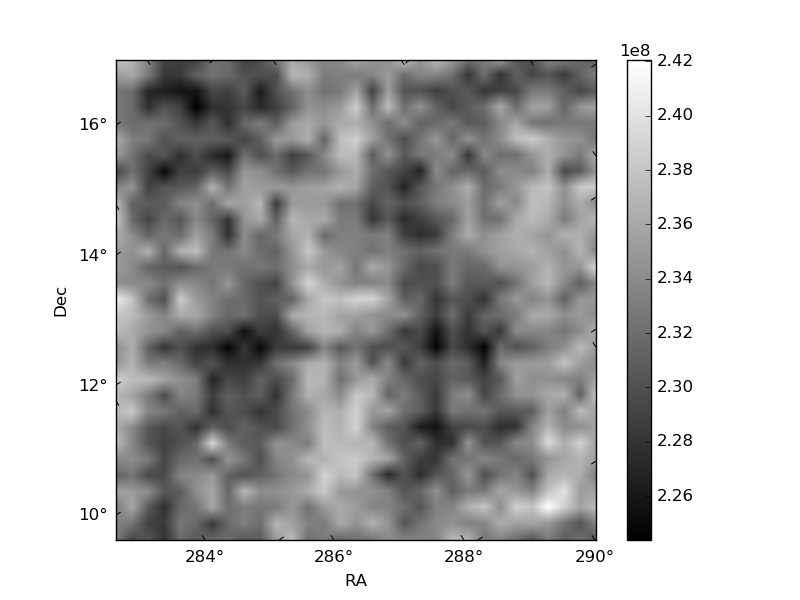
Histogram calculated using DETX and DETY for each event in the final _common_clean file
| Quadrant A | 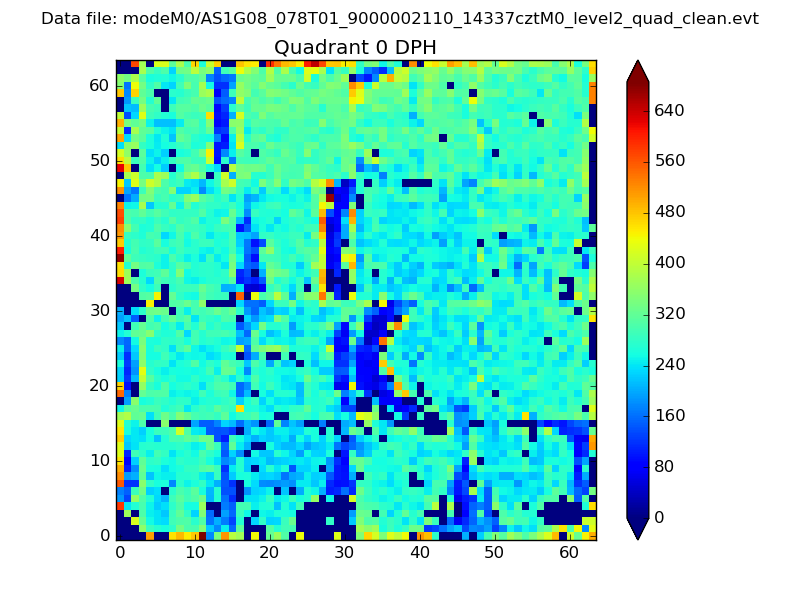 |
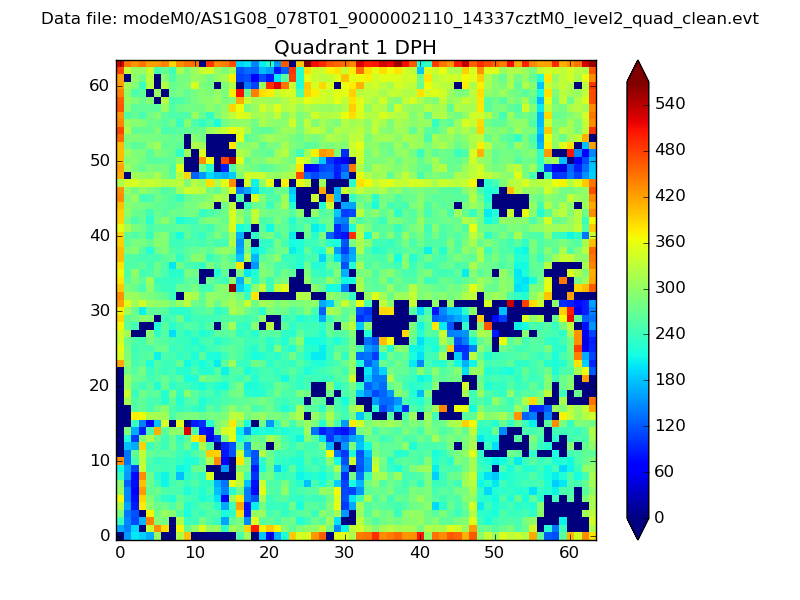 |
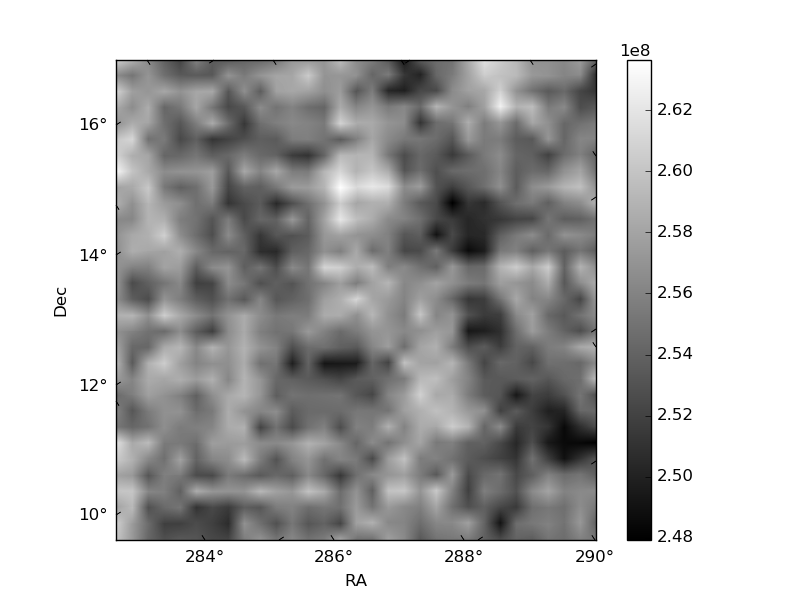
Quadrant B |
|---|---|---|---|
| Quadrant D | 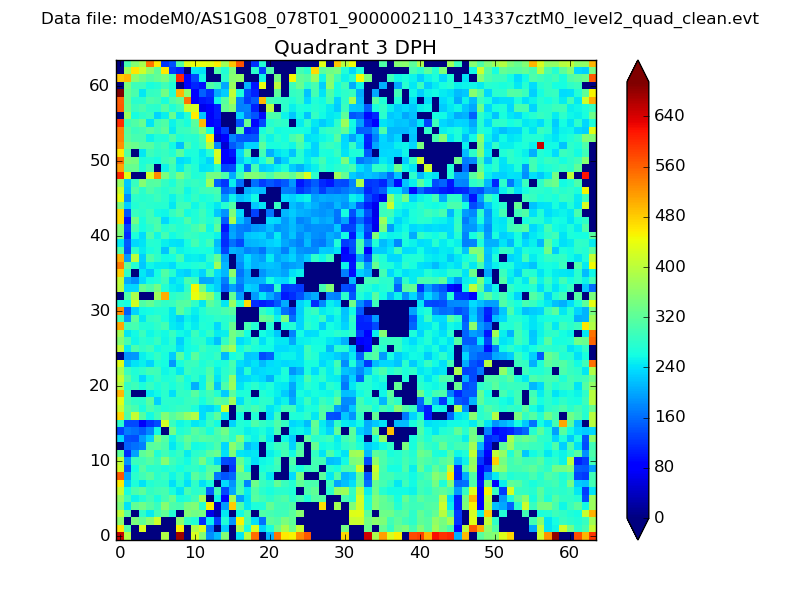 |
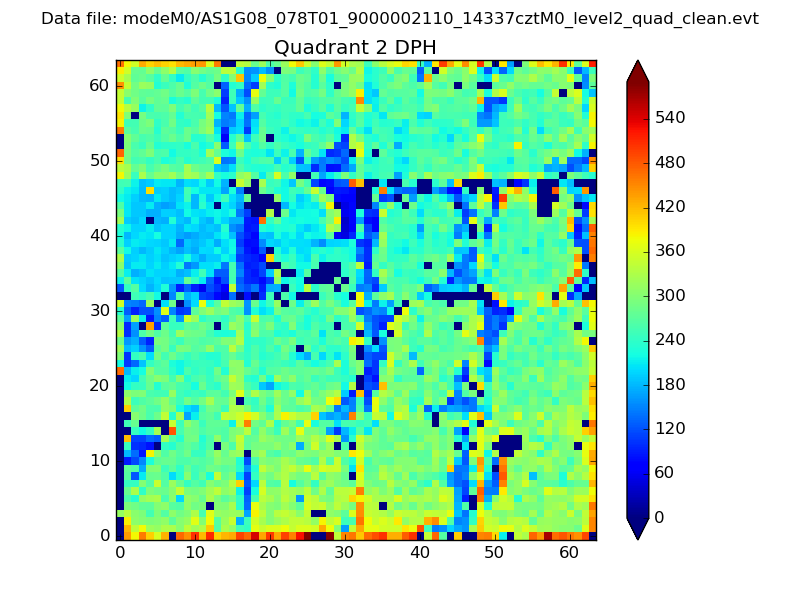 |
Quadrant C |
| Plot type | Count rate plots | Images |
|---|---|---|
| Comparison with Poisson distribution Blue bars denote a histogram of data divided into 1 sec bins. Red curve is a Poisson curve with rate = median count rate of data. |
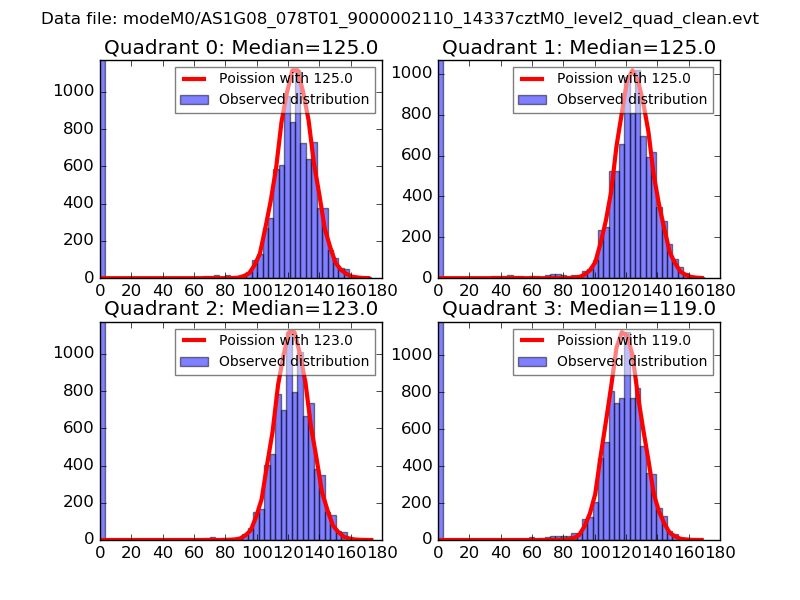 |
 |
| Quadrant-wise count rates Data is divided into 100 sec bins |
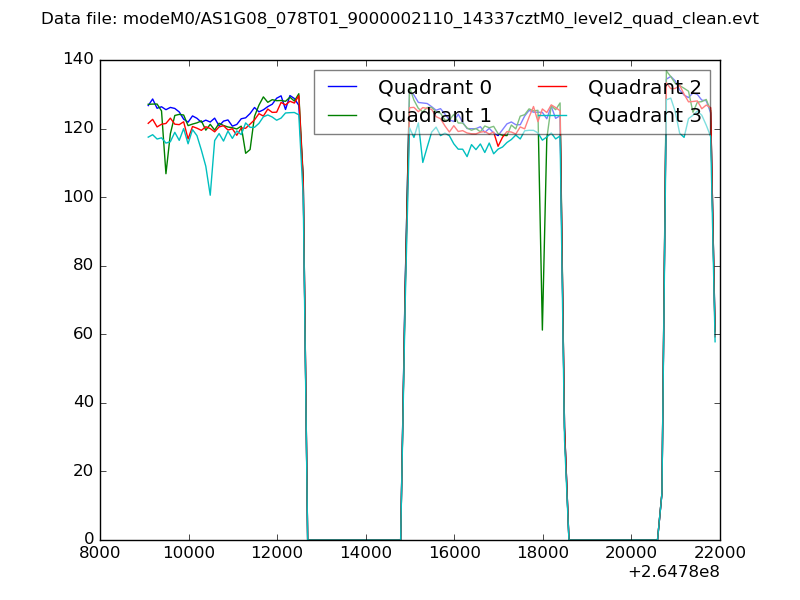 |
|
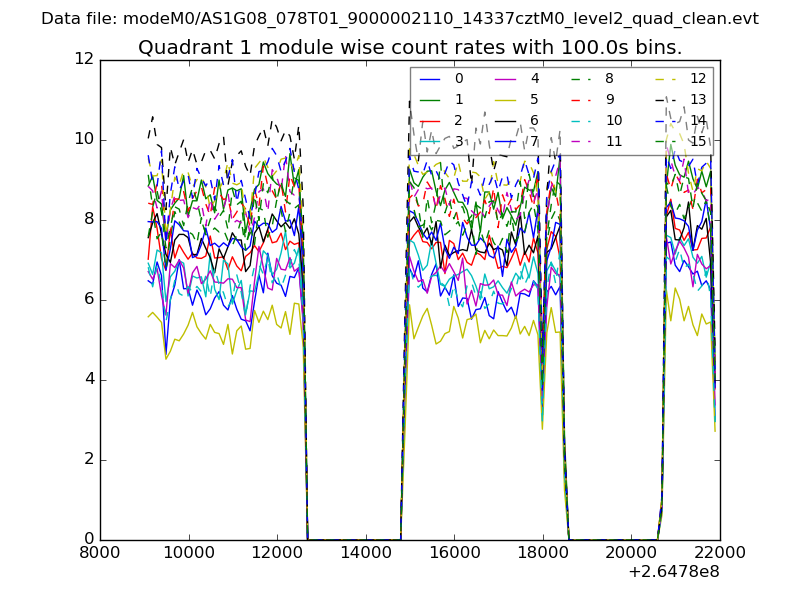
| Module-wise count rates for Quadrant A Data is divided into 100 sec bins |
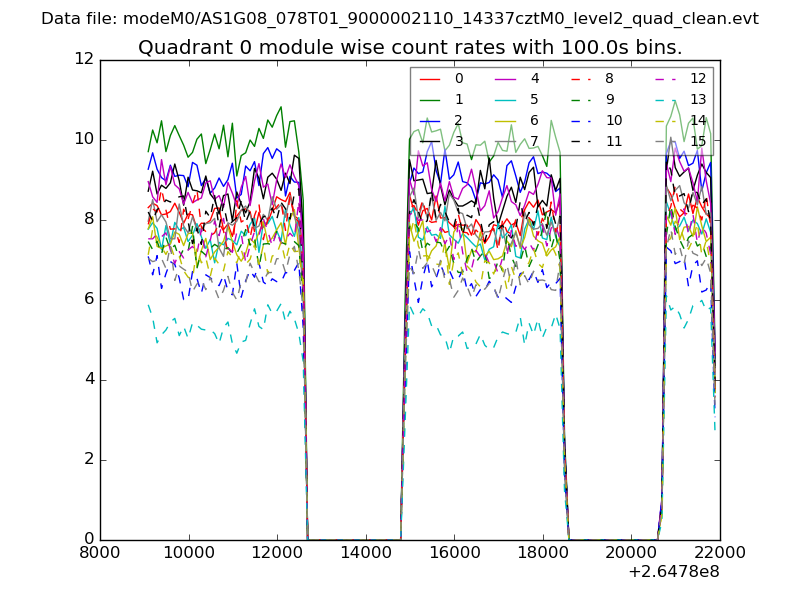 |
 |
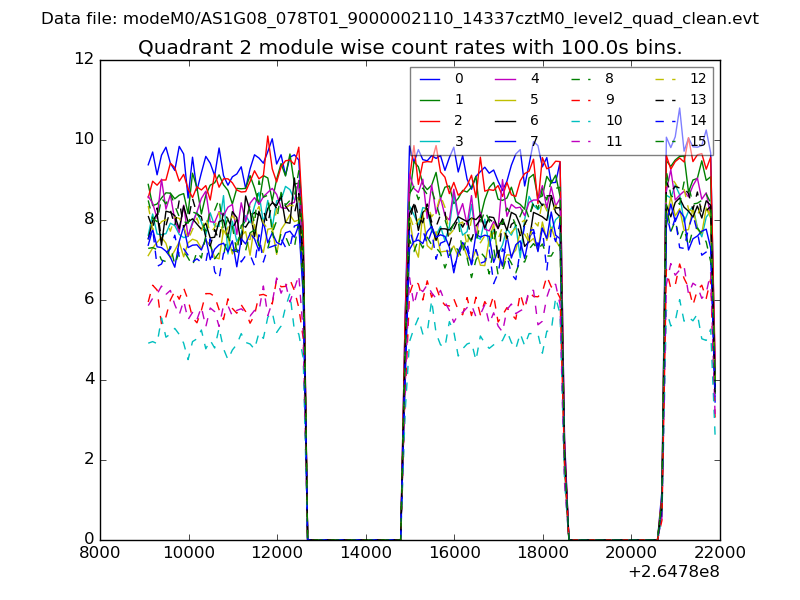
| Module-wise count rates for Quadrant B Data is divided into 100 sec bins |
 |
 |
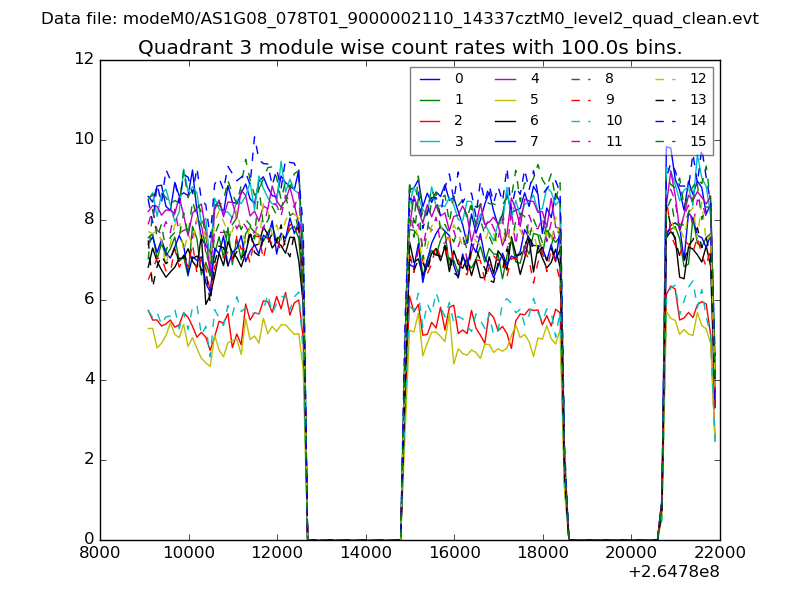
| Module-wise count rates for Quadrant C Data is divided into 100 sec bins |
 |
 |
| Module-wise count rates for Quadrant D Data is divided into 100 sec bins |
 |
 |
| Parameter | Plot |
|---|---|
| CZT HV Monitor | 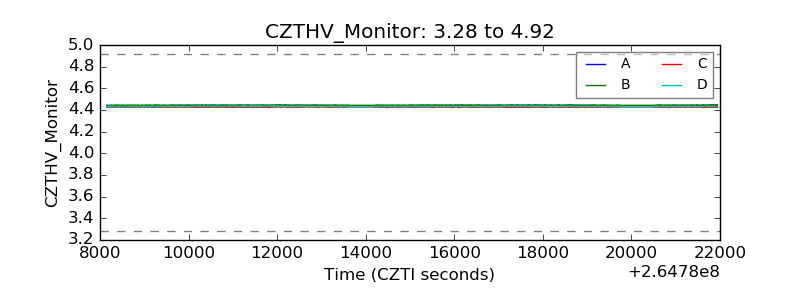 |
| D_VDD | 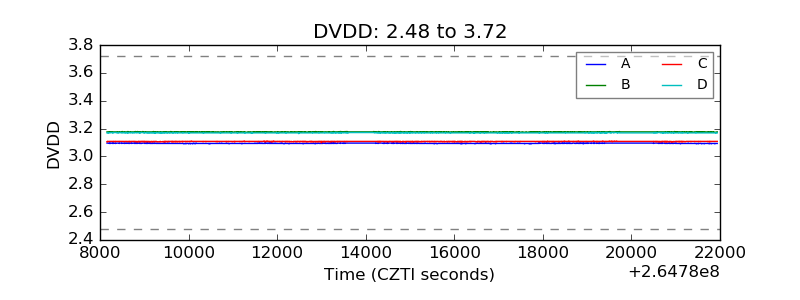 |
| Temperature 1 | 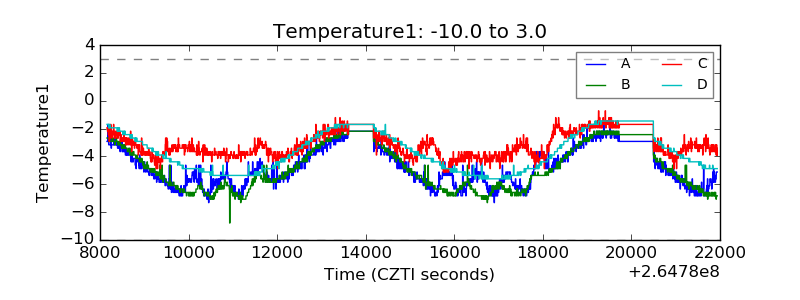 |
| Veto HV Monitor | 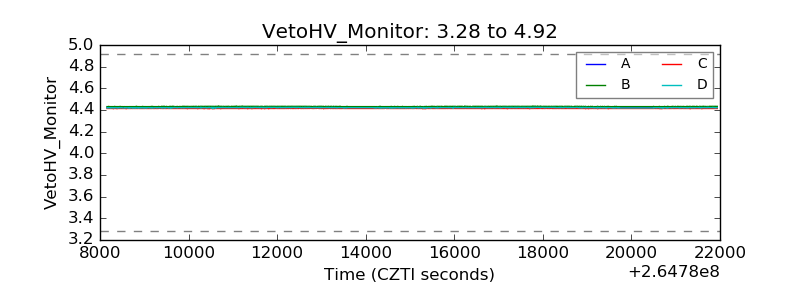 |
| Veto LLD | 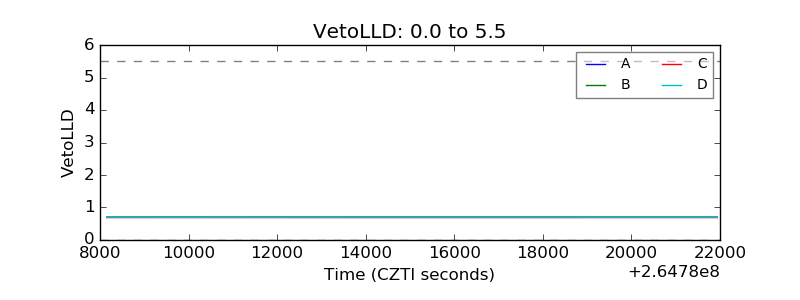 |
| Alpha Counter | 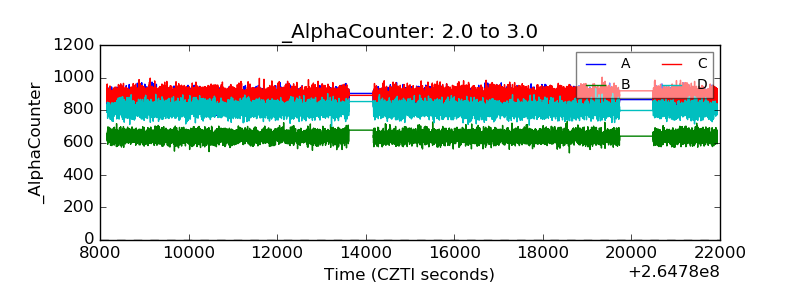 |
| _CPM_Rate | 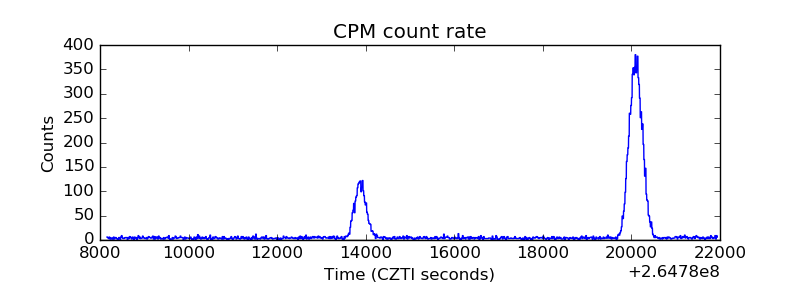 |
| CZT Counter | 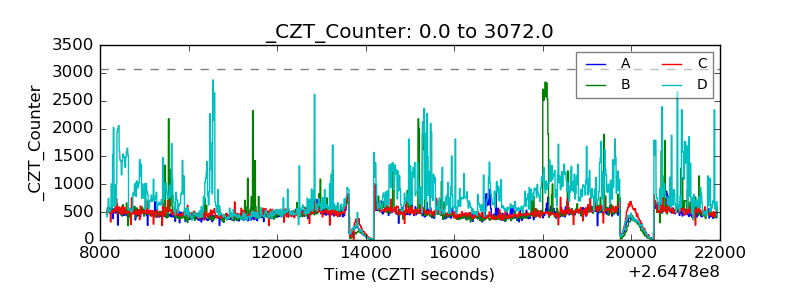 |
| +2.5 Volts monitor |  |
| +5 Volts monitor |  |
| _ROLL_ROT | 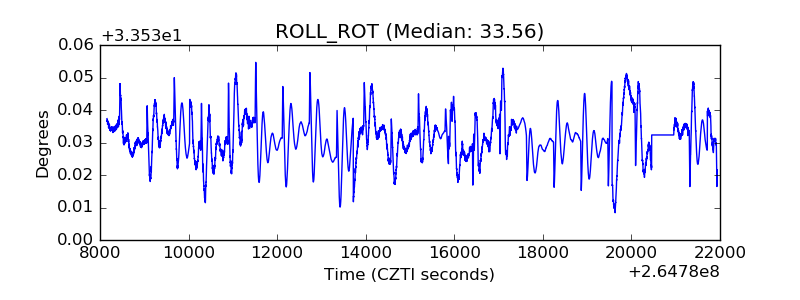 |
| _Roll_DEC |  |
| _Roll_RA | 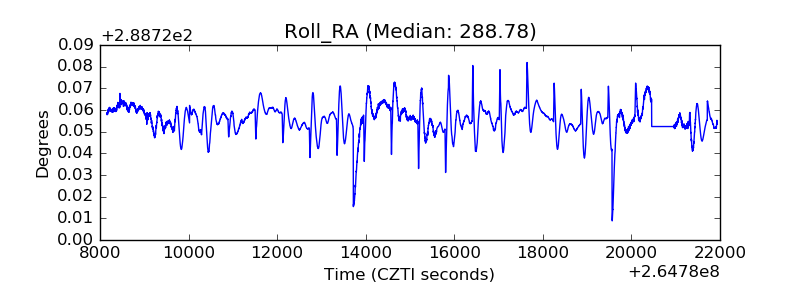 |
| Veto Counter | 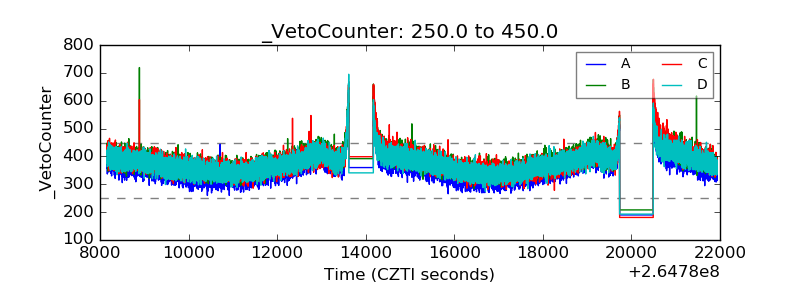 |