| Param | Original file | Final file |
|---|---|---|
| Filename | modeM0/AS1G08_078T01_9000002110_14338cztM0_level2.evt | modeM0/AS1G08_078T01_9000002110_14338cztM0_level2_quad_clean.evt |
| Size (bytes) | 508,224,960 | 96,488,640 |
| Size | 484.7 MB | 92.0 MB |
| Events in quadrant A | 3,244,189 | 622,369 |
| Events in quadrant B | 3,879,630 | 622,158 |
| Events in quadrant C | 3,397,364 | 617,317 |
| Events in quadrant D | 4,416,448 | 593,945 |
| Mode SS | |||
|---|---|---|---|
| Quadrant | BADHDUFLAG | Total packets | Discarded packets |
| A | 0 | 134 | 0 |
| B | 0 | 134 | 0 |
| C | 0 | 134 | 0 |
| D | 0 | 134 | 0 |
| Mode M0 | |||
|---|---|---|---|
| Quadrant | BADHDUFLAG | Total packets | Discarded packets |
| A | 0 | 13935 | 2 |
| B | 0 | 15947 | 1 |
| C | 0 | 13980 | 1 |
| D | 0 | 17904 | 1 |
| Mode M9 | |||
|---|---|---|---|
| Quadrant | BADHDUFLAG | Total packets | Discarded packets |
| A | 0 | 10 | 0 |
| B | 0 | 10 | 0 |
| C | 0 | 10 | 0 |
| D | 0 | 10 | 0 |
| Quadrant | Total seconds | Saturated seconds | Saturation percentage |
|---|---|---|---|
| A | 6696 | 21 | 0.313620% |
| B | 6696 | 161 | 2.404421% |
| C | 6696 | 31 | 0.462963% |
| D | 6696 | 167 | 2.494026% |
Noise dominated data is calculated using 1-second bins in cleaned event files. If a bin has >2000 counts, and if more than 50% of those come from <1% of pixels, then it is considered to be noise-dominated and hence unusable.
| Quadrant | # 1 sec bins | Bins with >0 counts | Bins with >2000 counts | High rate bins dominated by noise | Noise dominated (total time) | Noise dominated (detector-on time) | Marked lightcurve |
|---|---|---|---|---|---|---|---|
| A | 7612 | 6698 | 0 | 0 | 0.00% | 0.00% | 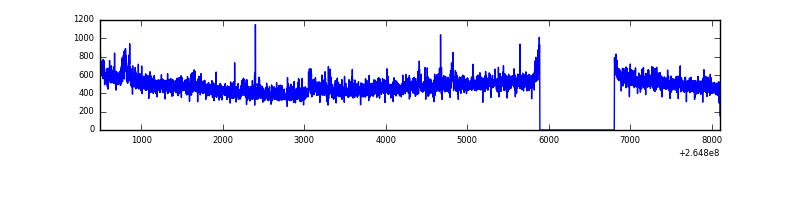 |
| B | 7612 | 6697 | 85 | 85 | 1.12% | 1.27% | 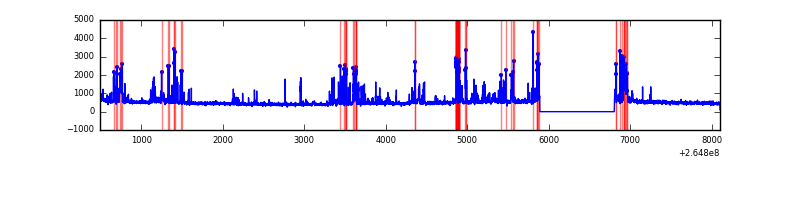 |
| C | 7612 | 6698 | 0 | 0 | 0.00% | 0.00% | 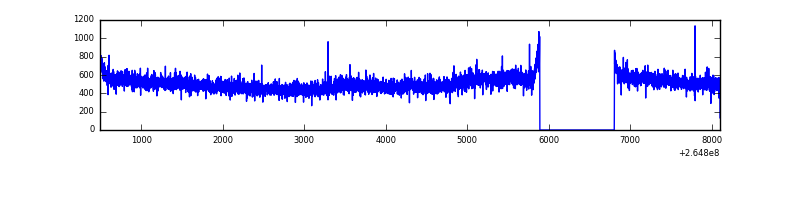 |
| D | 7612 | 6698 | 96 | 96 | 1.26% | 1.43% | 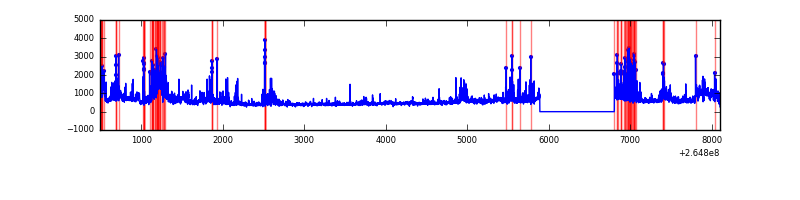 |
Top three noisy pixels from each quadrant. If the there are fewer than three noisy pixels in the level2.evt file, extra rows are filled as -1
| Pixel properties | Quadrant properties | ||||||
|---|---|---|---|---|---|---|---|
| Quadrant | DetID | PixID | Counts | Sigma | Mean | Median | Sigma |
| A | 12 | 189 | 115602 | 706.27 | 804 | 786 | 162.6 |
| A | 8 | 15 | 35534 | 213.75 | 804 | 786 | 162.6 |
| A | 0 | 226 | 7058 | 38.58 | 804 | 786 | 162.6 |
| B | 10 | 16 | 567228 | 3689.2 | 798 | 778 | 153.5 |
| B | 0 | 229 | 118160 | 764.49 | 798 | 778 | 153.5 |
| B | 0 | 189 | 26345 | 166.51 | 798 | 778 | 153.5 |
| C | 3 | 233 | 332533 | 1795.83 | 787 | 792 | 184.7 |
| C | 13 | 61 | 5562 | 25.82 | 787 | 792 | 184.7 |
| C | 3 | 202 | 1840 | 5.67 | 787 | 792 | 184.7 |
| D | 5 | 222 | 482544 | 2592.07 | 775 | 756 | 185.9 |
| D | 1 | 52 | 356764 | 1915.36 | 775 | 756 | 185.9 |
| D | 13 | 122 | 273143 | 1465.47 | 775 | 756 | 185.9 |
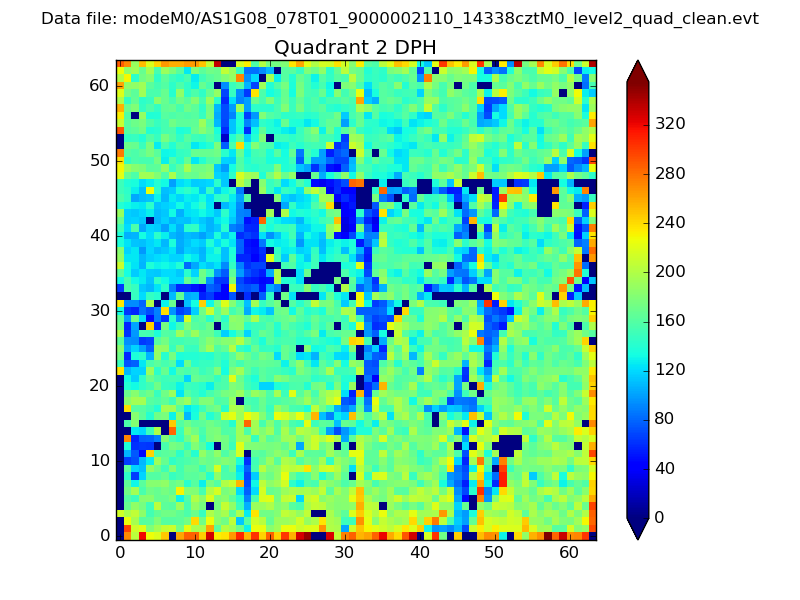
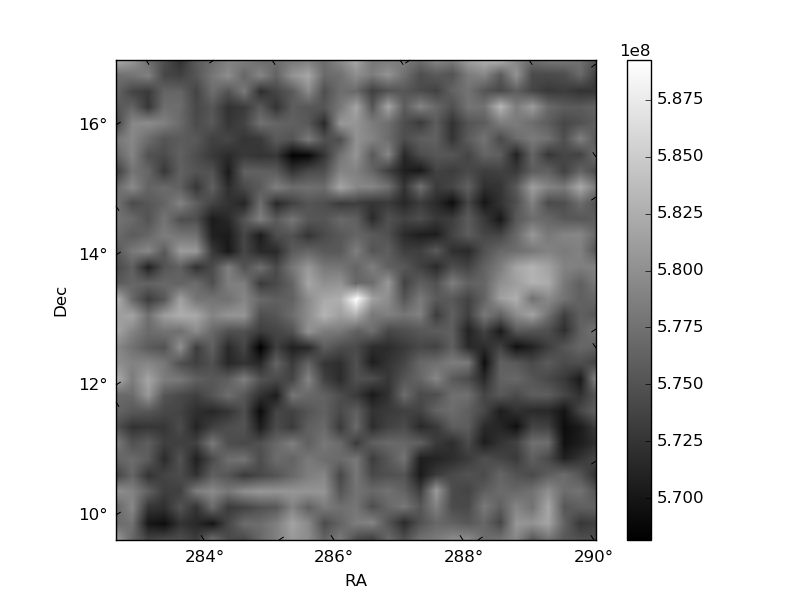
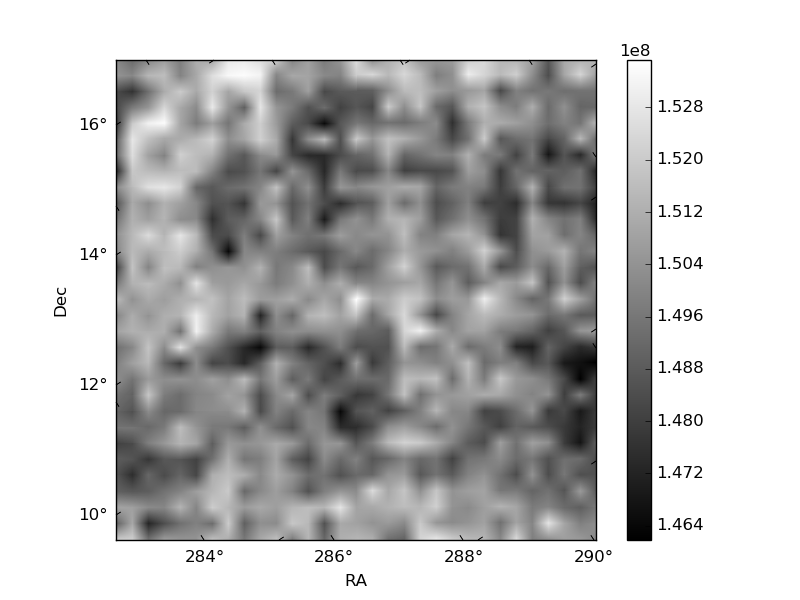
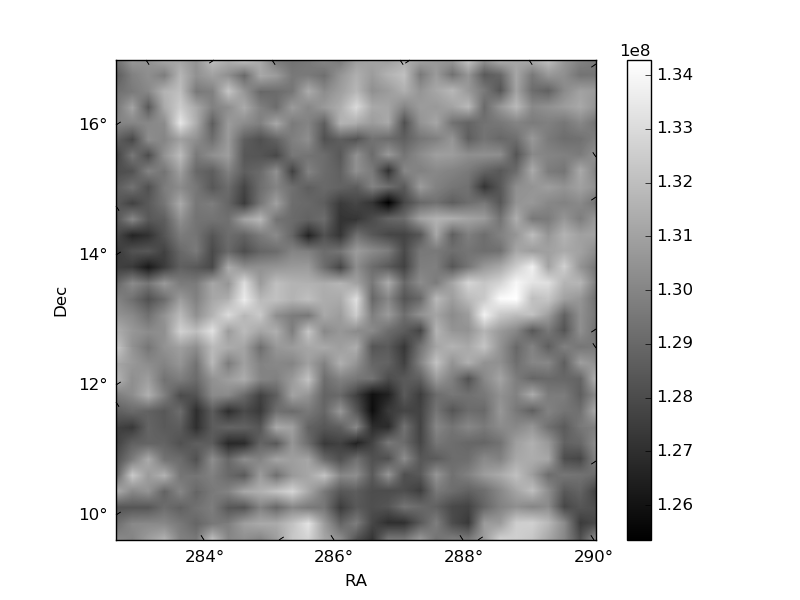
Histogram calculated using DETX and DETY for each event in the final _common_clean file
| Quadrant A | 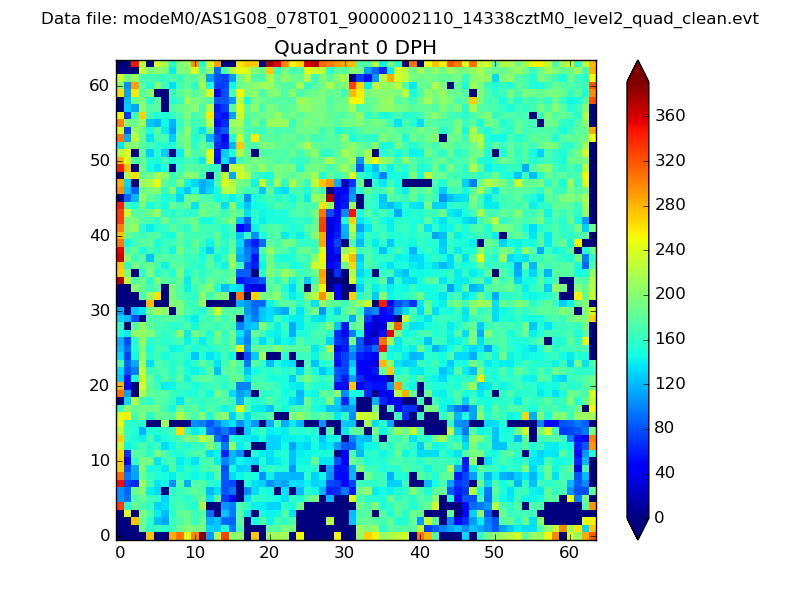 |
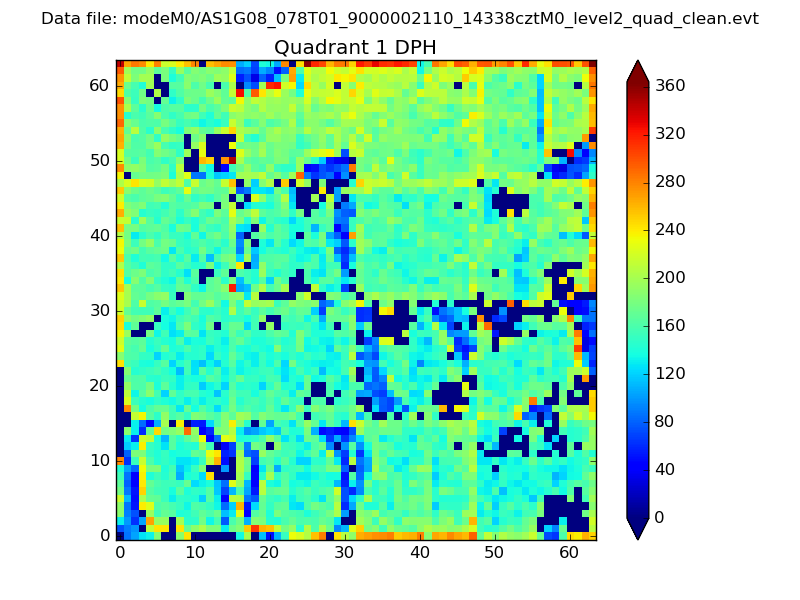 |
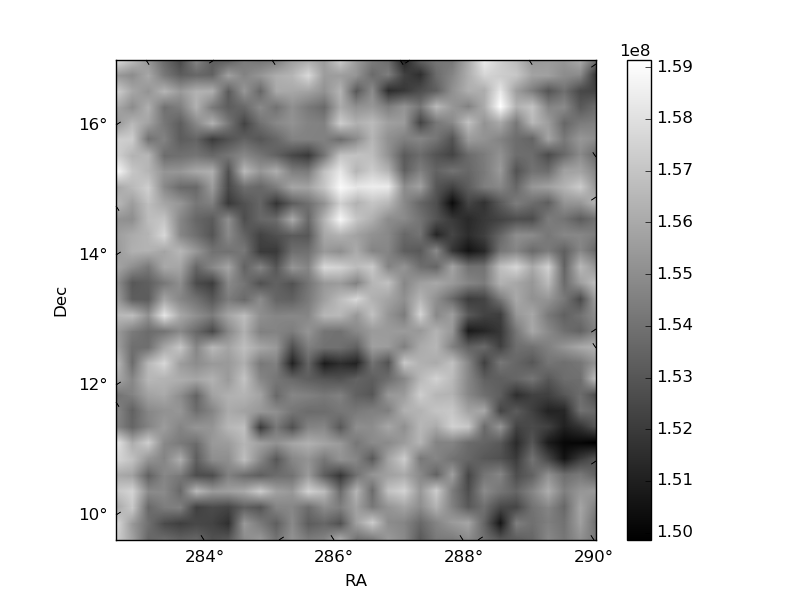
Quadrant B |
|---|---|---|---|
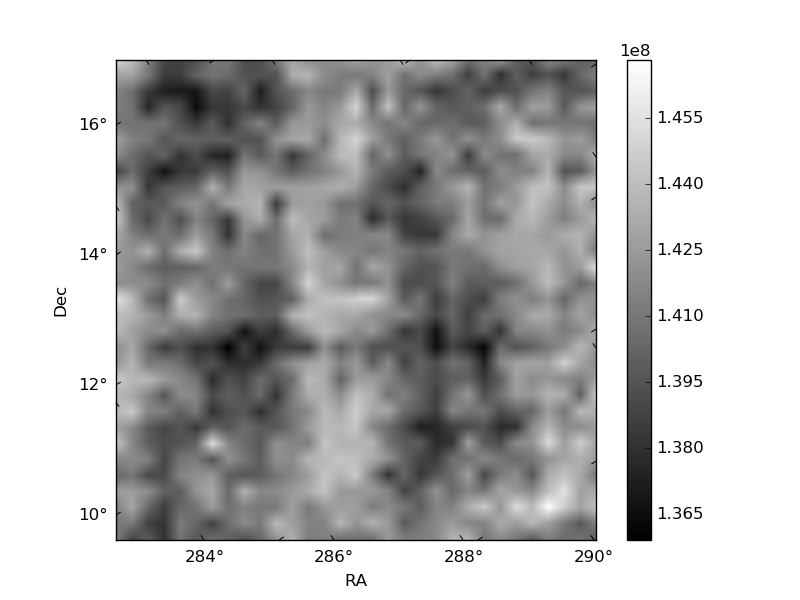
| Quadrant D | 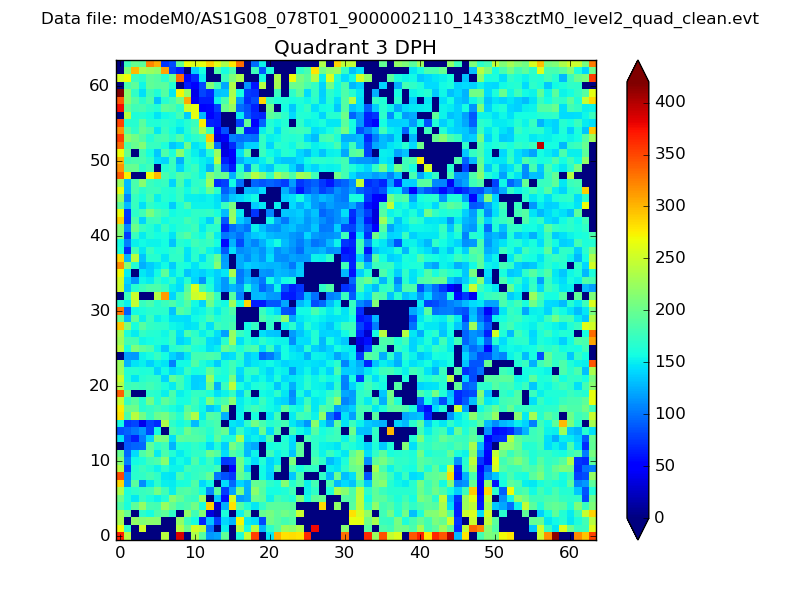 |
 |
Quadrant C |
| Plot type | Count rate plots | Images |
|---|---|---|
| Comparison with Poisson distribution Blue bars denote a histogram of data divided into 1 sec bins. Red curve is a Poisson curve with rate = median count rate of data. |
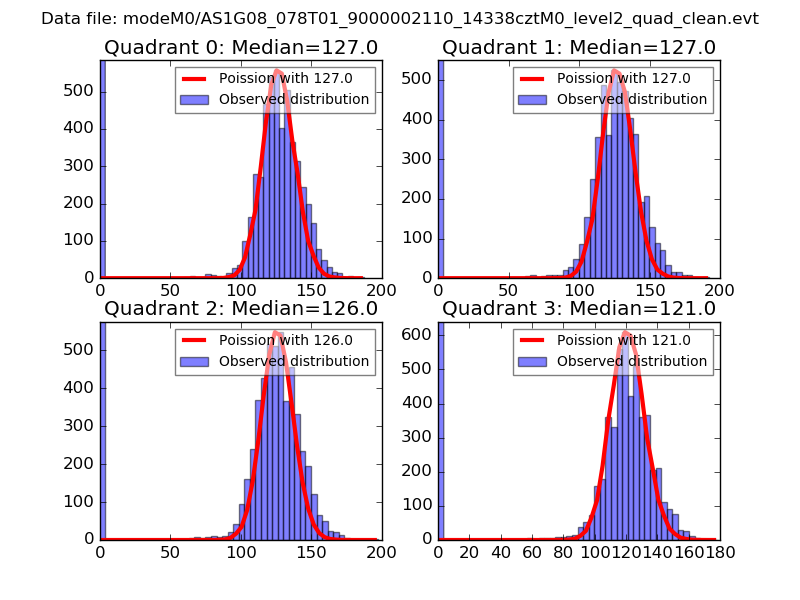 |
 |
| Quadrant-wise count rates Data is divided into 100 sec bins |
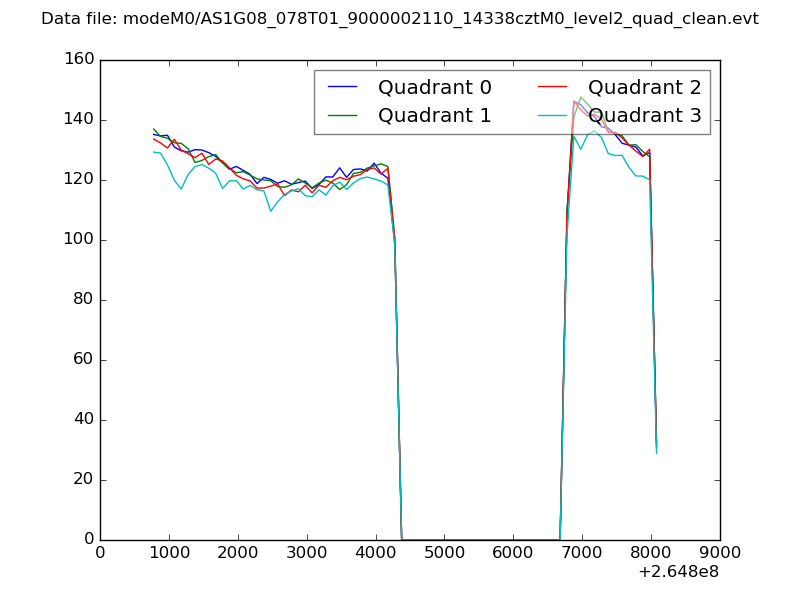 |
|
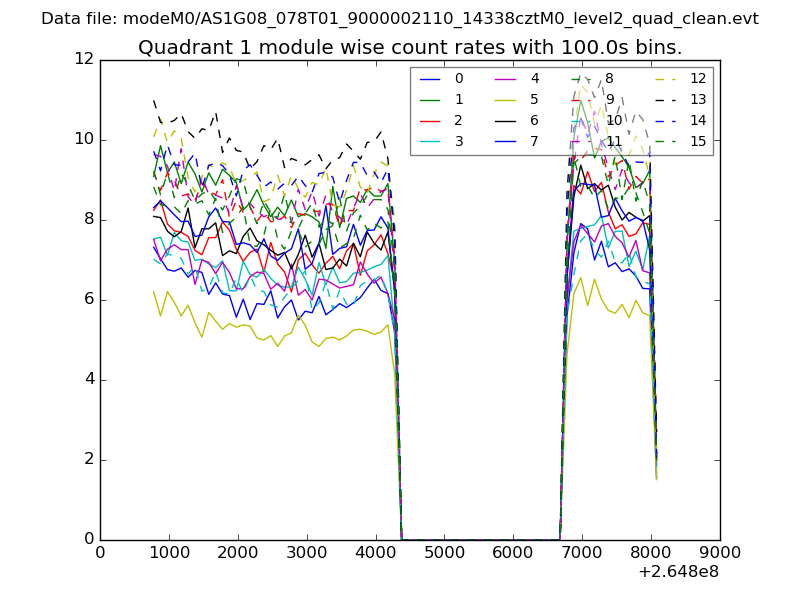
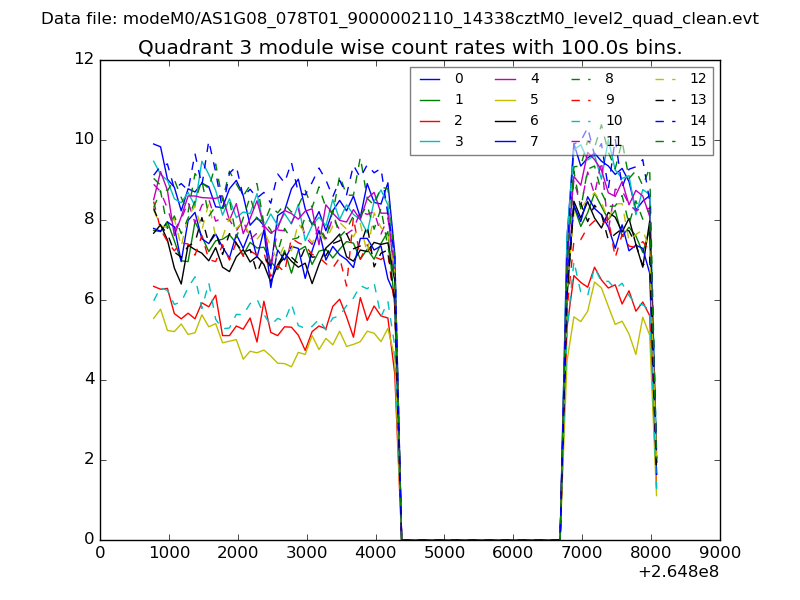
| Module-wise count rates for Quadrant A Data is divided into 100 sec bins |
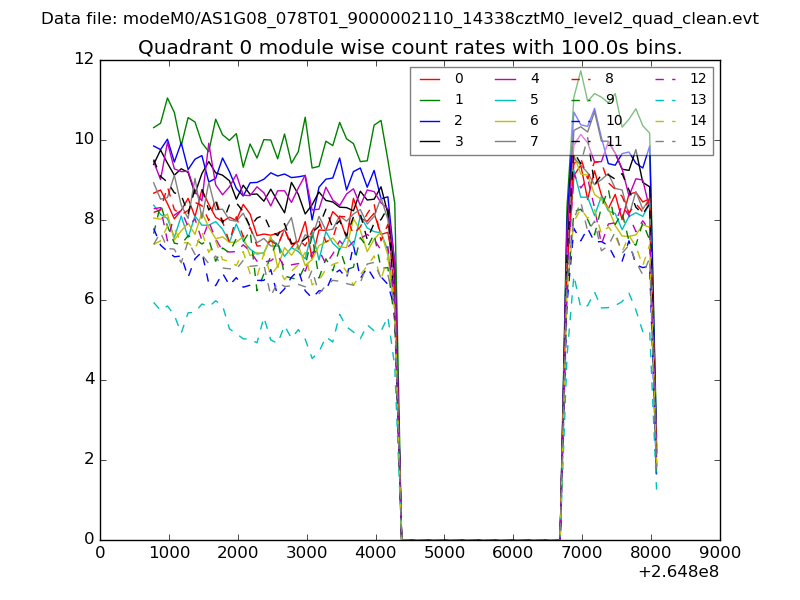 |
 |
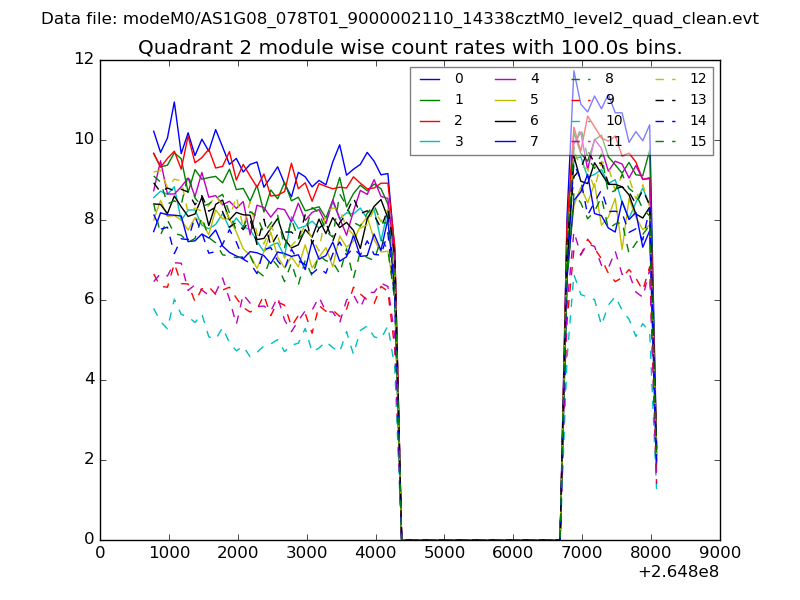
| Module-wise count rates for Quadrant B Data is divided into 100 sec bins |
 |
 |
| Module-wise count rates for Quadrant C Data is divided into 100 sec bins |
 |
 |
| Module-wise count rates for Quadrant D Data is divided into 100 sec bins |
 |
 |
| Parameter | Plot |
|---|---|
| CZT HV Monitor | 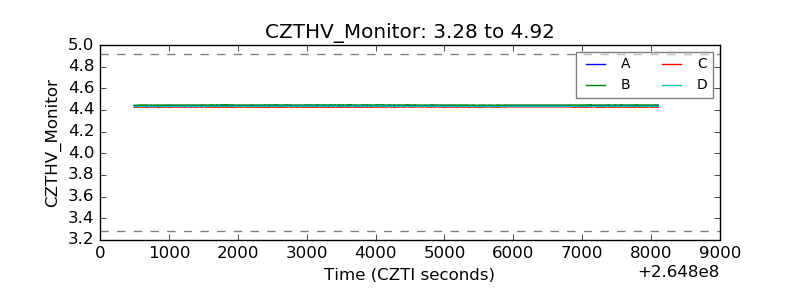 |
| D_VDD | 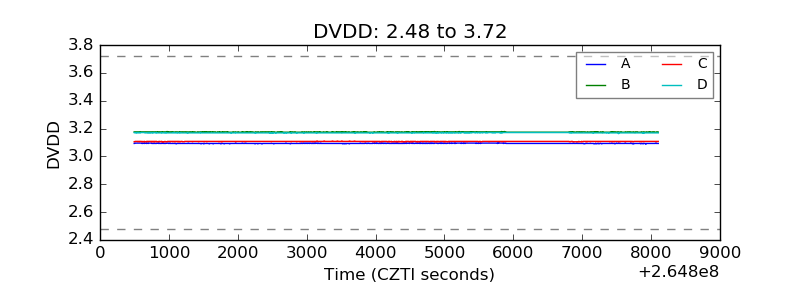 |
| Temperature 1 | 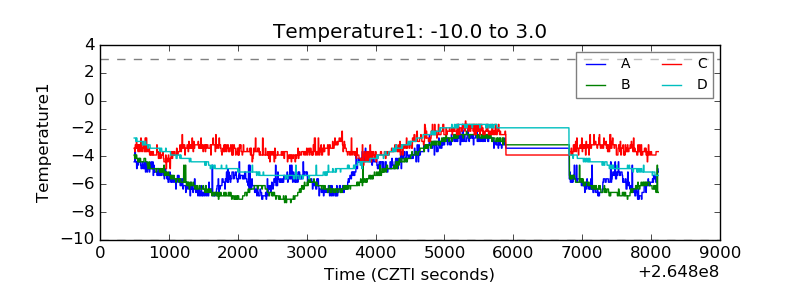 |
| Veto HV Monitor | 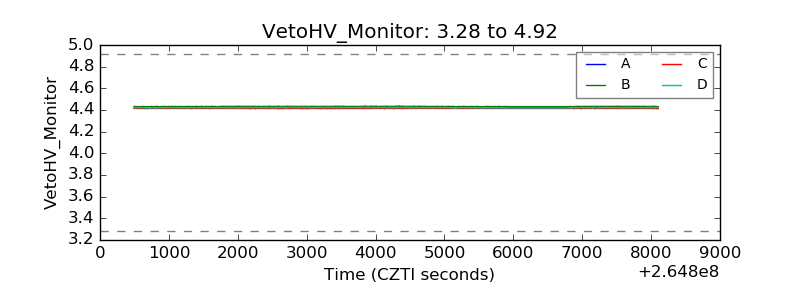 |
| Veto LLD | 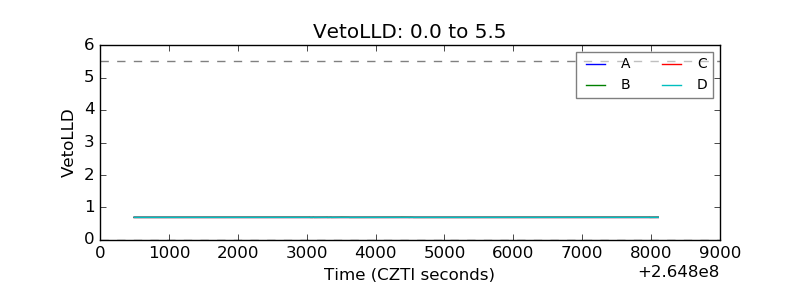 |
| Alpha Counter | 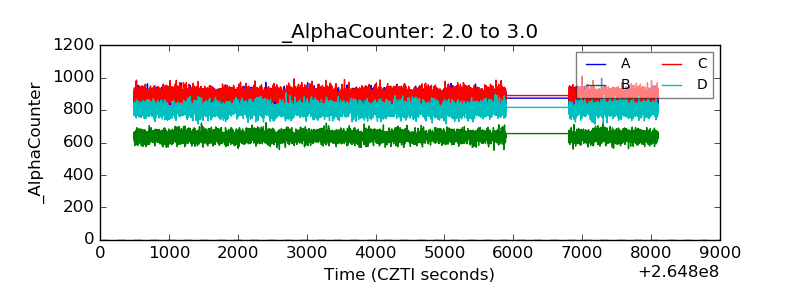 |
| _CPM_Rate | 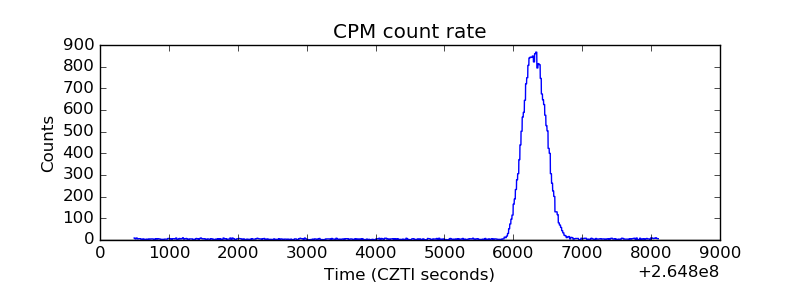 |
| CZT Counter | 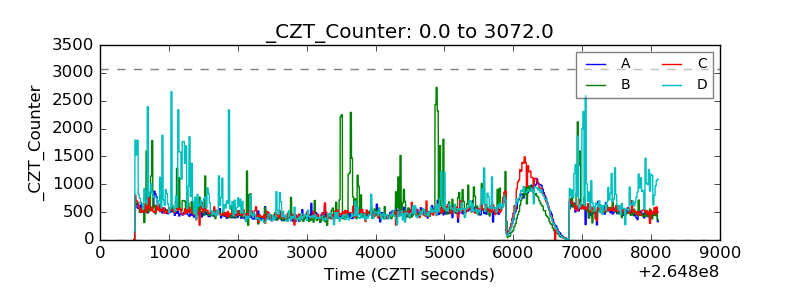 |
| +2.5 Volts monitor |  |
| +5 Volts monitor |  |
| _ROLL_ROT | 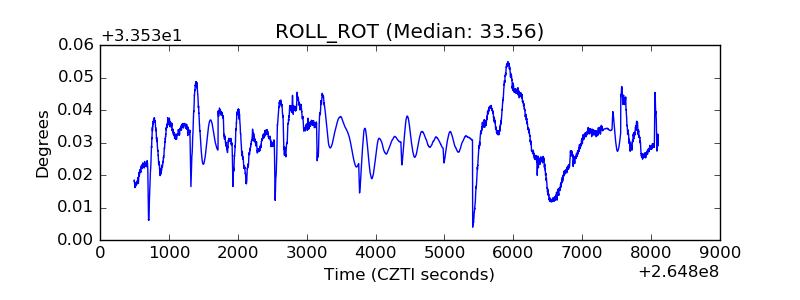 |
| _Roll_DEC | 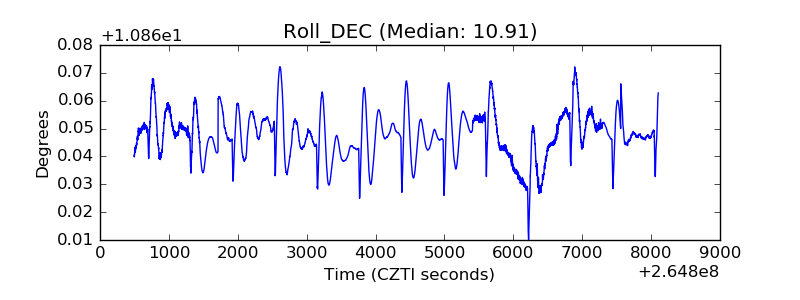 |
| _Roll_RA | 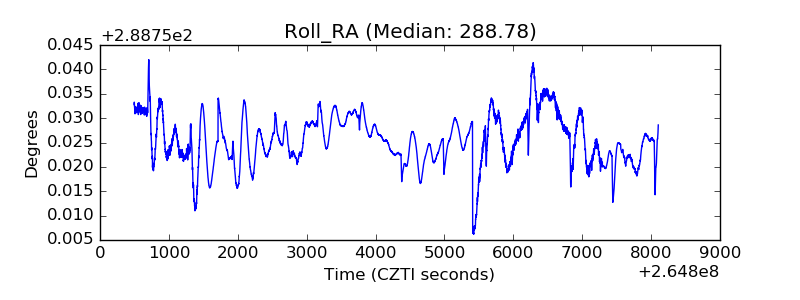 |
| Veto Counter | 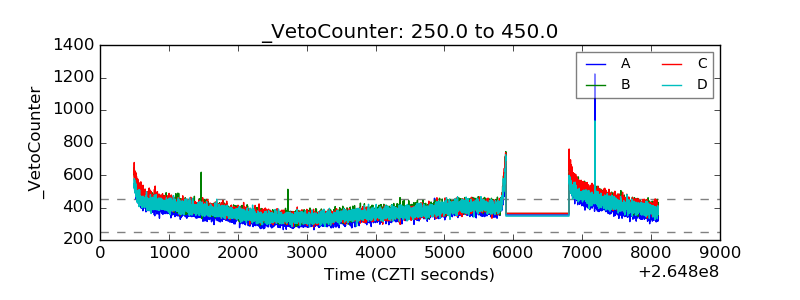 |